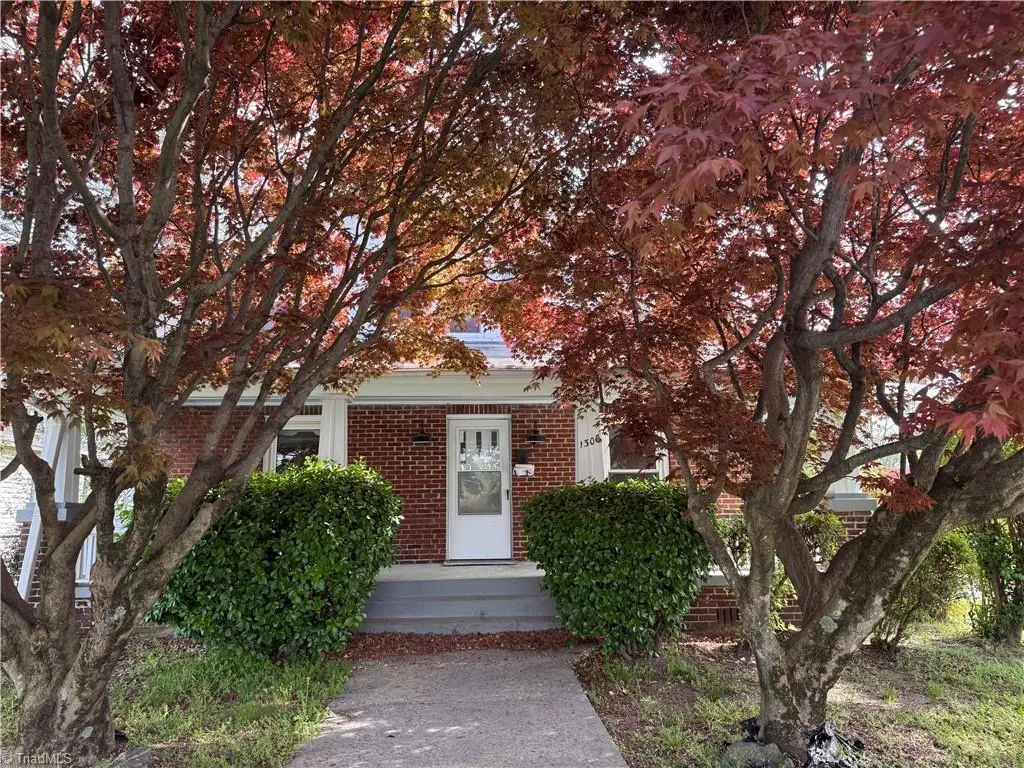
1300 Sloan St · Greensboro, NC
Flood risk 1/10 · Minimal
- FEMA flood zone
- X (unshaded)
- Chance of flooding over 30 yrs
- 0.0%
- Est. flood insurance / yr
- $507 – $1,088
Fire risk 1/10 · Minimal
- Est. fire insurance / yr
- $906 – $1,684
Heat risk 6/10 · Moderate
- Hot days now (above 103°F)
- 7 days/yr
- Hot days in 30 yrs
- 17 days/yr
Wind risk 4/10 · Minor
- Chance of severe wind over 30 yrs
- 15.0%
Air-quality risk 2/10 · Minimal
- Unhealthy air days now
- 1 days/yr
- Unhealthy air days in 30 yrs
- 2 days/yr
Risk factors via First Street. Map © Google.
Why this score? — see what drove the C- grade
The composite is a weighted blend of 9 inputs, each scored 0–100. Each bar is that input's sub-score; the figure is the points it added to the 100-point composite (weight × sub-score).
- Cash flow +16.0/30.0
- ARV discount +15.0/15.0
- DSCR +4.9/10.0
- Livability +4.0/5.0
- Schools +3.6/10.0
- 1% rule +3.3/10.0
- Rent growth +2.9/5.0
- Condition / age +2.5/5.0
- Appreciation +0.0/10.0
$189,900
🖨 Deal sheet (PDF) 📄 Offer letter ✓ Due diligence
Listing remarks
Come tour this CLASSIC BRICK HOME on a level, corner lot. Craftsmanship throughout-extensive moldings. Hardwood flooring, separate formal Dining Room, Large kitchen. Enjoy your evenings on the wide covered porch. Replacement windows. Large rear porch w/ laundry area. Detached carport & storage building. PROPERTY BEING SOLD "AS IS, WHERE IS" SELLER MAKES NO REPRESENTATION OR WARRANTY.
Key facts
- Hardwood flooring
- Classic brick home
- Extensive moldings
Tags
Property features AI
Finance
- Other: Located in the Nocho Park subdivision; Directions: Benbow to Sloan
- HOA & community: No homeowners association
Exterior
- Parking: Driveway; Detached carport (1 vehicle)
- Utilities: Public water; Public sewer; Electric water heater
- Home design: Residential stick/site-built house; One and one-half levels; Built in 1928; Living room fireplace
- Construction: Brick construction
- Exterior features: Near public transit; Level lot; Storage structure on property; Public transportation nearby; Public maintained road
Interior
- Kitchen: Electric water heater
- Bedrooms: Bedrooms located on the second level
- Flooring: Vinyl flooring; Wood flooring
- Bathrooms: 2 full bathrooms
- Heating & cooling: Central air conditioning; Forced air heating with natural gas
- Interior features: Primary bedroom located on the main level; Eave storage attic; Insulated windows; Freestanding tub; Cellar
- Laundry & utility: Main-level laundry with dryer connection
Neighborhood map
What this means for you Summary
Snapshot
- This is a 2-bed/1.5-bath single-family listed at $190k.
Deal economics
- At list price, monthly cash flow is $93 ($1k/yr) — positive.
- The deal already cash-flows at list — no discount required.
- To meet the 1% rule (rent ≥ 1% of price), the offer needs to be $157k (17.1% below list).
- Recommended offer: $157k (17.1% below list) — sets the bar for 1% rule.
- Cap rate 6.9% vs local median 3.7% in Greensboro — top-decile yield for the area; either an underpriced asset or a hidden risk that comps aren't pricing in. Stress-test before assuming the spread holds.
Location & tenants
- Location reads 81/100 on livability (#12 in NC, #1,335 nationally) — a professional / high-income tenant draw. Strengths: amenities A+, commute A+, cost of living A+; Watch: employment D, crime F.
- Guilford County Schools (urban): math 39% / reading 45% proficiency, ranked #99 of 178 in NC (top 56%) — families likely to look elsewhere, expect single-tenant / working-renter base with shorter leases.
- Zoned schools: Washington Elementary (math 22% / reading 22%, grade F, #1,190 of 1,410 statewide, top 86%, 304 students, 99% FRL); Otis L Hairston Sr Middle (math 13% / reading 22%, grade F, #445 of 475 statewide, top 94%, 631 students, 100% FRL); James B Dudley High (math 34% / reading 40%, grade F, #414 of 535 statewide, top 79%, 1,491 students, 100% FRL) — zoned schools average 99% FRL vs 52% district-wide (47 pts higher); higher-poverty schools than district average — tighter screening recommended.
- Zoned-school proficiency averages 26% at this address vs 42% district-wide (-16 pts) — the specific schools serving this property underperform the Guilford County Schools average; the district grade overstates school quality for this exact location.
- Market conditions: Rents rising (+1.8%/yr); 130 active listings in the ZIP; 16 comparable units currently listed for rent nearby; rentals at typical pace (median 25d on market — plan ~3-4 weeks tenant-placement turnaround); 3,843 units permitted in Guilford County in 2024 (2,397 in 5+ unit buildings).
- This rent runs 39% of the median local income ($48k/yr) — at the standard rent-burdened threshold; future hikes will face affordability resistance.
Forward outlook
- Local home prices are declining (-3.0%/yr); year-one equity from $1k of loan paydown is wiped out by about $6k of value loss. Plan a longer hold.
- Guilford County population projected at +26% by 2050 — long-run rental-demand tailwind backs the buy-and-hold thesis.
Negotiation context
- It's been on market 79 days — a 6% lower offer ($179k) is reasonable based on typical stale-listing flexibility.
Risks & watch-outs
- Watch-outs: built in 1928 — expect roof / HVAC / electrical / plumbing capex.
- Climate carrying-cost: extreme-heat days projected 7→17/yr by 2055 (HVAC capex compounding) — expect insurance premiums to compound above CPI over the hold.
Questions for the listing agent
- It's been on market 79 days. Have you received any prior offers? Is the seller open to a 17% concession, seller financing, or rate buy-down credit?
- Built in 1928 — when were the roof, HVAC, electrical panel, plumbing, and water heater last replaced?
- Why hasn't it sold? Are there any deal-killer items the seller is aware of (foundation, flood, title, zoning, code violations)?
- Is there a deadline driving the sale (1031 exchange, divorce, estate, relocation)? That informs how much negotiation room exists.
- Crime grade is F in this area — have there been break-ins, vandalism, or insurance claims at this property in the last 3 years? What carrier currently insures it and at what premium?
- What's the average days-on-market for RENTAL listings here right now (not sales)? A rising rental-DOM trend means longer vacancies and softer asking-rent achievability than the comps imply.
- What's the recent tenant-quality profile in this submarket — average credit score on applications, eviction rate, late-payment / NSF rate, and stable-employment percentage? A property-management company in the area should have these aggregated.
- How much new for-sale + rental construction is in the pipeline within 1–3 miles? Heavy new supply typically softens prices + rents 12–24 months out; constrained supply supports both.
Investment metrics
- 1% rule
- 0.83% ✗
- Cap rate
- 6.88%
- Cash-on-cash
- 2.10%
- DSCR
- 1.09
- GRM
- 10.1
CMA / ARV
- ARV (on-the-fly)
- $260,592
- Comps found
- 12
Show comp detail 12 sales within ~0.75 mi
| Address | Dist | Beds/Ba | Sqft | Sold | Price | $/sf | Match |
|---|---|---|---|---|---|---|---|
| 807 Logan St | 0.10mi | 3/1.5 (+1) | 1,426 (-3%) | 9mo | $188,000 | $132 | 78 |
| 1015 E Washington St | 0.25mi | 3/2.0 (+1) | 1,547 (+6%) | 13mo | $250,000 | $162 | 61 |
| 407 Gillespie St | 0.49mi | 3/2.0 (+1) | 1,292 (-12%) | 7mo | $242,000 | $187 | 45 |
| 921 Broad St | 0.58mi | 3/2.5 (+1) | 1,394 (-5%) | 15mo | $240,000 | $172 | 44 |
| 317 Gant St | 0.60mi | 3/2.0 (+1) | 1,288 (-12%) | 4mo | $191,000 | $148 | 41 |
| 724 Gillespie St | 0.38mi | 3/2.0 (+1) | 1,271 (-13%) | 14mo | $247,000 | $194 | 41 |
| 722 Gillespie St | 0.39mi | 3/2.0 (+1) | 1,277 (-13%) | 17mo | $247,999 | $194 | 39 |
| 910 Hackett St | 0.38mi | 3/2.5 (+1) | 1,290 (-12%) | 17mo | $230,000 | $178 | 39 |
| 610 Douglas St | 0.74mi | 3/2.5 (+1) | 1,518 (+4%) | 15mo | $235,000 | $155 | 38 |
| 706 Julian St | 0.68mi | 3/1.5 (+1) | 1,316 (-10%) | 11mo | $127,000 | $97 | 37 |
| 2102 Linda Jones Ave | 0.64mi | 3/2.5 (+1) | 1,262 (-14%) | 3mo | $249,900 | $198 | 35 |
| 2006 Linda Jones Ave | 0.60mi | 3/2.5 (+1) | 1,262 (-14%) | 13mo | $249,900 | $198 | 30 |
Match score weights: distance 35% · size 25% · config 20% · recency 20%. Top-matched comps best support the ARV.
Projected returns pro-forma
-3.0% appreciation · 1.78% rent growth · sell at horizon
- IRR
- -14.2%
- Equity multiple
- 0.50×
- Total profit
- $-26,835
- Equity at exit
- $28,315
- IRR
- -7.4%
- Equity multiple
- 0.55×
- Total profit
- $-23,693
- Equity at exit
- $16,419
Cash invested: $53,172 (down + closing). Projections, not guarantees.
Landlord ↔ Tenant lean methodology
- Overall (STATE)
- 85 Strongly Landlord-Friendly
- State North Carolina
- 85 Strongly Landlord-Friendly · R+3
- County
- — inherits STATE
- City
- — inherits STATE
ZIP-level market 27401
- Home prices YoY
- -28.9%
- Rents YoY
- 1.8%
- Active inventory
- 130
- Price-to-rent
- 10.1×
Monthly cashflow live
- Estimated rent
- $1,574 high interval (Pro) →
- Mortgage (P&I)
- −$996
- Tax from tax record
- −$76 /mo · $907/yr
- Insurance
- −$79
- HOA
- −$0
- Vacancy / Maint / Mgmt
- −$331
- Net cashflow
- $93
Break-even live
Sensitivity live
| Price | -10% $200 | -5% $147 | +0% $93 | +5% $39 | +10% $-15 |
|---|---|---|---|---|---|
| Rent | -10% $-31 | -5% $31 | +0% $93 | +5% $155 | +10% $217 |
| Rate | -1.0pp $189 | -0.5pp $141 | base $93 | +0.5pp $44 | +1.0pp $-6 |
UW: 25.0% down · 7.5% · 30yr · 1.5% tax · 5.0% vac · 8.0% maint · 8.0% mgmt
Financing live
Cash to close
- Down payment
- $47,475
- Closing costs
- $5,697
- Reserves months
- —
- Total cash needed
- —
Loan-product check · same deal, 3 products live
Conventional
25% down · 7.5% · 30yr
- Down + closing
- —
- Monthly P&I
- —
- Monthly cashflow
- —
- DSCR
- —
- Eligible?
- —
Personal DTI + credit; lowest rate.
DSCR
20% down · 8.5% · 30yr
- Down + closing
- —
- Monthly P&I
- —
- Monthly cashflow
- —
- DSCR
- —
- Eligible?
- —
No personal income docs; deal must DSCR.
Hard money
10% down · 12.0% · 12mo
- Down + closing
- —
- Monthly P&I
- —
- Monthly cashflow
- —
- DSCR
- —
- Eligible?
- —
Short-term bridge; refi at stabilization.
Rent comps 16 comps
| Address | Beds | Baths | Sqft | Rent | $/sqft | DOM | Units | Dist |
|---|---|---|---|---|---|---|---|---|
| 710 Reid St Greensboro, NC | 3.0 | 1.0 | 925 | $1,395 | $1.51 | 16d | 1 | 0.42mi |
| 506 Martin St Greensboro, NC | 3.0 | 2.0 | 1296 | $1,500 | $1.16 | 25d | 1 | 0.61mi |
| 201 Huffman St Greensboro, NC | 3.0 | 2.0 | 1350 | $1,000 | $0.74 | 16d | 1 | 0.69mi |
| 405 N Dudley St Greensboro, NC | 3.0 | 2.0 | 1264 | $2,200 | $1.74 | 16d | 1 | 0.73mi |
| 904 Stephens St Greensboro, NC | 3.0 | 1.0 | 1052 | $1,490 | $1.42 | 16d | 1 | 0.84mi |
| 112 S Raleigh St Greensboro, NC | 3.0 | 1.0 | 1000 | $1,200 | $1.20 | 25d | 1 | 0.91mi |
| 110 S Raleigh St Greensboro, NC | 3.0 | 1.0 | 1000 | $1,200 | $1.20 | 25d | 1 | 0.92mi |
| 2117 Tuscaloosa St Greensboro, NC | 3.0 | 1.0 | 1000 | $1,600 | $1.60 | 25d | 1 | 0.93mi |
| 238 E Lewis St #302 Greensboro, NC | 2.0 | 2.0 | 1270 | $1,795 | $1.41 | 25d | 1 | 0.94mi |
| 321 S Elm St Greensboro, NC | 1.0–2.0 | 1.0–2.0 | 950 | $1,787 | $1.88 | 16d | 8 | 1.02mi |
| 2007 S Benbow Rd Greensboro, NC | 3.0 | 1.0 | 960 | $1,100 | $1.15 | 25d | 1 | 1.12mi |
| 1404 Ardmore Dr Greensboro, NC | 3.0 | 2.0 | 1094 | $1,625 | $1.49 | 16d | 1 | 1.13mi |
| 201 N Elm St Greensboro, NC | 2.0 | 2.0 | 1154 | $2,195 | $1.90 | 25d | 1 | 1.13mi |
| 201 N Elm St Greensboro, NC | 2.0 | 2.0 | 1046 | $2,298 | $2.20 | 16d | 2 | 1.14mi |
| 1610 Eastwood Ave Greensboro, NC | 3.0 | 2.0 | 950 | $1,750 | $1.84 | 25d | 1 | 1.34mi |
| 451 N Eugene St Greensboro, NC | 1.0–2.0 | 1.0–2.0 | 1021 | $2,309 | $2.26 | 16d | 6 | 1.44mi |
Listing history 16 events
-
2026-06-22days on market $189,900 Active 79 DOM
-
2026-06-18days on market $189,900 Active 76 DOM
-
2026-06-17days on market $189,900 Active 75 DOM
-
2026-06-16days on market $189,900 Active 74 DOM
-
2026-06-15days on market $189,900 Active 73 DOM
-
2026-06-14days on market $189,900 Active 71 DOM
-
2026-06-10days on market $189,900 Active 68 DOM
-
2026-06-09days on market $189,900 Active 67 DOM
-
2026-06-08days on market $189,900 Active 66 DOM
-
2026-06-07days on market $189,900 Active 65 DOM
-
2026-06-03days on market $189,900 Active 61 DOM
-
2026-06-02days on market $189,900 Active 60 DOM
-
2026-06-01days on market $189,900 Active 59 DOM
-
2026-05-31days on market $189,900 Active 58 DOM
-
2026-05-31days on market $189,900 Active 57 DOM
-
2026-04-03$189,900 Active
ⓘ Source: listings_history table (triggers on properties + properties_extension) + one-shot
backfill from property_details.listing_events for pre-trigger history.
Tax reassessment forecast NC · Resets to sale price
- Current annual tax
- $907 · $76/mo
- Projected year-2 tax
- $1,557 · $130/mo
- Expected delta
- +$650/yr (+$54/mo · 71.7%)
ⓘ Screening estimate from a state-policy table — verify with the county assessor before closing.
Climate risk First Street
- Flood 1/10 Low FEMA zone X (unshaded) · 0% chance over 30 yrs
- Wildfire 1/10 Low
- Heat 6/10 Major 7 d/yr ≥103°F today · 17 d/yr by 30 yrs out
- Wind 4/10 Moderate 15% chance of damaging wind over 30 yrs
- Air quality 2/10 Low 1 unhealthy d/yr today · 2 by 30 yrs out
Nearby sold comps map
Loading sold comps map…
Walkable amenities ~0.75 mi
Loading nearby amenities…
Taxation est. · year 1
- Rental income
- $18,889
- − Mortgage interest
- −$10,637
- − Property taxes
- −$907
- − Insurance
- −$950
- − Repairs & maintenance
- −$1,511
- − Management
- −$1,511
- − Depreciation
- −$5,524
- Taxable loss
- −$2,151
- Est. tax savings @ 24.0%
- +$516
- After-tax cash flow
- $1,632/yr
For passive investors: Depreciation is non-cash, so a rental often shows a tax loss while cash-flowing — sheltering income. Rental losses are passive: they offset passive income freely, and up to $25,000/yr can offset ordinary (W-2) income if you actively participate and your MAGI is under $100k (phasing out to $0 by $150k); unused losses carry forward. On sale, claimed depreciation is recaptured at up to 25%, and gains may owe capital-gains tax (a 1031 exchange can defer both). Figures are a year-1 estimate at your 24.0% rate — not tax advice; consult a CPA.
Schools (NCES district)
- District
- Guilford County Schools
- NCES district ID
- 3701920
- Math proficiency
- 39% ▲ 1.00%
- Reading proficiency
- 45% ▲ 1.00%
- Median HH income
- $46,315
- Composite
- 35.78/100
- National rank
- #4842
- State rank
- #99 of 178 in NC
Livability — Greensboro
- Score
- 81/100
- State rank
- #12
- US rank
- #1335
Category grades
Schools grade is shown separately in the Schools card above.
Census & demographics
- Census place
- Greensboro, NC
- County
- Guilford County · 487,190 people
- City population
- 329,421
- Metro
- Greensboro-High Point, NC
- Population (ZIP)
- 21,920
- Household income
- $47,972
- Rent vs Own
- Severe rent burden
- 1138.0
Population outlook (Guilford County) Hauer SSP2
- Today (2025)
- 584,596 people
- By 2030
- 616,851 · +5.5%
- By 2040
- 678,451 · +16.1%
- By 2050
- 734,788 · +25.7%
- By 2075
- 862,985 · +47.6%
- By 2100
- 948,704 · +62.3%
Race, ethnicity, and origin ACS 2023
- Neighborhood character
- Majority Black (62%)
- Race & ethnicity
- Black 62% White 26% Hispanic / Latino 8% Two or more races 4% Asian 1%
- Hispanic origin (detail)
- Mexican 4%
- Common ancestry
- Italian 1% Serbian 1% Slovak 1%
- Foreign-born
- 9% · Canada
- Languages at home
- 88% English-only · Spanish 6% Arabic 2% French/Haitian/Cajun 1%
Political lean MEDSL · Guilford
- 2024 margin
- Strong D (+21.8) · D 60.2% · R 38.4% · Other 1.4%
- 2008→2024 swing
- +3.5pp toward D · 2008: 18.4pp · 2024: 21.8pp
- All cycles
- 2024: D+21.8 2020: D+23.1 2016: D+20.0 2012: D+16.5 2008: D+18.4
Not yet ingested
- Civics
- —
Market trends
- HPI YoY
- ▼ -97.87%
- Current HPI
- 240.5377
- Rent YoY
- ▲ 1.78%
- Metro
- Greensboro-High Point, NC
- State GDP YoY
- ▲ 3.28%
- F500 in state
- 26
Industry mix (Fortune 500 HQ in NC)
| Industry | F500 HQs | Revenue |
|---|---|---|
| Financial Services | 2 | $213B |
|
||
| Retail | 2 | $95B |
|
||
| Industrial Conglomerate | 1 | $38B |
|
||
| Metals / Steel | 1 | $35B |
|
||
| Utilities | 1 | $30B |
|
||
| Industrial Machinery | 1 | $19B |
|
||
Price history
1 event — show timeline
- 2026-04-03 Listed $189,900 Triad MLS
Property tax history
+2.8%/yrLatest (2025): $907 · -1.0% YoY. Source: county tax records.
Cash-flow waterfall
monthlySold comps — $/sqft
last 12 mo · ≤1 miLoading sold comps…