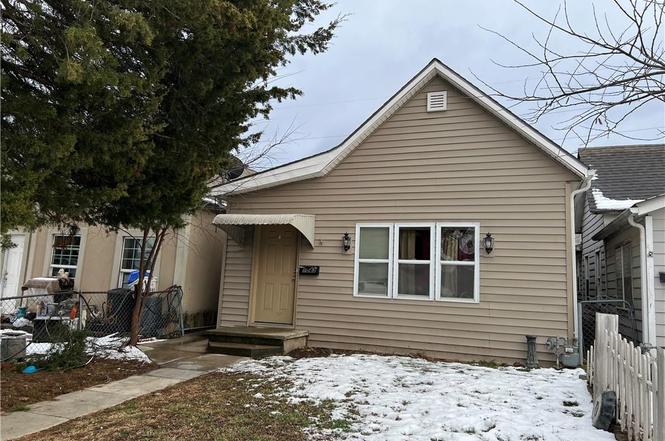
1043 Hasbrook Ave · Kansas City, KS
Flood risk 1/10 · Minimal
- FEMA flood zone
- X (unshaded)
- Chance of flooding over 30 yrs
- 0.0%
- Est. flood insurance / yr
- $473 – $860
Fire risk 1/10 · Minimal
- Est. fire insurance / yr
- $1,154 – $2,142
Heat risk 4/10 · Minor
- Hot days now (above 106°F)
- 7 days/yr
- Hot days in 30 yrs
- 17 days/yr
Wind risk 2/10 · Minimal
- Chance of severe wind over 30 yrs
- —
Air-quality risk 3/10 · Minor
- Unhealthy air days now
- 2 days/yr
- Unhealthy air days in 30 yrs
- 3 days/yr
Risk factors via First Street. Map © Google.
Why this score? — see what drove the D- grade
The composite is a weighted blend of 9 inputs, each scored 0–100. Each bar is that input's sub-score; the figure is the points it added to the 100-point composite (weight × sub-score).
- Appreciation +10.0/10.0
- Cash flow +7.5/30.0
- ARV discount +7.5/15.0
- Livability +3.6/5.0
- Rent growth +2.5/5.0
- Condition / age +2.5/5.0
- 1% rule +1.9/10.0
- DSCR +1.6/10.0
- Schools +0.9/10.0
$124,000
🖨 Deal sheet (PDF) 📄 Offer letter ✓ Due diligence
Listing remarks
Pacific Place neighborhood, tenant-occupied and generating reliable rental income. This charming home offers 840 sq. ft. of living space, providing excellent value in a stable Wyandotte County location. This home has shown consistent appreciation over the years and might be perfect to add to your rental portfolio! Have your agent reach out to the listing agent for showing opportunities and any additional details. All presented facts of this property deemed to be true but not guaranteed. Please verify all information before submitting your offer!
Key facts
- 2,614 sq ft lot
- Built 1925
- Listed 184 days
Property features AI
Finance
- Other: Above-grade living area reported as 840 (source: public records)
- Financial info: Tax information provided but excluded per instructions
- HOA & community: No maintenance provided
Exterior
- Parking: Other parking type
- Utilities: Public water; Public sewer
- Home design: Single-family residence; Residential property; One story (bungalow-style implied)
- Construction: Frame, stone & frame, and vinyl siding construction; Composition roof; Built approximately 76–100 years ago
- Exterior features: Lot approximately 2,614 square feet; Not in a flood plain
Interior
- Kitchen: Kitchen present
- Bedrooms: 3 bedrooms (includes Bedroom 1, Bedroom 2, Bedroom 3)
- Bathrooms: 1 full bathroom
- Heating & cooling: Natural gas heating; Window unit(s) for cooling
- Interior features: Bungalow floor plan; Crawl space basement
- Laundry & utility: Washer/Dryer info not provided
Neighborhood map
What this means for you Summary
Snapshot
- This is a 2-bed/1.0-bath single-family listed at $124k.
Deal economics
- At list price, monthly cash flow is $-154 ($-2k/yr) — negative.
- To cash-flow at today's rent, offer at most $97k (21.9% below list).
- To meet the 1% rule (rent ≥ 1% of price), the offer needs to be $86k (30.7% below list).
- Recommended offer: $86k (30.7% below list) — sets the bar for 1% rule.
Location & tenants
- Location reads 72/100 on livability (#103 in KS) — a middle-class / working-renter tenant base. Strengths: commute A+, cost of living A+, housing A+; Watch: crime F, employment D-.
- Kansas City (urban): math 8% / reading 15% proficiency, ranked #169 of 169 in KS (top 100%) — low school quality limits family demand, transient renter base, plan for 1-2y turnover; 81% free/reduced lunch — lower-income household profile, screen leases tightly.
- Zoned schools: John Fiske Elem (math 8% / reading 12%, grade F, #660 of 684 statewide, top 98%, 1,908 students, 64% FRL); Rosedale Middle (math 5% / reading 10%, grade F, #207 of 219 statewide, top 95%, 798 students, 56% FRL); J C Harmon High (math 0% / reading 4%, grade F, #326 of 327 statewide, top 100%, 1,330 students, 79% FRL).
- Market conditions: 7 active listings in the ZIP; 369 units permitted in Wyandotte County in 2024 (236 in 5+ unit buildings).
Forward outlook
- In year one you build about $13k of equity ($857 loan paydown + $12k appreciation (10.0% local appreciation)).
- Wyandotte County population projected at +17% by 2050 — long-run rental-demand tailwind backs the buy-and-hold thesis.
- By year 3, paydown + projected appreciation supports a ~$34k cash-out refi (75% LTV) — recoverable capital for the next deal without selling this one.
Negotiation context
- It's been on market 184 days — a 12% lower offer ($109k) is reasonable based on typical stale-listing flexibility.
Risks & watch-outs
- Watch-outs: built in 1925 — expect roof / HVAC / electrical / plumbing capex.
Questions for the listing agent
- What do current leases actually rent for vs. the listed asking? Can we see a recent rent roll and the last 12 months of T-12 income?
- It's been on market 184 days. Have you received any prior offers? Is the seller open to a 31% concession, seller financing, or rate buy-down credit?
- Built in 1925 — when were the roof, HVAC, electrical panel, plumbing, and water heater last replaced?
- Why hasn't it sold? Are there any deal-killer items the seller is aware of (foundation, flood, title, zoning, code violations)?
- Is there a deadline driving the sale (1031 exchange, divorce, estate, relocation)? That informs how much negotiation room exists.
- Schools are F-rated, which usually means shorter tenancies and higher turnover. Who's the typical renter profile here, and what's been the actual vacancy rate?
- Crime grade is F in this area — have there been break-ins, vandalism, or insurance claims at this property in the last 3 years? What carrier currently insures it and at what premium?
- The area grade is low — what's the realistic commute time and amenity access for the typical tenant pool here? Any planned neighborhood developments (good or bad) we should know about?
- What's the average days-on-market for RENTAL listings here right now (not sales)? A rising rental-DOM trend means longer vacancies and softer asking-rent achievability than the comps imply.
- What's the recent tenant-quality profile in this submarket — average credit score on applications, eviction rate, late-payment / NSF rate, and stable-employment percentage? A property-management company in the area should have these aggregated.
- How much new for-sale + rental construction is in the pipeline within 1–3 miles? Heavy new supply typically softens prices + rents 12–24 months out; constrained supply supports both.
Investment metrics
- 1% rule
- 0.69% ✗
- Cap rate
- 4.81%
- Cash-on-cash
- -5.31%
- DSCR
- 0.76
- GRM
- 12.0
CMA / ARV
No comps found within radius.
Projected returns pro-forma
10.0% appreciation · 3.0% rent growth · sell at horizon
- IRR
- 20.5%
- Equity multiple
- 2.66×
- Total profit
- $57,740
- Equity at exit
- $111,709
- IRR
- 18.7%
- Equity multiple
- 6.12×
- Total profit
- $177,732
- Equity at exit
- $240,905
Cash invested: $34,720 (down + closing). Projections, not guarantees.
Landlord ↔ Tenant lean methodology
- Overall (STATE)
- 83 Strongly Landlord-Friendly
- State Kansas
- 83 Strongly Landlord-Friendly · R+10
- County
- — inherits STATE
- City
- — inherits STATE
ZIP-level market 66105
- Home prices YoY
- 4.5%
- Active inventory
- 7
- Price-to-rent
- 12.0×
Monthly cashflow live
- Estimated rent
- $859 medium interval (Pro) →
- Mortgage (P&I)
- −$650
- Tax from tax record
- −$131 /mo · $1,568/yr
- Insurance
- −$52
- HOA
- −$0
- Vacancy / Maint / Mgmt
- −$180
- Net cashflow
- $-154
Break-even live
Sensitivity live
| Price | -10% $-84 | -5% $-119 | +0% $-154 | +5% $-189 | +10% $-224 |
|---|---|---|---|---|---|
| Rent | -10% $-222 | -5% $-188 | +0% $-154 | +5% $-120 | +10% $-86 |
| Rate | -1.0pp $-91 | -0.5pp $-122 | base $-154 | +0.5pp $-186 | +1.0pp $-219 |
UW: 25.0% down · 7.5% · 30yr · 1.5% tax · 5.0% vac · 8.0% maint · 8.0% mgmt
Financing live
Cash to close
- Down payment
- $31,000
- Closing costs
- $3,720
- Reserves months
- —
- Total cash needed
- —
Loan-product check · same deal, 3 products live
Conventional
25% down · 7.5% · 30yr
- Down + closing
- —
- Monthly P&I
- —
- Monthly cashflow
- —
- DSCR
- —
- Eligible?
- —
Personal DTI + credit; lowest rate.
DSCR
20% down · 8.5% · 30yr
- Down + closing
- —
- Monthly P&I
- —
- Monthly cashflow
- —
- DSCR
- —
- Eligible?
- —
No personal income docs; deal must DSCR.
Hard money
10% down · 12.0% · 12mo
- Down + closing
- —
- Monthly P&I
- —
- Monthly cashflow
- —
- DSCR
- —
- Eligible?
- —
Short-term bridge; refi at stabilization.
Listing history 17 events
-
2026-06-21days on market $124,000 Active 184 DOM
-
2026-06-18days on market $124,000 Active 181 DOM
-
2026-06-17days on market $124,000 Active 180 DOM
-
2026-06-16days on market $124,000 Active 179 DOM
-
2026-06-15days on market $124,000 Active 178 DOM
-
2026-06-13days on market $124,000 Active 176 DOM
-
2026-06-13days on market $124,000 Active 175 DOM
-
2026-06-09days on market $124,000 Active 172 DOM
-
2026-06-08days on market $124,000 Active 171 DOM
-
2026-06-07days on market $124,000 Active 170 DOM
-
2026-06-05days on market $124,000 Active 167 DOM
-
2026-06-03days on market $124,000 Active 166 DOM
-
2026-06-02days on market $124,000 Active 165 DOM
-
2026-06-01days on market $124,000 Active 164 DOM
-
2026-05-31days on market $124,000 Active 163 DOM
-
2025-12-19$124,000 Active
-
2023-08-10soldstatus
ⓘ Source: listings_history table (triggers on properties + properties_extension) + one-shot
backfill from property_details.listing_events for pre-trigger history.
Tax reassessment forecast KS · Resets to sale price
- Current annual tax
- $1,568 · $131/mo
- Projected year-2 tax
- $1,748 · $146/mo
- Expected delta
- +$180/yr (+$15/mo · 11.5%)
ⓘ Screening estimate from a state-policy table — verify with the county assessor before closing.
Climate risk First Street
- Flood 1/10 Low FEMA zone X (unshaded) · 0% chance over 30 yrs
- Wildfire 1/10 Low
- Heat 4/10 Moderate 7 d/yr ≥106°F today · 17 d/yr by 30 yrs out
- Wind 2/10 Low
- Air quality 3/10 Moderate 2 unhealthy d/yr today · 3 by 30 yrs out
Nearby sold comps map
Loading sold comps map…
Walkable amenities ~0.75 mi
Loading nearby amenities…
Taxation est. · year 1
- Rental income
- $10,312
- − Mortgage interest
- −$6,946
- − Property taxes
- −$1,568
- − Insurance
- −$620
- − Repairs & maintenance
- −$825
- − Management
- −$825
- − Depreciation
- −$3,607
- Taxable loss
- −$4,079
- Est. tax savings @ 24.0%
- +$979
- After-tax cash flow
- $-866/yr
For passive investors: Depreciation is non-cash, so a rental often shows a tax loss while cash-flowing — sheltering income. Rental losses are passive: they offset passive income freely, and up to $25,000/yr can offset ordinary (W-2) income if you actively participate and your MAGI is under $100k (phasing out to $0 by $150k); unused losses carry forward. On sale, claimed depreciation is recaptured at up to 25%, and gains may owe capital-gains tax (a 1031 exchange can defer both). Figures are a year-1 estimate at your 24.0% rate — not tax advice; consult a CPA.
Schools (NCES district)
- District
- Kansas City
- NCES district ID
- 2007950
- Math proficiency
- 8% ▼ -10.00%
- Reading proficiency
- 15% ▼ -4.00%
- Median HH income
- $34,774
- Composite
- 9.38/100
- National rank
- #9856
- State rank
- #169 of 169 in KS
Livability — Kansas City
- Score
- 72/100
- State rank
- #103
- US rank
- #6054
Category grades
Schools grade is shown separately in the Schools card above.
Census & demographics
- Census place
- Kansas City, KS
- City population
- 130,206
- Population (ZIP)
- 2,388
Population outlook (Wyandotte County) Hauer SSP2
- Today (2025)
- 177,063 people
- By 2030
- 183,212 · +3.5%
- By 2040
- 195,697 · +10.5%
- By 2050
- 207,897 · +17.4%
- By 2075
- 236,169 · +33.4%
- By 2100
- 255,790 · +44.5%
Race, ethnicity, and origin ACS 2023
- Neighborhood character
- Predominantly Hispanic (75%)
- Race & ethnicity
- Hispanic / Latino 75% White 24% Two or more races 16%
- Hispanic origin (detail)
- Mexican 60%
- Common ancestry
- Slovak 1%
- Foreign-born
- 44% · Canada
- Languages at home
- 34% English-only · Spanish 66%
Political lean MEDSL · Wyandotte
- 2024 margin
- Strong D (+23.9) · D 61.1% · R 37.3% · Other 1.6%
- 2008→2024 swing
- -17.0pp toward R · 2008: 40.9pp · 2024: 23.9pp
- All cycles
- 2024: D+23.9 2020: D+30.9 2016: D+29.1 2012: D+36.4 2008: D+40.9
Not yet ingested
- Civics
- —
Market trends
- HPI YoY
- ▲ 15.77%
- Current HPI
- 363.1691
- Rent YoY
- —
- Metro
- —
- State GDP YoY
- —
- F500 in state
- 0
Price history
2 events — show timeline
- 2025-12-19 Listed $124,000 Heartland MLS as Distributed by MLS Grid
- 2023-08-10 Sold (Public Records) — Public Records
Property tax history
+15.5%/yrLatest (2025): $1,568 · -10.1% YoY. Source: county tax records.
Cash-flow waterfall
monthlySold comps — $/sqft
last 12 mo · ≤1 miLoading sold comps…