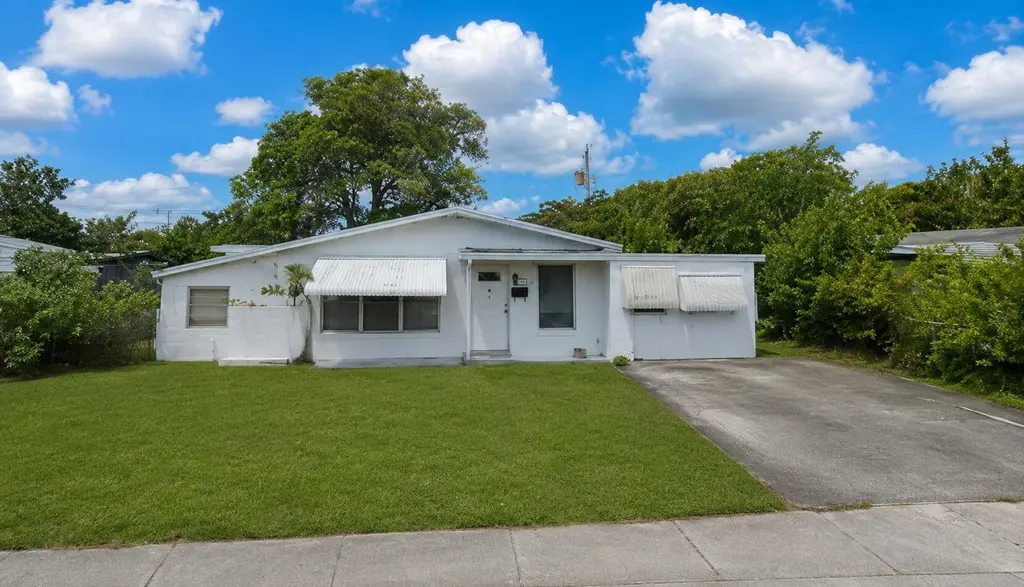
1781 NW 6th Ter · Pompano Beach, FL
Flood risk 1/10 · Minimal
- FEMA flood zone
- X (shaded)
- Chance of flooding over 30 yrs
- 0.0%
- Est. flood insurance / yr
- $507 – $1,088
Fire risk 1/10 · Minimal
- Est. fire insurance / yr
- $947 – $1,759
Heat risk 10/10 · Severe
- Hot days now (above 106°F)
- 7 days/yr
- Hot days in 30 yrs
- 27 days/yr
Wind risk 10/10 · Severe
- Chance of severe wind over 30 yrs
- 99.0%
Air-quality risk 2/10 · Minimal
- Unhealthy air days now
- 1 days/yr
- Unhealthy air days in 30 yrs
- 3 days/yr
Risk factors via First Street. Map © Google.
Why this score? — see what drove the D- grade
The composite is a weighted blend of 9 inputs, each scored 0–100. Each bar is that input's sub-score; the figure is the points it added to the 100-point composite (weight × sub-score).
- Cash flow +15.6/30.0
- DSCR +4.8/10.0
- Schools +4.1/10.0
- 1% rule +3.8/10.0
- Livability +3.7/5.0
- Rent growth +3.0/5.0
- ARV discount +2.5/15.0
- Condition / age +2.5/5.0
- Appreciation +0.0/10.0
$345,000
🖨 Deal sheet 📄 Offer letter ✓ Due diligence
Key facts
- 6,017 sq ft lot
- 4 parking spots
- Built 1961
Property features AI
Finance
- Financial info: No land lease; Pets allowed with no restrictions
Exterior
- Parking: Driveway parking with 4 open spaces (total 4 parking spaces)
- Utilities: Public water; Public sewer; Electricity available; Cable available
- Home design: Single-family home, one story; Faces east; Resale condition
- Construction: CBS construction; Shingle roof
- Exterior features: Sidewalks; City street frontage; Not waterfront
Interior
- Bedrooms: Four bedrooms on the main level
- Flooring: Tile flooring
- Bathrooms: Two full bathrooms on the main level
- Interior features: Split bedroom layout
- Laundry & utility: Laundry area (other)
Neighborhood map
What this means for you Summary
Snapshot
- This is a 3-bed/2.0-bath single-family listed at $345k.
Deal economics
- At list price, monthly cash flow is $144 ($2k/yr) — positive.
- The deal already cash-flows at list — no discount required.
- To meet the 1% rule (rent ≥ 1% of price), the offer needs to be $305k (11.7% below list).
- Recommended offer: $305k (11.7% below list) — sets the bar for 1% rule.
- Cap rate 6.8% vs local median 3.1% in Pompano Beach — top-decile yield for the area; either an underpriced asset or a hidden risk that comps aren't pricing in. Stress-test before assuming the spread holds.
Location & tenants
- Location reads 74/100 on livability (#284 in FL, #4,541 nationally) — a middle-class / working-renter tenant base. Strengths: commute A+, housing A+, cost of living B+; Watch: employment D+, amenities F.
- Broward (suburban): math 42% / reading 53% proficiency, ranked #46 of 73 in FL (top 63%) — families likely to look elsewhere, expect single-tenant / working-renter base with shorter leases.
- Zoned schools: Palmview Elementary School (math 24% / reading 41%, grade F, #1,787 of 2,144 statewide, top 84%, 532 students, 82% FRL); Crystal Lake Middle School (math 24% / reading 38%, grade F, #462 of 571 statewide, top 81%, 1,055 students, 74% FRL); Blanche Ely High School (math 7% / reading 29%, grade F, #570 of 667 statewide, top 86%, 1,906 students, 75% FRL) — zoned schools average 77% FRL vs 51% district-wide (26 pts higher); higher-poverty schools than district average — tighter screening recommended.
- Zoned-school proficiency averages 27% at this address vs 48% district-wide (-20 pts) — the specific schools serving this property underperform the Broward average; the district grade overstates school quality for this exact location.
- Market conditions: Rents rising (+2.1%/yr); 338 active listings in the ZIP; 40 comparable units currently listed for rent nearby; rentals at typical pace (median 25d on market — plan ~3-4 weeks tenant-placement turnaround); 2,111 units permitted in Broward County in 2024 (1,265 in 5+ unit buildings).
- At $3,046/mo this rent would consume 56% of the median local household income ($65k/yr) (locally 2870% of renters already pay >50% of income on rent) — very limited rent-growth headroom before tenants either downsize or default.
Forward outlook
- Local home prices are declining (-3.0%/yr); year-one equity from $2k of loan paydown is wiped out by about $10k of value loss. Plan a longer hold.
- Broward County population projected at +34% by 2050 — long-run rental-demand tailwind backs the buy-and-hold thesis.
Negotiation context
- It's been on market 20 days — a 2% lower offer ($340k) is reasonable based on typical stale-listing flexibility.
Risks & watch-outs
- Climate carrying-cost: severe wind risk, 99% chance of damaging wind over 30y; extreme-heat days projected 7→27/yr by 2055 (HVAC capex compounding) — expect insurance premiums to compound above CPI over the hold.
Questions for the listing agent
- Built in 1961 — when were the roof, HVAC, electrical panel, plumbing, and water heater last replaced?
- Is there a deadline driving the sale (1031 exchange, divorce, estate, relocation)? That informs how much negotiation room exists.
- Schools are D-rated, which usually means shorter tenancies and higher turnover. Who's the typical renter profile here, and what's been the actual vacancy rate?
- The area grade is low — what's the realistic commute time and amenity access for the typical tenant pool here? Any planned neighborhood developments (good or bad) we should know about?
- What's the average days-on-market for RENTAL listings here right now (not sales)? A rising rental-DOM trend means longer vacancies and softer asking-rent achievability than the comps imply.
- What's the recent tenant-quality profile in this submarket — average credit score on applications, eviction rate, late-payment / NSF rate, and stable-employment percentage? A property-management company in the area should have these aggregated.
- How much new for-sale + rental construction is in the pipeline within 1–3 miles? Heavy new supply typically softens prices + rents 12–24 months out; constrained supply supports both.
Investment metrics
- 1% rule
- 0.88% ✗
- Cap rate
- 6.79%
- Cash-on-cash
- 1.79%
- DSCR
- 1.08
- GRM
- 9.4
CMA / ARV
- ARV (on-the-fly)
- $310,300
- Comps found
- 3
Show comp detail 3 sales within ~0.75 mi
| Address | Dist | Beds/Ba | Sqft | Sold | Price | $/sf | Match |
|---|---|---|---|---|---|---|---|
| 721 NW 16th St | 0.27mi | 4/2.0 (+1) | 1,357 (-6%) | 13mo | $455,000 | $335 | 61 |
| 320 NW 24th Ct | 0.62mi | 2/1.0 (-1) | 1,395 (-4%) | 6mo | $295,000 | $211 | 51 |
| 1460 NW 3rd Ter | 0.61mi | 4/2.5 (+1) | 1,634 (+13%) | 4mo | $350,000 | $214 | 40 |
Match score weights: distance 35% · size 25% · config 20% · recency 20%. Top-matched comps best support the ARV.
Projected returns pro-forma
-3.0% appreciation · 2.12% rent growth · sell at horizon
- IRR
- -14.4%
- Equity multiple
- 0.49×
- Total profit
- $-49,453
- Equity at exit
- $51,441
- IRR
- -7.1%
- Equity multiple
- 0.56×
- Total profit
- $-42,170
- Equity at exit
- $29,829
Cash invested: $96,600 (down + closing). Projections, not guarantees.
Landlord ↔ Tenant lean methodology
- Overall (STATE)
- 87 Strongly Landlord-Friendly
- State Florida
- 87 Strongly Landlord-Friendly · R+3
- County
- — inherits STATE
- City
- — inherits STATE
ZIP-level market 33060
- Home prices YoY
- -23.6%
- Rents YoY
- 2.1%
- Active inventory
- 338
- Price-to-rent
- 9.4×
Monthly cashflow live
- Estimated rent
- $3,046 high interval (Pro) →
- Mortgage (P&I)
- −$1,809
- Tax from tax record
- −$310 /mo · $3,716/yr
- Insurance
- −$144
- HOA
- −$0
- Vacancy / Maint / Mgmt
- −$640
- Net cashflow
- $144
Break-even live
UW: 25.0% down · 7.5% · 30yr · 1.5% tax · 5.0% vac · 8.0% maint · 8.0% mgmt
Financing live
Cash to close
- Down payment
- $86,250
- Closing costs
- $10,350
- Reserves months
- —
- Total cash needed
- —
Loan-product check · same deal, 3 products live
Conventional
25% down · 7.5% · 30yr
- Down + closing
- —
- Monthly P&I
- —
- Monthly cashflow
- —
- DSCR
- —
- Eligible?
- —
Personal DTI + credit; lowest rate.
DSCR
20% down · 8.5% · 30yr
- Down + closing
- —
- Monthly P&I
- —
- Monthly cashflow
- —
- DSCR
- —
- Eligible?
- —
No personal income docs; deal must DSCR.
Hard money
10% down · 12.0% · 12mo
- Down + closing
- —
- Monthly P&I
- —
- Monthly cashflow
- —
- DSCR
- —
- Eligible?
- —
Short-term bridge; refi at stabilization.
Rent comps 40 comps
| Address | Beds | Baths | Sqft | Rent | $/sqft | DOM | Units | Dist |
|---|---|---|---|---|---|---|---|---|
| 1881 NW 5th Ter Pompano Beach, FL | 3.0 | 2.0 | 1152 | $3,400 | $2.95 | 7d | 1 | 0.11mi |
| 1881 NW 5th Ter Unit 1881 Pompano Beach, FL | 3.0 | 2.0 | 1152 | $3,400 | $2.95 | 24d | 1 | 0.11mi |
| 774 NW 16th Pl Pompano Beach, FL | 3.0 | 2.0 | 1446 | $3,000 | $2.07 | 24d | 1 | 0.17mi |
| 171 NW 19th St Pompano Beach, FL | 3.0 | 2.0 | 1215 | $3,250 | $2.67 | 24d | 1 | 0.50mi |
| 10 NW 19th St Pompano Beach, FL | 4.0 | 2.0 | 1215 | $2,990 | $2.46 | 24d | 1 | 0.61mi |
| 1731 NE 1st Ave Pompano Beach, FL | 4.0 | 2.0 | 1848 | $3,500 | $1.89 | 24d | 1 | 0.66mi |
| 310 Leisure Blvd Pompano Beach, FL | 2.0 | 2.0 | 1331 | $2,250 | $1.69 | 24d | 1 | 0.66mi |
| 1670 NE 1st Ave Pompano Beach, FL | 3.0 | 2.0 | 1200 | $3,300 | $2.75 | 24d | 1 | 0.70mi |
| 220 Leisure Blvd Pompano Beach, FL | 2.0 | 1.0 | 1046 | $2,200 | $2.10 | 24d | 1 | 0.70mi |
| 1921 NE 2nd Ave Pompano Beach, FL | 3.0 | 2.0 | 1261 | $2,960 | $2.35 | 22d | 1 | 0.73mi |
| 38 Leisure Blvd Pompano Beach, FL | 2.0 | 2.0 | 1248 | $2,400 | $1.92 | 14d | 1 | 0.78mi |
| 38 Leisure Blvd Pompano Beach, FL | 2.0 | 2.0 | 1248 | $2,400 | $1.92 | 15d | 1 | 0.78mi |
| 2001 NE 2nd Ter Pompano Beach, FL | 3.0 | 2.0 | 999 | $3,000 | $3.00 | 24d | 1 | 0.78mi |
| 981 NW 4th Ave Pompano Beach, FL | 4.0 | 2.0 | 1530 | $3,997 | $2.61 | 24d | 1 | 0.87mi |
| 981 NW 4th Ave Pompano Beach, FL | 4.0 | 2.0 | 1520 | $3,234 | $2.13 | 24d | 1 | 0.87mi |
| 920 NW 8th Ave Unit 3 Pompano Beach, FL | 2.0 | 1.5 | 1150 | $1,900 | $1.65 | 11d | 1 | 0.90mi |
| 861 NW 6th Ave Pompano Beach, FL | 4.0 | 2.0 | 1528 | $3,652 | $2.39 | 24d | 1 | 0.94mi |
| 880 NW 3rd Way Unit 880 Pompano Beach, FL | 3.0 | 2.5 | 1597 | $3,600 | $2.25 | 7d | 1 | 0.95mi |
| 880 NW 3rd Way Unit 880 Pompano Beach, FL | 3.0 | 2.5 | 1597 | $3,600 | $2.25 | 24d | 1 | 0.95mi |
| 841 NW 5th Ave Unit 1 Pompano Beach, FL | 2.0 | 1.0 | 1000 | $1,500 | $1.50 | 24d | 1 | 0.97mi |
| 100 NW 27th St Unit 100 Pompano Beach, FL | 2.0 | 2.0 | 1394 | $2,749 | $1.97 | 24d | 1 | 0.97mi |
| 100 NW 27th St Pompano Beach, FL | 2.0 | 2.0 | 1394 | $2,500 | $1.79 | 24d | 1 | 0.97mi |
| 844 NW 3rd Way Unit 844 Pompano Beach, FL | 3.0 | 2.5 | 1621 | $3,500 | $2.16 | 10d | 1 | 0.99mi |
| 844 NW 3rd Way Unit 844 Pompano Beach, FL | 3.0 | 2.5 | 1621 | $3,500 | $2.16 | 24d | 1 | 0.99mi |
| 816 NW 3rd Ter Unit 818 Pompano Beach, FL | 3.0 | 2.5 | 1597 | $3,350 | $2.10 | 24d | 1 | 1.03mi |
| 816 NW 3rd Ter Unit 818 Pompano Beach, FL | 3.0 | 2.5 | 1597 | $3,350 | $2.10 | 5d | 1 | 1.03mi |
| 3000 NW 5th Ter #129 Pompano Beach, FL | 2.0 | 2.0 | 912 | $2,000 | $2.19 | 24d | 1 | 1.03mi |
| 360 NW 8th St Unit 8 Pompano Beach, FL | 2.0 | 1.0 | 875 | $1,900 | $2.17 | 24d | 1 | 1.04mi |
| 3005 NW 5th Ter #2 Pompano Beach, FL | 2.0 | 1.0 | 968 | $2,100 | $2.17 | 24d | 1 | 1.08mi |
| 612 NW 6th Ave Pompano Beach, FL | 4.0 | 2.0 | 1750 | $3,700 | $2.11 | 5d | 1 | 1.09mi |
| 610 NW 7th Ave Pompano Beach, FL | 1.0–2.0 | 1.0 | 725 | $1,800 | $2.48 | 24d | 3 | 1.09mi |
| 704 NW 3rd Ave Pompano Beach, FL | 3.0 | 1.0 | 1156 | $2,600 | $2.25 | 24d | 1 | 1.10mi |
| 229 NE 26th Ct Pompano Beach, FL | 3.0 | 2.0 | 1145 | $3,000 | $2.62 | 22d | 1 | 1.12mi |
| 100 NW 8th St Pompano Beach, FL | 2.0 | 2.0 | 1024 | $2,175 | $2.12 | 24d | 1 | 1.16mi |
| 110 NE 30th St Pompano Beach, FL | 3.0 | 2.0 | 1418 | $4,400 | $3.10 | 24d | 1 | 1.19mi |
| 3050 NW 1st Ave Pompano Beach, FL | 2.0 | 1.0 | 1044 | $1,800 | $1.72 | 24d | 1 | 1.24mi |
| 812 NE 4th Ave Pompano Beach, FL | 2.0 | 2.0 | 1056 | $3,000 | $2.84 | 15d | 1 | 1.27mi |
| 939 NW 3rd St Unit 939 Pompano Beach, FL | 3.0 | 2.5 | 1597 | $3,300 | $2.07 | 24d | 1 | 1.27mi |
| 3329 NW 11th Ave Unit 3329 Pompano Beach, FL | 3.0 | 2.5 | 1420 | $2,800 | $1.97 | 24d | 1 | 1.33mi |
| 3345 NW 11th Ave Unit 3345 Pompano Beach, FL | 3.0 | 2.5 | 1538 | $2,850 | $1.85 | 24d | 1 | 1.36mi |
Listing history 14 events
-
2026-06-18days on market $345,000 Active 20 DOM
-
2026-06-17days on market $345,000 Active 19 DOM
-
2026-06-16days on market $345,000 Active 18 DOM
-
2026-06-15days on market $345,000 Active 17 DOM
-
2026-06-13days on market $345,000 Active 15 DOM
-
2026-06-09days on market $345,000 Active 11 DOM
-
2026-06-08days on market $345,000 Active 10 DOM
-
2026-06-07days on market $345,000 Active 9 DOM
-
2026-06-04days on market $345,000 Active 6 DOM
-
2026-06-03days on market $345,000 Active 5 DOM
-
2026-06-02days on market $345,000 Active 4 DOM
-
2026-06-01days on market $345,000 Active 3 DOM
-
2026-05-31days on market $345,000 Active 2 DOM
-
2026-05-26$345,000 Active
ⓘ Source: listings_history table (triggers on properties + properties_extension) + one-shot
backfill from property_details.listing_events for pre-trigger history.
Tax reassessment forecast FL · Resets to sale price
- Current annual tax
- $3,716 · $310/mo
- Projected year-2 tax
- $3,716 · $310/mo
- Expected delta
- $0/yr ($0/mo · 0.0%)
ⓘ Screening estimate from a state-policy table — verify with the county assessor before closing.
Climate risk First Street
- Flood 1/10 Low FEMA zone X (shaded) · 0% chance over 30 yrs
- Wildfire 1/10 Low
- Heat 10/10 Extreme 7 d/yr ≥106°F today · 27 d/yr by 30 yrs out
- Wind 10/10 Extreme 99% chance of damaging wind over 30 yrs
- Air quality 2/10 Low 1 unhealthy d/yr today · 3 by 30 yrs out
Nearby sold comps map
Loading sold comps map…
Walkable amenities ~0.75 mi
Loading nearby amenities…
Taxation est. · year 1
- Rental income
- $36,553
- − Mortgage interest
- −$19,325
- − Property taxes
- −$3,716
- − Insurance
- −$1,725
- − Repairs & maintenance
- −$2,924
- − Management
- −$2,924
- − Depreciation
- −$10,036
- Taxable loss
- −$4,099
- Est. tax savings @ 24.0%
- +$984
- After-tax cash flow
- $2,709/yr
For passive investors: Depreciation is non-cash, so a rental often shows a tax loss while cash-flowing — sheltering income. Rental losses are passive: they offset passive income freely, and up to $25,000/yr can offset ordinary (W-2) income if you actively participate and your MAGI is under $100k (phasing out to $0 by $150k); unused losses carry forward. On sale, claimed depreciation is recaptured at up to 25%, and gains may owe capital-gains tax (a 1031 exchange can defer both). Figures are a year-1 estimate at your 24.0% rate — not tax advice; consult a CPA.
Schools (NCES district)
- District
- Broward
- NCES district ID
- 1200180
- Math proficiency
- 42% ▼ -18.00%
- Reading proficiency
- 53% ▼ -5.00%
- Median HH income
- $52,139
- Composite
- 40.88/100
- National rank
- #3621
- State rank
- #46 of 73 in FL
Livability — Pompano Beach
- Score
- 74/100
- State rank
- #284
- US rank
- #4541
Category grades
Schools grade is shown separately in the Schools card above.
Census & demographics
- Census place
- Pompano Beach, FL
- County
- Broward County · 1,963,430 people
- City population
- 155,861
- Metro
- Miami-Fort Lauderdale-Pompano Beach, FL
- Population (ZIP)
- 37,233
- Household income
- $64,819
- Rent vs Own
- Severe rent burden
- 2870.0
Population outlook (Broward County) Hauer SSP2
- Today (2025)
- 2,207,033 people
- By 2030
- 2,360,704 · +7.0%
- By 2040
- 2,661,208 · +20.6%
- By 2050
- 2,946,698 · +33.5%
- By 2075
- 3,602,273 · +63.2%
- By 2100
- 3,970,984 · +79.9%
Race, ethnicity, and origin ACS 2023
- Neighborhood character
- Diverse neighborhood (Simpson 0.69)
- Race & ethnicity
- Black 38% White 33% Hispanic / Latino 26% Two or more races 14%
- Hispanic origin (detail)
- Mexican 9% Puerto Rican 2% Cuban 3% Dominican 1%
- Common ancestry
- Hispanic 13% Romanian 2% Slovak 1%
- Foreign-born
- 31% · Canada, Jamaica
- Languages at home
- 60% English-only · Spanish 23% French/Haitian/Cajun 13% Other Indo-European 2%
Political lean MEDSL · Broward
- 2024 margin
- D (+17.0) · D 58.0% · R 41.0%
- 2008→2024 swing
- -17.8pp toward R · 2008: 34.7pp · 2024: 17.0pp
- All cycles
- 2024: D+17.0 2020: D+29.8 2016: D+35.0 2012: D+34.9 2008: D+34.7
Not yet ingested
- Civics
- —
Market trends
- HPI YoY
- ▼ -131.09%
- Current HPI
- 425.3083
- Rent YoY
- ▲ 2.12%
- Metro
- Miami-Fort Lauderdale-Pompano Beach, FL
- State GDP YoY
- ▲ 3.28%
- F500 in state
- 36
Industry mix (Fortune 500 HQ in FL)
| Industry | F500 HQs | Revenue |
|---|---|---|
| Industrial Technology | 2 | $29B |
|
||
| Insurance | 2 | $17B |
|
||
| Retail | 1 | $60B |
|
||
| Technology Distribution | 1 | $58B |
|
||
| Homebuilding | 1 | $35B |
|
||
| Technology Manufacturing | 1 | $35B |
|
||
Price history
1 event — show timeline
- 2026-05-26 Listed $345,000 Beaches MLS
Property tax history
+19.3%/yrLatest (2025): $3,716 · +170.4% YoY. Source: county tax records.
Cash-flow waterfall
monthlySold comps — $/sqft
last 12 mo · ≤1 miLoading sold comps…