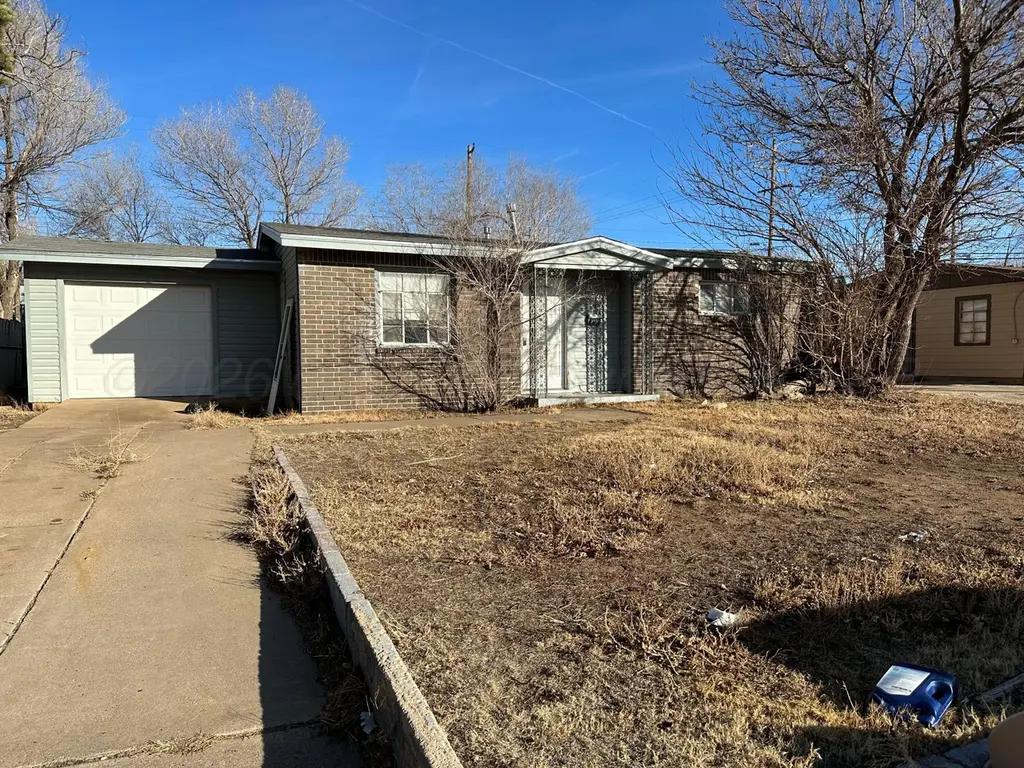
2402 Hickory St · Amarillo, TX
Flood risk 1/10 · Minimal
- FEMA flood zone
- X (unshaded)
- Chance of flooding over 30 yrs
- 0.0%
- Est. flood insurance / yr
- $507 – $1,088
Fire risk 5/10 · Moderate
- Est. fire insurance / yr
- $1,222 – $2,270
Heat risk 4/10 · Minor
- Hot days now (above 97°F)
- 7 days/yr
- Hot days in 30 yrs
- 19 days/yr
Wind risk 2/10 · Minimal
- Chance of severe wind over 30 yrs
- —
Air-quality risk 2/10 · Minimal
- Unhealthy air days now
- 1 days/yr
- Unhealthy air days in 30 yrs
- 1 days/yr
Risk factors via First Street. Map © Google.
Why this score? — see what drove the C+ grade
The composite is a weighted blend of 9 inputs, each scored 0–100. Each bar is that input's sub-score; the figure is the points it added to the 100-point composite (weight × sub-score).
- Cash flow +25.6/30.0
- DSCR +8.5/10.0
- ARV discount +7.5/15.0
- 1% rule +7.0/10.0
- Schools +3.6/10.0
- Livability +3.3/5.0
- Rent growth +2.5/5.0
- Condition / age +2.5/5.0
- Appreciation +0.0/10.0
$87,000
🖨 Deal sheet 📄 Offer letter ✓ Due diligence
Listing remarks
INVESTMENT ALERT!!! PART OF A PACKAGE DEAL 14 PROPERTIES INCLUDED AT SALE PRICE $1,327,000.00 . This property is tenant occupied. We will have rent rolls available for the interested purchaser.
Key facts
- Garage
- Built 1953
- Listed 26 days
Property features AI
Finance
- Other: Located in NE Amarillo city limits (zoning 0300)
Exterior
- Parking: Attached garage (1 car) with garage facing front
- Utilities: Public water; Public sewer
- Home design: Single-family residence; One story
- Construction: Brick and frame construction with brick veneer; Pillar/post/pier foundation
- Exterior features: Wood fencing; Composition roof; Faces west
Interior
- Kitchen: Range (stove)
- Bathrooms: 1 full bathroom
- Heating & cooling: Natural gas heating; Cooling with ceiling fan(s)
- Interior features: Ceiling fan(s); Range (stove)
Neighborhood map
What this means for you Summary
Snapshot
- This is a 2-bed/1.0-bath single-family listed at $87k.
Deal economics
- At list price, monthly cash flow is $207 ($2k/yr) — positive.
- The deal already cash-flows at list — no discount required.
- Meets the 1% rule at list price ($1k rent vs $87k).
- Recommended offer: $86k (1.5% below list) — sets the bar for market timing.
Location & tenants
- Location reads 66/100 on livability (#624 in TX) — a middle-class / working-renter tenant base. Strengths: cost of living A+, housing A+; Watch: amenities C-, schools D, crime F.
- Amarillo ISD (urban): math 44% / reading 41% proficiency, ranked #336 of 826 in TX (top 41%) — families likely to look elsewhere, expect single-tenant / working-renter base with shorter leases.
- Market conditions: 120 active listings in the ZIP; 10 comparable units currently listed for rent nearby; rentals at typical pace (median 21d on market — plan ~3-4 weeks tenant-placement turnaround); 40% of comp listings sitting > 30 days — soft ceiling on asking rent; lower-income renter base — watch delinquency; 1,214 units permitted in Potter County in 2024 (650 in 5+ unit buildings).
- This rent runs 31% of the median local income ($41k/yr) — at the standard rent-burdened threshold; future hikes will face affordability resistance.
Forward outlook
- Local home prices are declining (-3.0%/yr); year-one equity from $601 of loan paydown is wiped out by about $3k of value loss. Plan a longer hold.
Negotiation context
- It's been on market 26 days — a 2% lower offer ($86k) is reasonable based on typical stale-listing flexibility.
- 3 sale attempts since 2y ago with the ask held roughly flat each time — persistent listings suggest the price (not the market) is what's stuck; bring a comps-based counter.
Risks & watch-outs
- Watch-outs: built in 1953 — expect roof / HVAC / electrical / plumbing capex.
- Climate carrying-cost: moderate wildfire risk — expect insurance premiums to compound above CPI over the hold.
Questions for the listing agent
- Built in 1953 — when were the roof, HVAC, electrical panel, plumbing, and water heater last replaced?
- Is there a deadline driving the sale (1031 exchange, divorce, estate, relocation)? That informs how much negotiation room exists.
- Schools are D-rated, which usually means shorter tenancies and higher turnover. Who's the typical renter profile here, and what's been the actual vacancy rate?
- Crime grade is F in this area — have there been break-ins, vandalism, or insurance claims at this property in the last 3 years? What carrier currently insures it and at what premium?
- What's the average days-on-market for RENTAL listings here right now (not sales)? A rising rental-DOM trend means longer vacancies and softer asking-rent achievability than the comps imply.
- What's the recent tenant-quality profile in this submarket — average credit score on applications, eviction rate, late-payment / NSF rate, and stable-employment percentage? A property-management company in the area should have these aggregated.
- How much new for-sale + rental construction is in the pipeline within 1–3 miles? Heavy new supply typically softens prices + rents 12–24 months out; constrained supply supports both.
Investment metrics
- 1% rule
- 1.20% ✓
- Cap rate
- 9.15%
- Cash-on-cash
- 10.19%
- DSCR
- 1.45
- GRM
- 6.9
CMA / ARV
No comps found within radius.
Projected returns pro-forma
-3.0% appreciation · 3.0% rent growth · sell at horizon
- IRR
- -1.0%
- Equity multiple
- 0.96×
- Total profit
- $-898
- Equity at exit
- $12,972
- IRR
- 8.7%
- Equity multiple
- 1.67×
- Total profit
- $16,286
- Equity at exit
- $7,522
Cash invested: $24,360 (down + closing). Projections, not guarantees.
Landlord ↔ Tenant lean methodology
- Overall (STATE)
- 87 Strongly Landlord-Friendly
- State Texas
- 87 Strongly Landlord-Friendly · R+5
- County
- — inherits STATE
- City
- — inherits STATE
ZIP-level market 79107
- Home prices YoY
- -20.9%
- Active inventory
- 120
- Price-to-rent
- 6.9×
Monthly cashflow live
- Estimated rent
- $1,044 high interval (Pro) →
- Mortgage (P&I)
- −$456
- Tax from tax record
- −$125 /mo · $1,503/yr
- Insurance
- −$36
- HOA
- −$0
- Vacancy / Maint / Mgmt
- −$219
- Net cashflow
- $207
Break-even live
UW: 25.0% down · 7.5% · 30yr · 1.5% tax · 5.0% vac · 8.0% maint · 8.0% mgmt
Financing live
Cash to close
- Down payment
- $21,750
- Closing costs
- $2,610
- Reserves months
- —
- Total cash needed
- —
Loan-product check · same deal, 3 products live
Conventional
25% down · 7.5% · 30yr
- Down + closing
- —
- Monthly P&I
- —
- Monthly cashflow
- —
- DSCR
- —
- Eligible?
- —
Personal DTI + credit; lowest rate.
DSCR
20% down · 8.5% · 30yr
- Down + closing
- —
- Monthly P&I
- —
- Monthly cashflow
- —
- DSCR
- —
- Eligible?
- —
No personal income docs; deal must DSCR.
Hard money
10% down · 12.0% · 12mo
- Down + closing
- —
- Monthly P&I
- —
- Monthly cashflow
- —
- DSCR
- —
- Eligible?
- —
Short-term bridge; refi at stabilization.
Rent comps 10 comps
| Address | Beds | Baths | Sqft | Rent | $/sqft | DOM | Units | Dist |
|---|---|---|---|---|---|---|---|---|
| 2800 Redwood St Amarillo, TX | 3.0 | 1.0 | 926 | $1,350 | $1.46 | 43d | 1 | 0.35mi |
| 2904 N Mirror St Amarillo, TX | 2.0 | 1.0 | 608 | $1,050 | $1.73 | 21d | 1 | 0.65mi |
| 509 Jason Ave Amarillo, TX | 1.0–2.0 | 1.0–2.0 | 931 | $962 | $1.03 | 12d | 1 | 0.78mi |
| 4005 Hilltop Dr Apt C Amarillo, TX | 2.0 | 1.0 | 784 | $850 | $1.08 | 21d | 1 | 1.12mi |
| 4005 Hilltop Dr Apt D Amarillo, TX | 3.0 | 2.0 | 924 | $1,250 | $1.35 | 21d | 1 | 1.12mi |
| 1819 Darden St Amarillo, TX | 3.0 | 1.0 | 1114 | $1,095 | $0.98 | 43d | 1 | 1.18mi |
| 702 N Buchanan St Unit B Amarillo, TX | 1.0 | 1.0 | 640 | $550 | $0.86 | 13d | 1 | 1.20mi |
| 1220 N Nelson St Amarillo, TX | 2.0 | 1.0 | 550 | $900 | $1.64 | 21d | 1 | 1.37mi |
| 2405 Rule St Amarillo, TX | 2.0 | 1.0 | 720 | $850 | $1.18 | 43d | 1 | 1.46mi |
| 823 N Nelson St Amarillo, TX | 2.0 | 1.0 | 1000 | $900 | $0.90 | 43d | 1 | 1.50mi |
Listing history 23 events
-
2026-06-18days on market $87,000 Active 26 DOM
-
2026-06-17days on market $87,000 Active 25 DOM
-
2026-06-16days on market $87,000 Active 24 DOM
-
2026-06-15days on market $87,000 Active 23 DOM
-
2026-06-14days on market $87,000 Active 21 DOM
-
2026-06-13days on market $87,000 Active 20 DOM
-
2026-06-10days on market $87,000 Active 18 DOM
-
2026-06-09days on market $87,000 Active 17 DOM
-
2026-06-08days on market $87,000 Active 16 DOM
-
2026-06-07days on market $87,000 Active 15 DOM
-
2026-06-03days on market $87,000 Active 11 DOM
-
2026-06-02days on market $87,000 Active 10 DOM
-
2026-06-01days on market $87,000 Active 9 DOM
-
2026-05-31days on market $87,000 Active 8 DOM
-
2026-05-30days on market $87,000 Active 7 DOM
-
2026-05-23$87,000 Active
-
2025-03-22historical $950
-
2025-03-05$950
-
2024-03-14historical $950
-
2024-01-31$950
-
2018-06-15soldstatus
-
2009-12-15soldstatus
-
2005-09-08soldstatus
ⓘ Source: listings_history table (triggers on properties + properties_extension) + one-shot
backfill from property_details.listing_events for pre-trigger history.
Tax reassessment forecast TX · Resets to sale price
- Current annual tax
- $1,503 · $125/mo
- Projected year-2 tax
- $1,592 · $133/mo
- Expected delta
- +$89/yr (+$7/mo · 5.9%)
ⓘ Screening estimate from a state-policy table — verify with the county assessor before closing.
Climate risk First Street
- Flood 1/10 Low FEMA zone X (unshaded) · 0% chance over 30 yrs
- Wildfire 5/10 Major
- Heat 4/10 Moderate 7 d/yr ≥97°F today · 19 d/yr by 30 yrs out
- Wind 2/10 Low
- Air quality 2/10 Low 1 unhealthy d/yr today · 1 by 30 yrs out
Nearby sold comps map
Loading sold comps map…
Walkable amenities ~0.75 mi
Loading nearby amenities…
Taxation est. · year 1
- Rental income
- $12,526
- − Mortgage interest
- −$4,873
- − Property taxes
- −$1,503
- − Insurance
- −$435
- − Repairs & maintenance
- −$1,002
- − Management
- −$1,002
- − Depreciation
- −$2,531
- Taxable income
- $1,179
- Est. tax owed @ 24.0%
- −$283
- After-tax cash flow
- $2,199/yr
For passive investors: Depreciation is non-cash, so a rental often shows a tax loss while cash-flowing — sheltering income. Rental losses are passive: they offset passive income freely, and up to $25,000/yr can offset ordinary (W-2) income if you actively participate and your MAGI is under $100k (phasing out to $0 by $150k); unused losses carry forward. On sale, claimed depreciation is recaptured at up to 25%, and gains may owe capital-gains tax (a 1031 exchange can defer both). Figures are a year-1 estimate at your 24.0% rate — not tax advice; consult a CPA.
Schools (NCES district)
- District
- Amarillo ISD
- NCES district ID
- 4808130
- Math proficiency
- 44% ▼ -9.00%
- Reading proficiency
- 41% ▼ -3.00%
- Median HH income
- $43,478
- Composite
- 35.96/100
- National rank
- #4798
- State rank
- #336 of 826 in TX
Livability — Amarillo
- Score
- 66/100
- State rank
- #624
- US rank
- #11876
Category grades
Schools grade is shown separately in the Schools card above.
Census & demographics
- Census place
- Amarillo, TX
- County
- Potter County · 72,216 people
- City population
- 185,802
- Metro
- Amarillo, TX
- Population (ZIP)
- 36,662
- Household income
- $40,671
- Rent vs Own
- Severe rent burden
- 1019.0
Population outlook (Potter County) Hauer SSP2
- Today (2025)
- 121,296 people
- By 2030
- 120,883 · -0.3%
- By 2040
- 119,668 · -1.3%
- By 2050
- 117,788 · -2.9%
- By 2075
- 110,250 · -9.1%
- By 2100
- 92,923 · -23.4%
Race, ethnicity, and origin ACS 2023
- Neighborhood character
- Diverse neighborhood (Simpson 0.70)
- Race & ethnicity
- Hispanic / Latino 45% Black 25% Two or more races 17% White 16% Asian 10%
- Hispanic origin (detail)
- Mexican 41%
- Common ancestry
- Ukrainian 1% Lithuanian 1%
- Foreign-born
- 27% · Canada, Philippines, Vietnam
- Languages at home
- 50% English-only · Spanish 35% Other Asian/Pacific 7% Vietnamese 2%
Political lean MEDSL · Potter
- 2024 margin
- Solid R (+44.4) · D 27.3% · R 71.7% · Other 1.1%
- 2008→2024 swing
- -5.0pp toward R · 2008: -39.4pp · 2024: -44.4pp
- All cycles
- 2024: R+44.4 2020: R+38.7 2016: R+41.9 2012: R+44.6 2008: R+39.4
Not yet ingested
- Civics
- —
Market trends
- HPI YoY
- ▼ -57.01%
- Current HPI
- 215.7976
- Rent YoY
- —
- Metro
- Amarillo, TX
- State GDP YoY
- ▲ 3.95%
- F500 in state
- 110
Industry mix (Fortune 500 HQ in TX)
| Industry | F500 HQs | Revenue |
|---|---|---|
| Energy | 16 | $1,198B |
|
||
| Technology | 5 | $198B |
|
||
| Engineering / Construction | 4 | $72B |
|
||
| Energy Services | 3 | $60B |
|
||
| Utilities | 3 | $41B |
|
||
| Healthcare | 2 | $330B |
|
||
Price history
8 events — show timeline
- 2026-05-23 Listed $87,000 AARMLS
- 2025-03-22 Rental Removed $950 APPFOLIO
- 2025-03-05 Listed for Rent $950 APPFOLIO
- 2024-03-14 Rental Removed $950 APPFOLIO
- 2024-01-31 Listed for Rent $950 APPFOLIO
- 2018-06-15 Sold (Public Records) — Public Records
- 2009-12-15 Sold (Public Records) — Public Records
- 2005-09-08 Sold (Public Records) — Public Records
Property tax history
+4.8%/yrLatest (2025): $1,503 · +22.4% YoY. Source: county tax records.
Cash-flow waterfall
monthlySold comps — $/sqft
last 12 mo · ≤1 miLoading sold comps…