9861 Royce Dr · Indianapolis city (balance), IN
Flood risk No data
- FEMA flood zone
- —
- Chance of flooding over 30 yrs
- —
- Est. flood insurance / yr
- —
Fire risk No data
- Est. fire insurance / yr
- —
Heat risk No data
- Hot days now (above threshold)
- —
- Hot days in 30 yrs
- —
Wind risk No data
- Chance of severe wind over 30 yrs
- —
Air-quality risk No data
- Unhealthy air days now
- —
- Unhealthy air days in 30 yrs
- —
Risk factors via First Street. Map © Google.
Why this score? — see what drove the C+ grade
The composite is a weighted blend of 9 inputs, each scored 0–100. Each bar is that input's sub-score; the figure is the points it added to the 100-point composite (weight × sub-score).
- Cash flow +29.2/30.0
- 1% rule +10.0/10.0
- DSCR +10.0/10.0
- ARV discount +6.2/15.0
- Rent growth +3.1/5.0
- Livability +2.5/5.0
- Condition / age +2.5/5.0
- Schools +1.4/10.0
- Appreciation +0.0/10.0
$72,000
🖨 Deal sheet 📄 Offer letter ✓ Due diligence
Listing remarks MLS
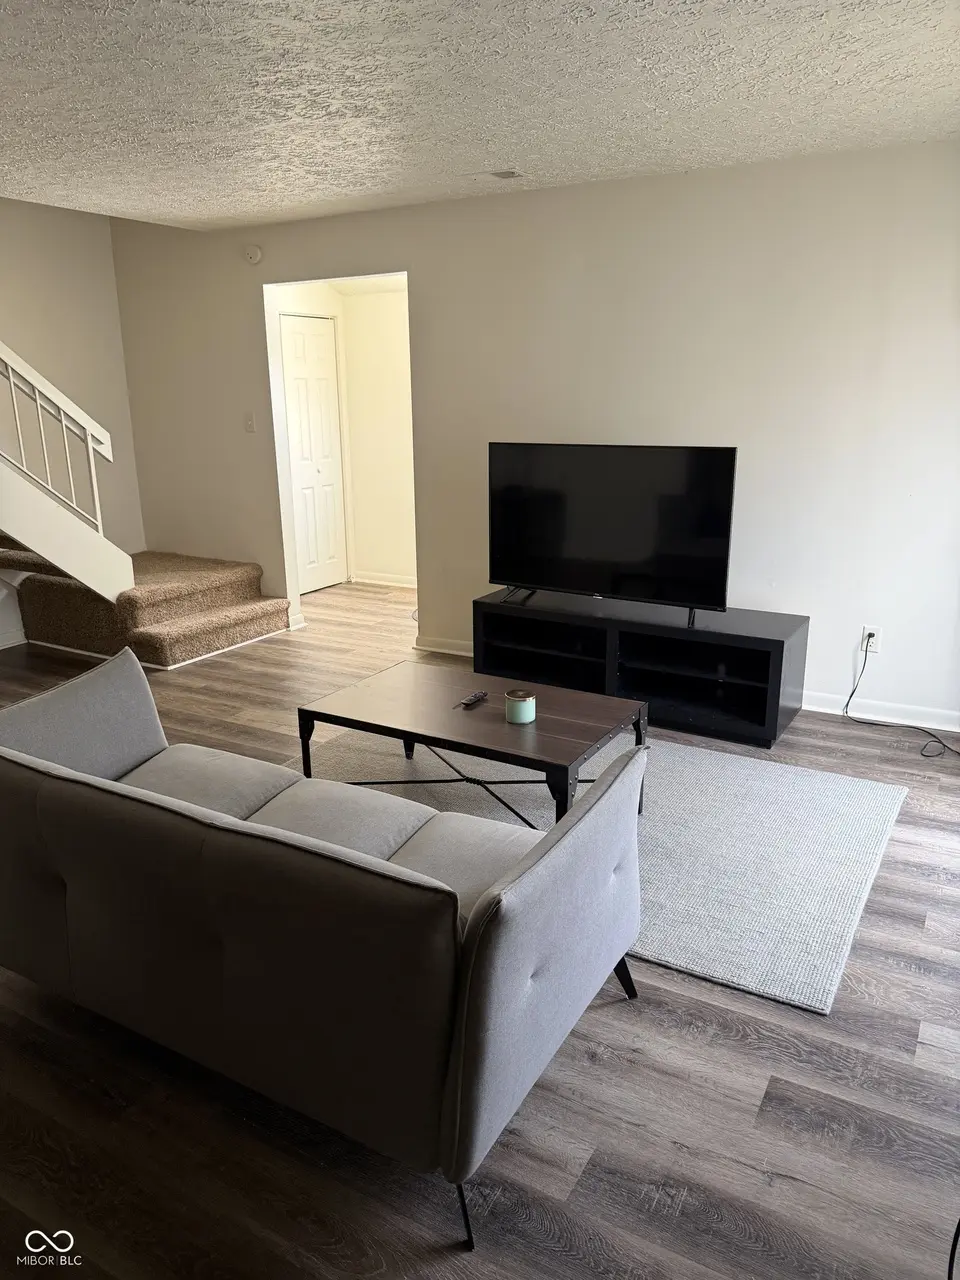
Looking for FULLY RENOVATED affordable housing OR IMMEDIATE RENTAL INCOME? You don't need to look any further. Fresh paint, remodeled Bathrooms, newer appliances, vinyl HARDWOOD floors, French doors to private patio. Park-like neighborhood thriving under new management. Cherry on a top: selling FULLY FURNISHED with APPLIANCES included, saving buyers time, energy, and the potential cost of furnishing a home.
Key facts
- Fully renovated
- Private patio
- Appliances included
Tags
Neighborhood map
What this means for you Summary
Snapshot
- This is a 2-bed/1.5-bath condo listed at $72k.
Deal economics
- At list price, monthly cash flow is $252 ($3k/yr) — positive.
- The deal already cash-flows at list — no discount required.
- Meets the 1% rule at list price ($1k rent vs $72k).
- Recommended offer: $66k (9.0% below list) — sets the bar for market timing.
- Cap rate 10.5% vs local median 4.4% in Indianapolis city (balance) — top-decile yield for the area; either an underpriced asset or a hidden risk that comps aren't pricing in. Stress-test before assuming the spread holds.
Location & tenants
- Location reads: area grade C — affects rentability + tenant quality, not the cash-flow math above.
- Indianapolis Public Schools (urban): math 14% / reading 20% proficiency, ranked #286 of 301 in IN (top 95%) — low school quality limits family demand, transient renter base, plan for 1-2y turnover; 77% free/reduced lunch — lower-income household profile, screen leases tightly.
- Market conditions: Rents rising (+2.6%/yr); 54 active listings in the ZIP; 17 comparable units currently listed for rent nearby; rentals at typical pace (median 18d on market — plan ~3-4 weeks tenant-placement turnaround); 1,906 units permitted in Marion County in 2024 (621 in 5+ unit buildings).
Forward outlook
- Local home prices are declining (-3.0%/yr); year-one equity from $498 of loan paydown is wiped out by about $2k of value loss. Plan a longer hold.
- Marion County population projected at +18% by 2050 — long-run rental-demand tailwind backs the buy-and-hold thesis.
- At projected returns (-3.0% appreciation + 2.6% rent growth), your $20k cash investment doubles in ~9 years — after that, you're playing with house money.
Negotiation context
- It's been on market 113 days — a 9% lower offer ($66k) is reasonable based on typical stale-listing flexibility.
- 4 sale attempts since 20y ago; this cycle's ask has dropped $16k (19%) from the opening price — seller is motivated, your offer sets the floor, not the list.
- Current owner paid $16k; list at $72k implies a 350% gain — meaningful room to come down on a strong offer.
Risks & watch-outs
- Watch-outs: property tax is 3.7% of price.
Questions for the listing agent
- It's been on market 113 days. Have you received any prior offers? Is the seller open to a 9% concession, seller financing, or rate buy-down credit?
- Built in 1973 — when were the roof, HVAC, electrical panel, plumbing, and water heater last replaced?
- Property tax is high relative to price — has the assessment been appealed recently, and will the sale trigger a re-assessment?
- What does the HOA fee cover, when was the last increase, and are there any pending special assessments or reserve-fund shortfalls?
- Any open or pending special assessments — roof, HVAC, plumbing, elevator, façade? What's the per-unit balance and payoff schedule, and is the seller paying it off at close or rolling it to the buyer?
- Why hasn't it sold? Are there any deal-killer items the seller is aware of (foundation, flood, title, zoning, code violations)?
- Is there a deadline driving the sale (1031 exchange, divorce, estate, relocation)? That informs how much negotiation room exists.
- What's the average days-on-market for RENTAL listings here right now (not sales)? A rising rental-DOM trend means longer vacancies and softer asking-rent achievability than the comps imply.
- What's the recent tenant-quality profile in this submarket — average credit score on applications, eviction rate, late-payment / NSF rate, and stable-employment percentage? A property-management company in the area should have these aggregated.
- How much new apartment / multifamily construction is in the pipeline within 1–3 miles? Heavy new supply (>2% of stock underway) typically softens rents 12–24 months out; light construction supports rent growth.
Investment metrics
- 1% rule
- 1.99% ✓
- Cap rate
- 10.49%
- Cash-on-cash
- 14.99%
- DSCR
- 1.67
- GRM
- 4.2
CMA / ARV
- ARV (median comp)
- $70,000
- List price
- $72,000
- Delta
- 2.86%
- Verdict
- FAIR
- Comps
- 17 within 1.0 mi
Projected returns pro-forma
-3.0% appreciation · 2.56% rent growth · sell at horizon
- IRR
- 5.1%
- Equity multiple
- 1.20×
- Total profit
- $3,999
- Equity at exit
- $10,735
- IRR
- 14.2%
- Equity multiple
- 2.12×
- Total profit
- $22,610
- Equity at exit
- $6,225
Cash invested: $20,160 (down + closing). Projections, not guarantees.
Landlord ↔ Tenant lean methodology
- Overall (STATE)
- 90 Strongly Landlord-Friendly
- State Indiana
- 90 Strongly Landlord-Friendly · R+11
- County
- — inherits STATE
- City
- — inherits STATE
ZIP-level market 46235
- Home prices YoY
- -4.3%
- Rents YoY
- 2.6%
- Active inventory
- 54
- Price-to-rent
- 4.2×
Monthly cashflow live
- Estimated rent
- $1,431 high interval (Pro) →
- Mortgage (P&I)
- −$378
- Tax from tax record
- −$221 /mo · $2,657/yr
- Insurance
- −$30
- HOA
- −$250
- Vacancy / Maint / Mgmt
- −$301
- Net cashflow
- $252
Break-even live
UW: 25.0% down · 7.5% · 30yr · 1.5% tax · 5.0% vac · 8.0% maint · 8.0% mgmt
Financing live
Cash to close
- Down payment
- $18,000
- Closing costs
- $2,160
- Reserves months
- —
- Total cash needed
- —
Loan-product check · same deal, 3 products live
Conventional
25% down · 7.5% · 30yr
- Down + closing
- —
- Monthly P&I
- —
- Monthly cashflow
- —
- DSCR
- —
- Eligible?
- —
Personal DTI + credit; lowest rate.
DSCR
20% down · 8.5% · 30yr
- Down + closing
- —
- Monthly P&I
- —
- Monthly cashflow
- —
- DSCR
- —
- Eligible?
- —
No personal income docs; deal must DSCR.
Hard money
10% down · 12.0% · 12mo
- Down + closing
- —
- Monthly P&I
- —
- Monthly cashflow
- —
- DSCR
- —
- Eligible?
- —
Short-term bridge; refi at stabilization.
Rent comps 17 comps
| Address | Beds | Baths | Sqft | Rent | $/sqft | DOM | Units | Dist |
|---|---|---|---|---|---|---|---|---|
| 9962 Catalina Dr Indianapolis, IN | 3.0 | 1.0 | 1236 | $1,600 | $1.29 | 4d | 1 | 0.29mi |
| 3962 Strathmore Dr Indianapolis, IN | 3.0 | 1.0 | 925 | $1,250 | $1.35 | 24d | 1 | 0.46mi |
| 10101 Montery Rd Indianapolis, IN | 2.0 | 1.0 | 627 | $1,439 | $2.30 | 2d | 10 | 0.56mi |
| 9226 E 36th Pl Indianapolis, IN | 3.0 | 1.0 | 1073 | $1,250 | $1.16 | 8d | 1 | 0.58mi |
| 3645 Wingate Ct Indianapolis, IN | 3.0 | 1.0–2.0 | 774 | $1,258 | $1.62 | 24d | 6 | 0.63mi |
| 9438 Conried Dr Indianapolis, IN | 3.0 | 1.0 | 1094 | $1,445 | $1.32 | 4d | 1 | 0.65mi |
| 9060 E 39th Pl Indianapolis, IN | 1.0–2.0 | 1.0–1.5 | 820 | $1,040 | $1.27 | 24d | 1 | 0.82mi |
| 3631 Decamp Dr Indianapolis, IN | 3.0 | 1.0 | 1000 | $1,335 | $1.33 | 24d | 1 | 0.98mi |
| 3665 Coneflower Way Indianapolis, IN | 3.0 | 2.0 | 1030 | $1,375 | $1.33 | 44d | 1 | 1.00mi |
| 8862 Bel Air Ct Indianapolis, IN | 3.0 | 1.0 | 1073 | $1,264 | $1.18 | 18d | 1 | 1.01mi |
| 8914 Elmonte Dr Indianapolis, IN | 3.0 | 1.5 | 1500 | $1,600 | $1.07 | 24d | 1 | 1.01mi |
| 3540 Dubarry Ct Indianapolis, IN | 3.0 | 2.0 | 1297 | $1,400 | $1.08 | 24d | 1 | 1.03mi |
| 3809 Biscayne Rd Indianapolis, IN | 2.0 | 1.5 | 992 | $1,020 | $1.03 | 15d | 1 | 1.05mi |
| 3815 Biscayne Rd Indianapolis, IN | 3.0 | 1.5 | 1188 | $1,220 | $1.03 | 15d | 1 | 1.05mi |
| 3938 Biscayne Rd Indianapolis, IN | 3.0 | 1.0 | 1000 | $1,895 | $1.90 | 3d | 1 | 1.10mi |
| 8738 Montery Rd Indianapolis, IN | 3.0 | 1.0 | 1421 | $1,396 | $0.98 | 8d | 1 | 1.15mi |
| 8724 Montery Rd Indianapolis, IN | 3.0 | 1.0 | 925 | $1,500 | $1.62 | 44d | 1 | 1.17mi |
HOA detail condo
- Monthly dues
- $250 · $3,000/yr
- Assessments
- None detected in remarks — confirm with the listing agent.
Listing history 22 events
-
2026-06-18days on market $72,000 Active 113 DOM
-
2026-06-17days on market $72,000 Active 112 DOM
-
2026-06-16days on market $72,000 Active 111 DOM
-
2026-06-15days on market $72,000 Active 110 DOM
-
2026-06-13days on market $72,000 Active 108 DOM
-
2026-06-13days on market $72,000 Active 107 DOM
-
2026-06-09days on market $72,000 Active 104 DOM
-
2026-06-08days on market $72,000 Active 103 DOM
-
2026-06-07pricedays on market $72,000 Active 102 DOM
-
2026-06-03days on market $88,500 Active 98 DOM
-
2026-06-02days on market $88,500 Active 97 DOM
-
2026-06-01days on market $88,500 Active 96 DOM
-
2026-05-31days on market $88,500 Active 95 DOM
-
2026-03-19status Active 410-char remark
Show marketing remark (410 chars)
Looking for FULLY RENOVATED affordable housing OR IMMEDIATE RENTAL INCOME? You don't need to look any further. Fresh paint, remodeled Bathrooms, newer appliances, vinyl HARDWOOD floors, French doors to private patio. Park-like neighborhood thriving under new management. Cherry on a top: selling FULLY FURNISHED with APPLIANCES included, saving buyers time, energy, and the potential cost of furnishing a home.
-
2026-03-03status Pending 410-char remark
Show marketing remark (410 chars)
Looking for FULLY RENOVATED affordable housing OR IMMEDIATE RENTAL INCOME? You don't need to look any further. Fresh paint, remodeled Bathrooms, newer appliances, vinyl HARDWOOD floors, French doors to private patio. Park-like neighborhood thriving under new management. Cherry on a top: selling FULLY FURNISHED with APPLIANCES included, saving buyers time, energy, and the potential cost of furnishing a home.
-
2026-02-09$88,500 Active 410-char remark
Show marketing remark (410 chars)
Looking for FULLY RENOVATED affordable housing OR IMMEDIATE RENTAL INCOME? You don't need to look any further. Fresh paint, remodeled Bathrooms, newer appliances, vinyl HARDWOOD floors, French doors to private patio. Park-like neighborhood thriving under new management. Cherry on a top: selling FULLY FURNISHED with APPLIANCES included, saving buyers time, energy, and the potential cost of furnishing a home.
-
2016-05-23soldstatus $16,000 Sold 169-char remark
Show marketing remark (169 chars)
Property offers great potential for investors! This property is being sold "As-Is". This property has been repainted, has brand new carpet and a new furnace!
-
2016-05-20status Pending 169-char remark
Show marketing remark (169 chars)
Property offers great potential for investors! This property is being sold "As-Is". This property has been repainted, has brand new carpet and a new furnace!
-
2016-04-22historical Active with Contingency 169-char remark
Show marketing remark (169 chars)
Property offers great potential for investors! This property is being sold "As-Is". This property has been repainted, has brand new carpet and a new furnace!
-
2016-04-11$18,000 Active 169-char remark
Show marketing remark (169 chars)
Property offers great potential for investors! This property is being sold "As-Is". This property has been repainted, has brand new carpet and a new furnace!
-
2007-12-07soldstatus $10,000
-
2006-12-26$16,900
ⓘ Source: listings_history table (triggers on properties + properties_extension) + one-shot
backfill from property_details.listing_events for pre-trigger history.
Tax reassessment forecast IN · Partial reset (capped growth)
- Current annual tax
- $2,657 · $221/mo
- Projected year-2 tax
- $2,657 · $221/mo
- Expected delta
- $0/yr ($0/mo · 0.0%)
ⓘ Screening estimate from a state-policy table — verify with the county assessor before closing.
Nearby sold comps map
Loading sold comps map…
Walkable amenities ~0.75 mi
Loading nearby amenities…
Taxation est. · year 1
- Rental income
- $17,178
- − Mortgage interest
- −$4,033
- − Property taxes
- −$2,657
- − Insurance
- −$360
- − Repairs & maintenance
- −$1,374
- − Management
- −$1,374
- − HOA
- −$3,000
- − Depreciation
- −$2,095
- Taxable income
- $2,284
- Est. tax owed @ 24.0%
- −$548
- After-tax cash flow
- $2,474/yr
For passive investors: Depreciation is non-cash, so a rental often shows a tax loss while cash-flowing — sheltering income. Rental losses are passive: they offset passive income freely, and up to $25,000/yr can offset ordinary (W-2) income if you actively participate and your MAGI is under $100k (phasing out to $0 by $150k); unused losses carry forward. On sale, claimed depreciation is recaptured at up to 25%, and gains may owe capital-gains tax (a 1031 exchange can defer both). Figures are a year-1 estimate at your 24.0% rate — not tax advice; consult a CPA.
Schools (NCES district)
- District
- Indianapolis Public Schools
- NCES district ID
- 1804770
- Math proficiency
- 14% ▼ -7.00%
- Reading proficiency
- 20% ▼ -3.00%
- Median HH income
- $32,034
- Composite
- 13.69/100
- National rank
- #9499
- State rank
- #286 of 301 in IN
Livability — Indianapolis city (balance)
No livability data for this city. (Only ~50 U.S. cities are tracked.)
Census & demographics
- Census place
- Indianapolis city (balance), IN
- County
- Marion County · 998,460 people
- City population
- 881,119
- Metro
- Indianapolis-Carmel-Anderson, IN
- Population (ZIP)
- 36,317
- Household income
- $58,951
- Rent vs Own
- Severe rent burden
- 1901.0
Population outlook (Marion County) Hauer SSP2
- Today (2025)
- 1,025,572 people
- By 2030
- 1,065,727 · +3.9%
- By 2040
- 1,141,577 · +11.3%
- By 2050
- 1,208,920 · +17.9%
- By 2075
- 1,367,288 · +33.3%
- By 2100
- 1,438,201 · +40.2%
Race, ethnicity, and origin ACS 2023
- Neighborhood character
- Diverse neighborhood (Simpson 0.62)
- Race & ethnicity
- Black 57% White 18% Hispanic / Latino 17% Two or more races 11%
- Hispanic origin (detail)
- Mexican 11% Puerto Rican 2%
- Common ancestry
- Hispanic 3% Slovak 1% Romanian 1%
- Foreign-born
- 11% · Canada
- Languages at home
- 80% English-only · Spanish 15% French/Haitian/Cajun 4%
Political lean MEDSL · Marion
- 2024 margin
- Strong D (+27.7) · D 63.0% · R 35.3% · Other 1.7%
- 2008→2024 swing
- -0.7pp no change · 2008: 28.4pp · 2024: 27.7pp
- All cycles
- 2024: D+27.7 2020: D+29.1 2016: D+22.8 2012: D+22.2 2008: D+28.4
Not yet ingested
- Civics
- —
Market trends
- HPI YoY
- ▼ -12.41%
- Current HPI
- 275.1505
- Rent YoY
- ▲ 2.56%
- Metro
- Indianapolis-Carmel-Anderson, IN
- State GDP YoY
- ▲ 2.90%
- F500 in state
- 18
Industry mix (Fortune 500 HQ in IN)
| Industry | F500 HQs | Revenue |
|---|---|---|
| Industrial Machinery | 2 | $37B |
|
||
| Healthcare | 1 | $177B |
|
||
| Pharmaceuticals | 1 | $45B |
|
||
| Metals / Steel | 1 | $18B |
|
||
| Agriculture | 1 | $17B |
|
||
| Packaging | 1 | $12B |
|
||
Price history
+423.7% since first listed9 events — show timeline
- 2026-03-19 Relisted — MIBOR as Distributed by MLS Grid
- 2026-03-03 Pending — MIBOR as Distributed by MLS Grid
- 2026-02-09 Listed $88,500 MIBOR as Distributed by MLS Grid
- 2016-05-23 Sold (MLS) $16,000 MIBOR as Distributed by MLS Grid
- 2016-05-20 Pending — MIBOR as Distributed by MLS Grid
- 2016-04-22 Contingent — MIBOR as Distributed by MLS Grid
- 2016-04-11 Listed $18,000 MIBOR as Distributed by MLS Grid
- 2007-12-07 Sold (MLS) $10,000 MIBOR as Distributed by MLS Grid
- 2006-12-26 Listed $16,900 MIBOR as Distributed by MLS Grid
Property tax history
+17.4%/yrLatest (2025): $2,657 · +91.2% YoY. Source: county tax records.
Cash-flow waterfall
monthlySold comps — $/sqft
last 12 mo · ≤1 miLoading sold comps…