 Multi-family
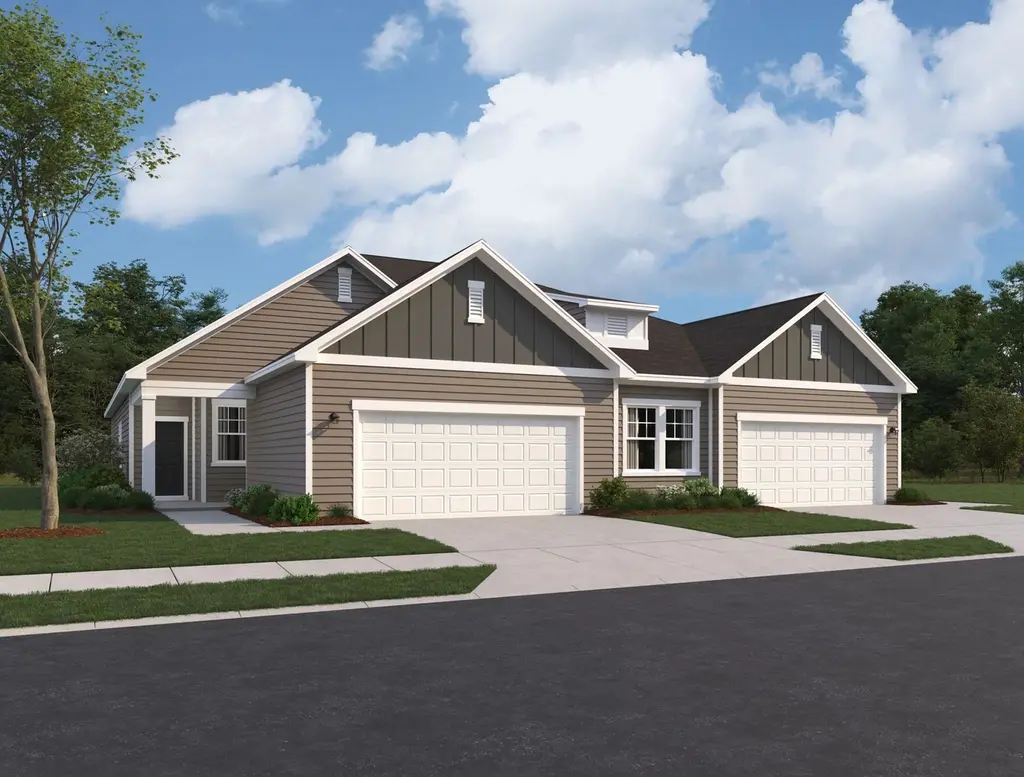
847 Hanford Landing Dr · Graham, NC
Flood risk 1/10 · Minimal
- FEMA flood zone
- X (unshaded)
- Chance of flooding over 30 yrs
- 0.0%
- Est. flood insurance / yr
- $507 – $1,088
Fire risk 3/10 · Minor
- Est. fire insurance / yr
- $906 – $1,684
Heat risk 5/10 · Moderate
- Hot days now (above 104°F)
- 7 days/yr
- Hot days in 30 yrs
- 15 days/yr
Wind risk 5/10 · Moderate
- Chance of severe wind over 30 yrs
- 22.0%
Air-quality risk 2/10 · Minimal
- Unhealthy air days now
- 1 days/yr
- Unhealthy air days in 30 yrs
- 1 days/yr
Risk factors via First Street. Map © Google.
Why this score? — see what drove the D- grade
The composite is a weighted blend of 9 inputs, each scored 0–100. Each bar is that input's sub-score; the figure is the points it added to the 100-point composite (weight × sub-score).
- Cash flow +12.0/30.0
- ARV discount +7.5/15.0
- 1% rule +3.9/10.0
- DSCR +3.6/10.0
- Livability +3.5/5.0
- Schools +3.0/10.0
- Rent growth +2.5/5.0
- Condition / age +1.0/5.0
- Appreciation +0.0/10.0
$304,990
🖨 Deal sheet (PDF) 📄 Offer letter ✓ Due diligence
Listing remarks
Welcome to Hanford Landing, where affordable homeownership and easy living come together. This thoughtfully designed one-story paired villa offers 3 bedrooms, 2 baths, and an open-concept layout that makes everyday living comfortable and convenient. Enjoy granite countertops throughout, beautiful white cabinetry with crown molding, luxury vinyl plank flooring in the main living areas, and 9-foot ceilings that create a bright and welcoming feel. The covered patio provides the perfect spot to relax, unwind, or enjoy your morning coffee. Beyond your front door, Hanford Landing is planned with sidewalks, streetlights, and a community picnic area, creating a neighborhood designed for connection
Key facts
- Covered patio
- Granite countertops
- Crown molding
Tags
Property features AI
Finance
- Other: Living area approximately 1,455
- Financial info: List price: $304,990
Exterior
- Parking: 2 parking spaces
- Utilities: Electric power; Central HVAC (heat pump for heating)
- Home design: Spec inventory, Plan name: Clay; Single-family property
Interior
- Kitchen: Includes dishwasher, disposal, microwave
- Bedrooms: 3 bedrooms
- Bathrooms: 2 bathrooms
- Heating & cooling: Electric heating with heat pump; Central air conditioning
- Interior features: Dishwasher; Disposal; Microwave
Neighborhood map
What this means for you Summary
Snapshot
- This is a 3-bed/2.0-bath multifamily listed at $305k. Condition is rated poor.
Deal economics
- At list price, monthly cash flow is $-72 ($-862/yr) — negative.
- To cash-flow at today's rent, offer at most $295k (3.4% below list).
- To meet the 1% rule (rent ≥ 1% of price), the offer needs to be $273k (10.5% below list).
- Recommended offer: $273k (10.5% below list) — sets the bar for 1% rule.
- Cap rate 6.0% vs local median 3.3% in Graham — top-decile yield for the area; either an underpriced asset or a hidden risk that comps aren't pricing in. Stress-test before assuming the spread holds.
Location & tenants
- Location reads 69/100 on livability (#144 in NC) — a middle-class / working-renter tenant base. Strengths: cost of living A+, housing A+, health & safety A+; Watch: crime C-, schools D-, amenities F.
- Alamance-Burlington Schools (rural): math 30% / reading 40% proficiency, ranked #133 of 178 in NC (top 75%) — families likely to look elsewhere, expect single-tenant / working-renter base with shorter leases.
- Market conditions: 408 active listings in the ZIP; 15 comparable units currently listed for rent nearby; rentals at typical pace (median 24d on market — plan ~3-4 weeks tenant-placement turnaround); 2,466 units permitted in Alamance County in 2024 (403 in 5+ unit buildings).
- At $2,729/mo this rent would consume 52% of the median local household income ($63k/yr) (locally 879% of renters already pay >50% of income on rent) — very limited rent-growth headroom before tenants either downsize or default.
Forward outlook
- Local home prices are declining (-3.0%/yr); year-one equity from $2k of loan paydown is wiped out by about $9k of value loss. Plan a longer hold.
- Alamance County population projected at +19% by 2050 — long-run rental-demand tailwind backs the buy-and-hold thesis.
Negotiation context
- Only 5 days on market — expect competitive offers; lowballing is unlikely to land.
Risks & watch-outs
- Climate carrying-cost: moderate wind risk, 22% chance of damaging wind over 30y; extreme-heat days projected 7→15/yr by 2055 (HVAC capex compounding) — expect insurance premiums to compound above CPI over the hold.
Questions for the listing agent
- What do current leases actually rent for vs. the listed asking? Can we see a recent rent roll and the last 12 months of T-12 income?
- Have any recent inspections been done? Can we get a copy of the seller's disclosures and any deferred-maintenance estimates?
- What does the HOA fee cover, when was the last increase, and are there any pending special assessments or reserve-fund shortfalls?
- Is there a deadline driving the sale (1031 exchange, divorce, estate, relocation)? That informs how much negotiation room exists.
- Schools are D-rated, which usually means shorter tenancies and higher turnover. Who's the typical renter profile here, and what's been the actual vacancy rate?
- The area grade is low — what's the realistic commute time and amenity access for the typical tenant pool here? Any planned neighborhood developments (good or bad) we should know about?
- What's the average days-on-market for RENTAL listings here right now (not sales)? A rising rental-DOM trend means longer vacancies and softer asking-rent achievability than the comps imply.
- What's the recent tenant-quality profile in this submarket — average credit score on applications, eviction rate, late-payment / NSF rate, and stable-employment percentage? A property-management company in the area should have these aggregated.
- How much new apartment / multifamily construction is in the pipeline within 1–3 miles? Heavy new supply (>2% of stock underway) typically softens rents 12–24 months out; light construction supports rent growth.
Investment metrics
- 1% rule
- 0.89% ✗
- Cap rate
- 6.01%
- Cash-on-cash
- -1.01%
- DSCR
- 0.96
- GRM
- 9.3
CMA / ARV
No comps found within radius.
Projected returns pro-forma
-3.0% appreciation · 3.0% rent growth · sell at horizon
- IRR
- -17.9%
- Equity multiple
- 0.37×
- Total profit
- $-53,880
- Equity at exit
- $45,475
- IRR
- -10.0%
- Equity multiple
- 0.39×
- Total profit
- $-52,340
- Equity at exit
- $26,370
Cash invested: $85,397 (down + closing). Projections, not guarantees.
Landlord ↔ Tenant lean methodology
- Overall (STATE)
- 85 Strongly Landlord-Friendly
- State North Carolina
- 85 Strongly Landlord-Friendly · R+3
- County
- — inherits STATE
- City
- — inherits STATE
ZIP-level market 27253
- Home prices YoY
- -34.2%
- Active inventory
- 408
- Price-to-rent
- 18.6×
Monthly cashflow live
- Estimated rent
- $2,729 medium interval (Pro) →
- Mortgage (P&I)
- −$1,599
- Tax est. 1.5%
- −$381 /mo · $4,575/yr
- Insurance
- −$127
- HOA
- −$120
- Lot rent
- −$0
- Vacancy / Maint / Mgmt
- −$573
- Net cashflow
- $-72
Break-even live
Sensitivity live
| Price | -10% $139 | -5% $34 | +0% $-72 | +5% $-177 | +10% $-283 |
|---|---|---|---|---|---|
| Rent | -10% $-287 | -5% $-180 | +0% $-72 | +5% $36 | +10% $144 |
| Rate | -1.0pp $82 | -0.5pp $6 | base $-72 | +0.5pp $-151 | +1.0pp $-231 |
2-unit breakdown (identical units grouped — click to expand)
| Units | Beds | Baths | Est. rent |
|---|---|---|---|
| 2× units | 3 | 2 | $2,728 |
| #1 | 3 | 2 | $1,364 |
| #2 | 3 | 2 | $1,364 |
| Total (2 units) | $2,729 | ||
UW: 25.0% down · 7.5% · 30yr · 1.5% tax · 5.0% vac · 8.0% maint · 8.0% mgmt
Financing live
Cash to close
- Down payment
- $76,248
- Closing costs
- $9,150
- Reserves months
- —
- Total cash needed
- —
Loan-product check · same deal, 3 products live
Conventional
25% down · 7.5% · 30yr
- Down + closing
- —
- Monthly P&I
- —
- Monthly cashflow
- —
- DSCR
- —
- Eligible?
- —
Personal DTI + credit; lowest rate.
DSCR
20% down · 8.5% · 30yr
- Down + closing
- —
- Monthly P&I
- —
- Monthly cashflow
- —
- DSCR
- —
- Eligible?
- —
No personal income docs; deal must DSCR.
Hard money
10% down · 12.0% · 12mo
- Down + closing
- —
- Monthly P&I
- —
- Monthly cashflow
- —
- DSCR
- —
- Eligible?
- —
Short-term bridge; refi at stabilization.
Rent comps 15 comps
| Address | Beds | Baths | Sqft | Rent | $/sqft | DOM | Units | Dist |
|---|---|---|---|---|---|---|---|---|
| 1010 Lorraine Dr Graham, NC | 3.0 | 2.0 | 1382 | $1,650 | $1.19 | 23d | 1 | 0.48mi |
| 219 Moyer Dr Graham, NC | 3.0 | 2.5 | 1500 | $1,825 | $1.22 | 16d | 1 | 0.50mi |
| 751 Kernodle Ln Graham, NC | 3.0 | 2.0 | 902 | $1,350 | $1.50 | 23d | 1 | 0.50mi |
| 201 Moyer Dr Graham, NC | 3.0 | 2.5 | 1612 | $1,950 | $1.21 | 16d | 1 | 0.51mi |
| 130 W Crescent Square Dr Graham, NC | 2.0 | 2.0 | 1159 | $1,364 | $1.18 | 23d | 6 | 0.70mi |
| 100 Ivey Rd Unit 104 Graham, NC | 2.0 | 1.5 | 1100 | $1,195 | $1.09 | 23d | 1 | 0.74mi |
| 115 Ivey Rd Unit 115-E Graham, NC | 2.0 | 1.5 | 965 | $1,296 | $1.34 | 23d | 1 | 0.74mi |
| 115 Ivey Rd Unit 115-H Graham, NC | 2.0 | 1.5 | 965 | $1,295 | $1.34 | 23d | 1 | 0.74mi |
| 433 Holt Ave Graham, NC | 2.0 | 2.0 | 1205 | $1,727 | $1.43 | 16d | 1 | 1.05mi |
| 318 Wilson St Graham, NC | 3.0 | 2.0 | 1279 | $1,795 | $1.40 | 16d | 1 | 1.13mi |
| 507 Cornelia Dr Graham, NC | 3.0 | 2.0 | 1600 | $1,600 | $1.00 | 16d | 1 | 1.17mi |
| 250 Nicks St Graham, NC | 3.0 | 2.0 | 1392 | $1,800 | $1.29 | 23d | 1 | 1.21mi |
| 284 Still Pasture Ln Unit 284 Graham, NC | 3.0 | 2.5 | 1400 | $1,975 | $1.41 | 23d | 1 | 1.31mi |
| 284 Still Pasture Ln Unit 284 Graham, NC | 3.0 | 2.5 | 1400 | $1,975 | $1.41 | 16d | 1 | 1.31mi |
| 317a Atwood Dr Burlington, NC | 2.0 | 1.5 | 980 | $1,282 | $1.31 | 23d | 8 | 1.35mi |
HOA detail
- Monthly dues
- $120 · $1,440/yr
Listing history 13 events
-
2026-06-15status $304,990 Pending 5 DOM
-
2026-06-15days on market $304,990 Active 5 DOM
-
2026-06-14days on market $304,990 Active 3 DOM
-
2026-06-13days on market $304,990 Active 2 DOM
-
2026-06-10days on market $304,990 Active 25 DOM
-
2026-06-09days on market $304,990 Active 24 DOM
-
2026-06-08days on market $304,990 Active 23 DOM
-
2026-06-07days on market $304,990 Active 22 DOM
-
2026-06-05days on market $304,990 Active 19 DOM
-
2026-06-02days on market $304,990 Active 17 DOM
-
2026-06-01days on market $304,990 Active 16 DOM
-
2026-05-31days on market $304,990 Active 15 DOM
-
2026-05-30days on market $304,990 Active 14 DOM
ⓘ Source: listings_history table (triggers on properties + properties_extension) + one-shot
backfill from property_details.listing_events for pre-trigger history.
Climate risk First Street
- Flood 1/10 Low FEMA zone X (unshaded) · 0% chance over 30 yrs
- Wildfire 3/10 Moderate
- Heat 5/10 Major 7 d/yr ≥104°F today · 15 d/yr by 30 yrs out
- Wind 5/10 Major 22% chance of damaging wind over 30 yrs
- Air quality 2/10 Low 1 unhealthy d/yr today · 1 by 30 yrs out
Nearby sold comps map
Loading sold comps map…
Walkable amenities ~0.75 mi
Loading nearby amenities…
Taxation est. · year 1
- Rental income
- $32,748
- − Mortgage interest
- −$17,084
- − Property taxes
- −$4,575
- − Insurance
- −$1,525
- − Repairs & maintenance
- −$2,620
- − Management
- −$2,620
- − HOA
- −$1,440
- − Depreciation
- −$8,872
- Taxable loss
- −$5,988
- Est. tax savings @ 24.0%
- +$1,437
- After-tax cash flow
- $575/yr
For passive investors: Depreciation is non-cash, so a rental often shows a tax loss while cash-flowing — sheltering income. Rental losses are passive: they offset passive income freely, and up to $25,000/yr can offset ordinary (W-2) income if you actively participate and your MAGI is under $100k (phasing out to $0 by $150k); unused losses carry forward. On sale, claimed depreciation is recaptured at up to 25%, and gains may owe capital-gains tax (a 1031 exchange can defer both). Figures are a year-1 estimate at your 24.0% rate — not tax advice; consult a CPA.
Condition & rehab AI · 1 photo
This property requires extensive repairs and updates to bring it up to a livable condition. Significant investment is needed in the roof, exterior, flooring, interior walls, windows, HVAC, and landscaping to make it move-in ready.
Repairs flagged
- Major roof — No visible roof in the satellite image.
- Major exterior — No visible exterior in the satellite image.
- Major flooring — No visible flooring in the satellite image.
- Major interior walls/paint — No visible interior walls/paint in the satellite image.
- Major windows — No visible windows in the satellite image.
- Major foundation/structure — No visible foundation/structure in the satellite image.
- Major HVAC/mechanicals — No visible HVAC/mechanicals in the satellite image.
- Major landscaping/curb appeal — No visible landscaping/curb appeal in the satellite image.
Value-add opportunities
- Both roof replacement — A new roof would significantly improve the home's appearance and functionality.
- Both exterior painting/staining — A fresh coat of paint/staining would enhance curb appeal and value.
- Both flooring replacement — New flooring would improve the home's aesthetic and functionality.
- Both interior painting — Fresh paint would improve the home's appearance and value.
- Both window replacement — New windows would improve energy efficiency and curb appeal.
- Both HVAC system upgrade — A new HVAC system would improve comfort and energy efficiency.
- Both landscaping — A well-maintained landscape would enhance curb appeal and property value.
Renovation cost estimate screening
| Repair item | Severity | Est. cost |
|---|---|---|
| roof · No visible roof in the satellite image. | Major | $15,000–50,000 |
| exterior · No visible exterior in the satellite image. | Major | $15,000–50,000 |
| flooring · No visible flooring in the satellite image. | Major | $15,000–50,000 |
| interior walls/paint · No visible interior walls/paint in the satellite image. | Major | $15,000–50,000 |
| windows · No visible windows in the satellite image. | Major | $15,000–50,000 |
| foundation/structure · No visible foundation/structure in the satellite image. | Major | $15,000–50,000 |
| HVAC/mechanicals · No visible HVAC/mechanicals in the satellite image. | Major | $15,000–50,000 |
| landscaping/curb appeal · No visible landscaping/curb appeal in the satellite image. | Major | $15,000–50,000 |
| Total estimated repair cost · 8 items | $120,000–400,000 |
Value-add ROI direction
- Both roof replacement — A new roof would significantly improve the home's appearance and functionality. ↑
- Both exterior painting/staining — A fresh coat of paint/staining would enhance curb appeal and value. ↑
- Both flooring replacement — New flooring would improve the home's aesthetic and functionality. ↑
- Both interior painting — Fresh paint would improve the home's appearance and value. ↑
- Both window replacement — New windows would improve energy efficiency and curb appeal. ↑
- Both HVAC system upgrade — A new HVAC system would improve comfort and energy efficiency. ↑
- Both landscaping — A well-maintained landscape would enhance curb appeal and property value. ↑
ⓘ Cost ranges are severity-bucket heuristics (US national rule-of-thumb). Get contractor quotes + a written scope before underwriting a rehab budget.
Schools (NCES district)
- District
- Alamance-Burlington Schools
- NCES district ID
- 3700030
- Math proficiency
- 30% ▼ -6.00%
- Reading proficiency
- 40% ▲ 2.00%
- Median HH income
- $43,359
- Composite
- 29.68/100
- National rank
- #6460
- State rank
- #133 of 178 in NC
Livability — Graham
- Score
- 69/100
- State rank
- #144
- US rank
- #8181
Category grades
Schools grade is shown separately in the Schools card above.
Census & demographics
- Census place
- Graham, NC
- County
- Alamance County · 173,369 people
- City population
- 33,114
- Metro
- Burlington, NC
- Population (ZIP)
- 33,114
- Household income
- $62,774
- Rent vs Own
- Severe rent burden
- 879.0
Population outlook (Alamance County) Hauer SSP2
- Today (2025)
- 173,381 people
- By 2030
- 180,609 · +4.2%
- By 2040
- 194,327 · +12.1%
- By 2050
- 206,158 · +18.9%
- By 2075
- 235,665 · +35.9%
- By 2100
- 258,626 · +49.2%
Race, ethnicity, and origin ACS 2023
- Neighborhood character
- Diverse neighborhood (Simpson 0.56)
- Race & ethnicity
- White 62% Hispanic / Latino 17% Black 16% Two or more races 9%
- Hispanic origin (detail)
- Mexican 10%
- Common ancestry
- Slovak 3% Romanian 2% Italian 1%
- Foreign-born
- 10% · Canada, Jamaica, Dominican Republic
- Languages at home
- 84% English-only · Spanish 13%
Political lean MEDSL · Alamance
- 2024 margin
- Lean R (+8.2) · D 45.4% · R 53.5% · Other 1.1%
- 2008→2024 swing
- +1.1pp toward D · 2008: -9.2pp · 2024: -8.2pp
- All cycles
- 2024: R+8.2 2020: R+8.4 2016: R+12.9 2012: R+14.1 2008: R+9.2
Not yet ingested
- Civics
- —
Market trends
- HPI YoY
- ▼ -103.91%
- Current HPI
- 200.155
- Rent YoY
- —
- Metro
- Burlington, NC
- State GDP YoY
- ▲ 3.28%
- F500 in state
- 26
Industry mix (Fortune 500 HQ in NC)
| Industry | F500 HQs | Revenue |
|---|---|---|
| Financial Services | 2 | $213B |
|
||
| Retail | 2 | $95B |
|
||
| Industrial Conglomerate | 1 | $38B |
|
||
| Metals / Steel | 1 | $35B |
|
||
| Utilities | 1 | $30B |
|
||
| Industrial Machinery | 1 | $19B |
|
||
Cash-flow waterfall
monthlySold comps — $/sqft
last 12 mo · ≤1 miLoading sold comps…