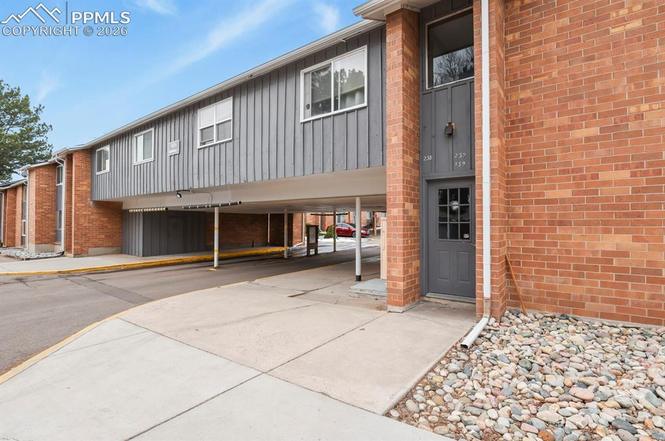
1625 N Murray Blvd #139 · Colorado Springs, CO
Flood risk 1/10 · Minimal
- FEMA flood zone
- X (unshaded)
- Chance of flooding over 30 yrs
- 0.0%
- Est. flood insurance / yr
- $507 – $1,088
Fire risk 5/10 · Moderate
- Est. fire insurance / yr
- $939 – $1,743
Heat risk 2/10 · Minimal
- Hot days now (above 89°F)
- 7 days/yr
- Hot days in 30 yrs
- 17 days/yr
Wind risk 2/10 · Minimal
- Chance of severe wind over 30 yrs
- —
Air-quality risk 1/10 · Minimal
- Unhealthy air days now
- 0 days/yr
- Unhealthy air days in 30 yrs
- 0 days/yr
Risk factors via First Street. Map © Google.
Why this score? — see what drove the D grade
The composite is a weighted blend of 9 inputs, each scored 0–100. Each bar is that input's sub-score; the figure is the points it added to the 100-point composite (weight × sub-score).
- Cash flow +14.2/30.0
- ARV discount +7.5/15.0
- 1% rule +6.1/10.0
- DSCR +4.3/10.0
- Livability +3.9/5.0
- Rent growth +2.9/5.0
- Schools +2.5/10.0
- Condition / age +2.5/5.0
- Appreciation +0.0/10.0
$130,000
🖨 Deal sheet (PDF) 📄 Offer letter ✓ Due diligence
Listing remarks
Quaint 2-bedroom, 1.5-bath end-unit condo offering a functional and inviting layout. Upon entry, an enclosed interior entryway leads to the front door of the unit. Inside, the galley-style kitchen is located to the left and features a convenient pass-through to the dining area, along with a door leading to a back porch with an attached storage closet. Straight ahead from the entry is a spacious combined living and dining area, ideal for comfortable everyday living. Both bedrooms are well-sized and connected by a Jack-and-Jill style bathroom setup, offering a full bath plus an additional half bath for added convenience. As an end unit, the condo provides extra privacy and is one of the large
Key facts
- Back porch
- Galley style kitchen
- $352 HOA
Tags
Neighborhood map
What this means for you Summary
Snapshot
- This is a 2-bed/2.0-bath condo listed at $130k.
Deal economics
- At list price, monthly cash flow is $22 ($262/yr) — positive.
- The deal already cash-flows at list — no discount required.
- Meets the 1% rule at list price ($1k rent vs $130k).
- Recommended offer: $122k (6.0% below list) — sets the bar for market timing.
- Cap rate 6.5% vs local median 3.3% in Colorado Springs — top-decile yield for the area; either an underpriced asset or a hidden risk that comps aren't pricing in. Stress-test before assuming the spread holds.
Location & tenants
- Location reads 78/100 on livability (#23 in CO, #2,639 nationally) — a middle-class / working-renter tenant base. Strengths: amenities A+, housing A+, health & safety A+; Watch: cost of living C-, crime F.
- Colorado Springs School District No. 11 In The County Of E (urban): math 20% / reading 37% proficiency, ranked #56 of 86 in CO (top 65%) — low school quality limits family demand, transient renter base, plan for 1-2y turnover.
- Zoned schools: Wilson Elementary School (math 5% / reading 17%, grade F, #879 of 966 statewide, top 94%, 363 students, 84% FRL); Sabin Middle School (math 17% / reading 32%, grade F, #172 of 270 statewide, top 65%, 601 students, 67% FRL); Mitchell High School (math 2% / reading 22%, grade F, #352 of 381 statewide, top 94%, 886 students, 72% FRL) — zoned schools average 74% FRL vs 49% district-wide (26 pts higher); higher-poverty schools than district average — tighter screening recommended.
- Zoned-school proficiency averages 16% at this address vs 28% district-wide (-13 pts) — the specific schools serving this property underperform the Colorado Springs School District No. 11 In The County Of E average; the district grade overstates school quality for this exact location.
- Market conditions: Rents rising (+1.6%/yr); 150 active listings in the ZIP; 28 comparable units currently listed for rent nearby; rentals at typical pace (median 16d on market — plan ~3-4 weeks tenant-placement turnaround); 3,906 units permitted in El Paso County in 2024 (872 in 5+ unit buildings).
Forward outlook
- Local home prices are declining (-3.0%/yr); year-one equity from $899 of loan paydown is wiped out by about $4k of value loss. Plan a longer hold.
- El Paso County population projected at +28% by 2050 — long-run rental-demand tailwind backs the buy-and-hold thesis.
Negotiation context
- It's been on market 80 days — a 6% lower offer ($122k) is reasonable based on typical stale-listing flexibility.
Risks & watch-outs
- Watch-outs: HOA is 24% of rent.
- Climate carrying-cost: moderate wildfire risk — expect insurance premiums to compound above CPI over the hold.
Questions for the listing agent
- It's been on market 80 days. Have you received any prior offers? Is the seller open to a 6% concession, seller financing, or rate buy-down credit?
- Built in 1968 — when were the roof, HVAC, electrical panel, plumbing, and water heater last replaced?
- What does the HOA fee cover, when was the last increase, and are there any pending special assessments or reserve-fund shortfalls?
- Any open or pending special assessments — roof, HVAC, plumbing, elevator, façade? What's the per-unit balance and payoff schedule, and is the seller paying it off at close or rolling it to the buyer?
- Why hasn't it sold? Are there any deal-killer items the seller is aware of (foundation, flood, title, zoning, code violations)?
- Is there a deadline driving the sale (1031 exchange, divorce, estate, relocation)? That informs how much negotiation room exists.
- Schools are B-rated — typically a magnet for longer-tenancy family renters. What's the average tenant stay here, and is there a school-zone premium baked into asking?
- Crime grade is F in this area — have there been break-ins, vandalism, or insurance claims at this property in the last 3 years? What carrier currently insures it and at what premium?
- The area grade is low — what's the realistic commute time and amenity access for the typical tenant pool here? Any planned neighborhood developments (good or bad) we should know about?
- What's the average days-on-market for RENTAL listings here right now (not sales)? A rising rental-DOM trend means longer vacancies and softer asking-rent achievability than the comps imply.
- What's the recent tenant-quality profile in this submarket — average credit score on applications, eviction rate, late-payment / NSF rate, and stable-employment percentage? A property-management company in the area should have these aggregated.
- How much new apartment / multifamily construction is in the pipeline within 1–3 miles? Heavy new supply (>2% of stock underway) typically softens rents 12–24 months out; light construction supports rent growth.
Investment metrics
- 1% rule
- 1.11% ✓
- Cap rate
- 6.49%
- Cash-on-cash
- 0.72%
- DSCR
- 1.03
- GRM
- 7.5
CMA / ARV
No comps found within radius.
Projected returns pro-forma
-3.0% appreciation · 1.59% rent growth · sell at horizon
- IRR
- -17.0%
- Equity multiple
- 0.41×
- Total profit
- $-21,535
- Equity at exit
- $19,383
- IRR
- -12.2%
- Equity multiple
- 0.33×
- Total profit
- $-24,363
- Equity at exit
- $11,240
Cash invested: $36,400 (down + closing). Projections, not guarantees.
Landlord ↔ Tenant lean methodology
- Overall (STATE)
- 38 Tenant-Leaning
- State Colorado
- 38 Tenant-Leaning · D+4
- County
- — inherits STATE
- City
- — inherits STATE
ZIP-level market 80915
- Home prices YoY
- -30.2%
- Rents YoY
- 1.6%
- Active inventory
- 150
- Price-to-rent
- 7.5×
Monthly cashflow live
- Estimated rent
- $1,438 high interval (Pro) →
- Mortgage (P&I)
- −$682
- Tax from tax record
- −$26 /mo · $317/yr
- Insurance
- −$54
- HOA
- −$352
- Vacancy / Maint / Mgmt
- −$302
- Net cashflow
- $22
Break-even live
Sensitivity live
| Price | -10% $95 | -5% $59 | +0% $22 | +5% $-15 | +10% $-52 |
|---|---|---|---|---|---|
| Rent | -10% $-92 | -5% $-35 | +0% $22 | +5% $79 | +10% $135 |
| Rate | -1.0pp $87 | -0.5pp $55 | base $22 | +0.5pp $-12 | +1.0pp $-46 |
UW: 25.0% down · 7.5% · 30yr · 1.5% tax · 5.0% vac · 8.0% maint · 8.0% mgmt
Financing live
Cash to close
- Down payment
- $32,500
- Closing costs
- $3,900
- Reserves months
- —
- Total cash needed
- —
Loan-product check · same deal, 3 products live
Conventional
25% down · 7.5% · 30yr
- Down + closing
- —
- Monthly P&I
- —
- Monthly cashflow
- —
- DSCR
- —
- Eligible?
- —
Personal DTI + credit; lowest rate.
DSCR
20% down · 8.5% · 30yr
- Down + closing
- —
- Monthly P&I
- —
- Monthly cashflow
- —
- DSCR
- —
- Eligible?
- —
No personal income docs; deal must DSCR.
Hard money
10% down · 12.0% · 12mo
- Down + closing
- —
- Monthly P&I
- —
- Monthly cashflow
- —
- DSCR
- —
- Eligible?
- —
Short-term bridge; refi at stabilization.
Rent comps 28 comps
| Address | Beds | Baths | Sqft | Rent | $/sqft | DOM | Units | Dist |
|---|---|---|---|---|---|---|---|---|
| 1625 N Murray Blvd Colorado Springs, CO | 2.0 | 2.0–2.5 | 1150 | $1,750 | $1.52 | 5d | 2 | 0.02mi |
| 1625 N Murray Blvd Colorado Springs, CO | 2.0 | 1.0 | 1000 | $1,495 | $1.50 | 25d | 1 | 0.04mi |
| 1708 Sawyer Way #271 Colorado Springs, CO | 2.0 | 1.0 | 1000 | $1,025 | $1.02 | 5d | 1 | 0.09mi |
| 1670 N Murray Blvd Colorado Springs, CO | 2.0 | 1.0 | 816 | $1,315 | $1.61 | 16d | 1 | 0.14mi |
| 1429 Potter Dr Colorado Springs, CO | 1.0–2.0 | 1.0 | 675 | $999 | $1.48 | 5d | 3 | 0.39mi |
| 4010 Tappan Dr Colorado Springs, CO | 1.0–2.0 | 1.0 | 717 | $1,295 | $1.80 | 16d | 4 | 0.47mi |
| 1220 Potter Dr Colorado Springs, CO | 1.0–3.0 | 1.0 | 827 | $1,050 | $1.27 | 25d | 1 | 0.67mi |
| 3734 E La Salle St Colorado Springs, CO | 3.0 | 1.0 | 715 | $1,299 | $1.82 | 5d | 14 | 0.71mi |
| 4620 Galley Rd Unit 4622 Colorado Springs, CO | 2.0 | 1.0 | 884 | $1,400 | $1.58 | 16d | 1 | 0.72mi |
| 1726 Clemson Dr Colorado Springs, CO | 2.0 | 1.0 | 750 | $886 | $1.18 | 23d | 1 | 0.80mi |
| 3717 E San Miguel St Colorado Springs, CO | 2.0 | 1.0 | 675 | $1,210 | $1.79 | 16d | 11 | 0.89mi |
| 1123 Lehmberg Blvd Unit 1546114P Colorado Springs, CO | 3.0 | 1.0 | 1367 | $2,742 | $2.01 | 16d | 1 | 0.95mi |
| 1017 Delaware Dr Colorado Springs, CO | 2.0 | 1.0 | 850 | $900 | $1.06 | 25d | 1 | 0.96mi |
| 3835 Radiant Dr Colorado Springs, CO | 1.0–2.0 | 1.0 | 700 | $1,149 | $1.64 | 5d | 13 | 0.99mi |
| 3617 Marion Dr Colorado Springs, CO | 1.0–2.0 | 1.0 | 763 | $1,129 | $1.48 | 5d | 1 | 1.00mi |
| 3616 Galley Rd Colorado Springs, CO | 1.0–2.0 | 1.0 | 680 | $1,149 | $1.69 | 5d | 2 | 1.02mi |
| 620 N Murray Blvd Colorado Springs, CO | 1.0–2.0 | 1.0 | 750 | $1,173 | $1.56 | 5d | 3 | 1.07mi |
| 5530 Bowden Loop Colorado Springs, CO | 2.0 | 1.0 | 887 | $995 | $1.12 | 5d | 1 | 1.12mi |
| 5549 Bonita Village Rd Colorado Springs, CO | 2.0 | 2.0 | 1128 | $1,495 | $1.33 | 5d | 1 | 1.14mi |
| 5560 Bowden Loop Unit D Lower Colorado Springs, CO | 2.0 | 1.0 | 884 | $995 | $1.13 | 25d | 1 | 1.16mi |
| 1702 Holmes Dr Colorado Springs, CO | 3.0 | 1.0 | 1038 | $1,795 | $1.73 | 23d | 1 | 1.24mi |
| 913 N Chelton Rd Colorado Springs, CO | 1.0–3.0 | 1.0–2.5 | 1062 | $1,360 | $1.28 | 5d | 5 | 1.29mi |
| 1350 Cascade Creek Vw Colorado Springs, CO | 1.0–3.0 | 1.0–2.0 | 1042 | $1,818 | $1.74 | 5d | 24 | 1.32mi |
| 255 Lionstone Dr Colorado Springs, CO | 1.0–2.0 | 1.0–2.0 | 755 | $1,802 | $2.39 | 5d | 14 | 1.39mi |
| 240 N Murray Blvd Colorado Springs, CO | 1.0–2.0 | 1.0 | 777 | $1,196 | $1.54 | 16d | 17 | 1.42mi |
| 3865 Village Rd S Unit 3865 Colorado Springs, CO | 2.0 | 1.0 | 800 | $1,150 | $1.44 | 25d | 1 | 1.46mi |
| 897 Grissom Dr Colorado Springs, CO | 2.0 | 2.5 | 1150 | $2,400 | $2.09 | 25d | 1 | 1.48mi |
| 5550 Cernan Hts Colorado Springs, CO | 1.0–3.0 | 1.0–2.0 | 892 | $1,800 | $2.02 | 5d | 19 | 1.49mi |
HOA detail condo
- Monthly dues
- $352 · $4,224/yr
- Assessments
- None detected in remarks — confirm with the listing agent.
Listing history 6 events
-
2026-04-28status Pending
-
2026-03-28price $130,000
-
2026-03-15price $140,000
-
2026-02-08$150,000 Active
-
2005-12-29soldstatus $372,000
-
1979-06-01soldstatus $23,500
ⓘ Source: listings_history table (triggers on properties + properties_extension) + one-shot
backfill from property_details.listing_events for pre-trigger history.
Tax reassessment forecast CO · Resets to sale price
- Current annual tax
- $317 · $26/mo
- Projected year-2 tax
- $715 · $60/mo
- Expected delta
- +$398/yr (+$33/mo · 125.3%)
ⓘ Screening estimate from a state-policy table — verify with the county assessor before closing.
Climate risk First Street
- Flood 1/10 Low FEMA zone X (unshaded) · 0% chance over 30 yrs
- Wildfire 5/10 Major
- Heat 2/10 Low 7 d/yr ≥89°F today · 17 d/yr by 30 yrs out
- Wind 2/10 Low
- Air quality 1/10 Low 0 unhealthy d/yr today · 0 by 30 yrs out
Nearby sold comps map
Loading sold comps map…
Walkable amenities ~0.75 mi
Loading nearby amenities…
Taxation est. · year 1
- Rental income
- $17,258
- − Mortgage interest
- −$7,282
- − Property taxes
- −$317
- − Insurance
- −$650
- − Repairs & maintenance
- −$1,381
- − Management
- −$1,381
- − HOA
- −$4,224
- − Depreciation
- −$3,782
- Taxable loss
- −$1,759
- Est. tax savings @ 24.0%
- +$422
- After-tax cash flow
- $684/yr
For passive investors: Depreciation is non-cash, so a rental often shows a tax loss while cash-flowing — sheltering income. Rental losses are passive: they offset passive income freely, and up to $25,000/yr can offset ordinary (W-2) income if you actively participate and your MAGI is under $100k (phasing out to $0 by $150k); unused losses carry forward. On sale, claimed depreciation is recaptured at up to 25%, and gains may owe capital-gains tax (a 1031 exchange can defer both). Figures are a year-1 estimate at your 24.0% rate — not tax advice; consult a CPA.
Schools (NCES district)
- District
- Colorado Springs School District No. 11 In The County Of E
- NCES district ID
- 0803060
- Math proficiency
- 20% ▼ -8.00%
- Reading proficiency
- 37% ▼ -4.00%
- Median HH income
- $47,884
- Composite
- 24.69/100
- National rank
- #7613
- State rank
- #56 of 86 in CO
Livability — Colorado Springs
- Score
- 78/100
- State rank
- #23
- US rank
- #2639
Category grades
Schools grade is shown separately in the Schools card above.
Census & demographics
- Census place
- Colorado Springs, CO
- County
- El Paso County · 689,348 people
- City population
- 555,783
- Metro
- Colorado Springs, CO
- Population (ZIP)
- 23,884
- Household income
- $72,352
- Rent vs Own
- Severe rent burden
- 650.0
Population outlook (El Paso County) Hauer SSP2
- Today (2025)
- 768,926 people
- By 2030
- 815,739 · +6.1%
- By 2040
- 903,489 · +17.5%
- By 2050
- 981,204 · +27.6%
- By 2075
- 1,155,542 · +50.3%
- By 2100
- 1,202,070 · +56.3%
Race, ethnicity, and origin ACS 2023
- Neighborhood character
- Diverse neighborhood (Simpson 0.57)
- Race & ethnicity
- White 59% Hispanic / Latino 27% Two or more races 15% Black 4% Asian 2% Native American 1%
- Hispanic origin (detail)
- Mexican 17% Puerto Rican 2%
- Common ancestry
- Italian 4% Slovak 3% Lithuanian 3%
- Foreign-born
- 6% · Canada, Dominican Republic
- Languages at home
- 88% English-only · Spanish 9% Tagalog/Filipino 1%
Political lean MEDSL · El Paso
- 2024 margin
- Lean R (+9.8) · D 43.8% · R 53.5% · Other 2.7%
- 2008→2024 swing
- +9.0pp toward D · 2008: -18.8pp · 2024: -9.8pp
- All cycles
- 2024: R+9.8 2020: R+10.8 2016: R+22.6 2012: R+21.4 2008: R+18.8
Not yet ingested
- Civics
- —
Market trends
- HPI YoY
- ▼ -122.65%
- Current HPI
- 283.9227
- Rent YoY
- ▲ 1.59%
- Metro
- Colorado Springs, CO
- State GDP YoY
- ▲ 1.95%
- F500 in state
- 14
Industry mix (Fortune 500 HQ in CO)
| Industry | F500 HQs | Revenue |
|---|---|---|
| Technology Distribution | 1 | $31B |
|
||
| Food / Agriculture | 1 | $18B |
|
||
| Packaging | 1 | $14B |
|
||
| Healthcare | 1 | $13B |
|
||
| Energy | 1 | $10B |
|
||
| Technology | 1 | $4B |
|
||
Price history
+453.2% since first listed6 events — show timeline
- 2026-04-28 Pending — elevateMLS
- 2026-03-28 Price Changed $130,000 elevateMLS
- 2026-03-15 Price Changed $140,000 elevateMLS
- 2026-02-08 Listed $150,000 elevateMLS
- 2005-12-29 Sold (Public Records) $372,000 Public Records
- 1979-06-01 Sold (Public Records) $23,500 Public Records
Property tax history
+0.4%/yrLatest (2024): $317 · +47.6% YoY. Source: county tax records.
Cash-flow waterfall
monthlySold comps — $/sqft
last 12 mo · ≤1 miLoading sold comps…