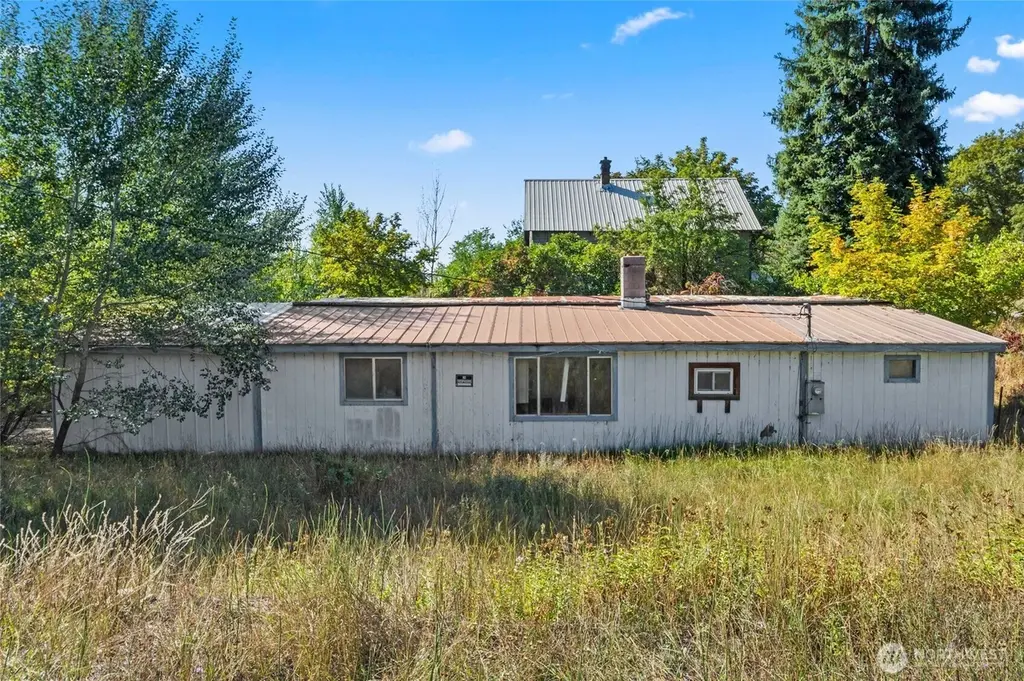
701 Silver Crown Ave · Northport, WA
Flood risk 8/10 · Major
- FEMA flood zone
- X
- Chance of flooding over 30 yrs
- 0.78%
- Est. flood insurance / yr
- $507 – $1,088
Fire risk 6/10 · Moderate
- Est. fire insurance / yr
- $604 – $1,122
Heat risk 4/10 · Minor
- Hot days now (above 92°F)
- 8 days/yr
- Hot days in 30 yrs
- 18 days/yr
Wind risk 1/10 · Minimal
- Chance of severe wind over 30 yrs
- —
Air-quality risk 10/10 · Severe
- Unhealthy air days now
- 21 days/yr
- Unhealthy air days in 30 yrs
- 23 days/yr
Risk factors via First Street. Map © Google.
Why this score? — see what drove the B+ grade
The composite is a weighted blend of 9 inputs, each scored 0–100. Each bar is that input's sub-score; the figure is the points it added to the 100-point composite (weight × sub-score).
- Cash flow +30.0/30.0
- 1% rule +10.0/10.0
- DSCR +10.0/10.0
- ARV discount +7.5/15.0
- Appreciation +7.5/10.0
- Schools +4.7/10.0
- Livability +2.9/5.0
- Rent growth +2.5/5.0
- Condition / age +2.5/5.0
$40,000
🖨 Deal sheet 📄 Offer letter ✓ Due diligence
Listing remarks
This mobile home is situated on a spacious corner lot, offering extra room and privacy. A great opportunity to own property in a quiet community, this home is ready for your personal touch. Whether you’re looking for a primary residence, a rental, or a getaway spot near the beauty of Northeast Washington, this property is full of potential. Don’t miss the chance to make it your own!
Key facts
- Corner lot
- Quiet community
- 5,998 sq ft lot
Tags
Neighborhood map
What this means for you Summary
Snapshot
- This is a 1-bed/1.0-bath manufactured listed at $40k.
Deal economics
- At list price, monthly cash flow is $301 ($4k/yr) — positive.
- The deal already cash-flows at list — no discount required.
- Meets the 1% rule at list price ($791 rent vs $40k).
- Recommended offer: $35k (12.0% below list) — sets the bar for market timing.
Location & tenants
- Location reads 58/100 on livability (#518 in WA) — a working-class tenant base; expect higher turnover. Strengths: cost of living A+, housing B+; Watch: schools C-, crime F, amenities F.
- Northport School District (rural): math 50% / reading 60% proficiency, ranked #121 of 291 in WA (top 42%) — acceptable for families but not a draw, mixed tenant base, ~2y average lease.
- Market conditions: 25 active listings in the ZIP; 341 units permitted in Stevens County in 2024 (72 in 5+ unit buildings).
Forward outlook
- In year one you build about $2k of equity ($277 loan paydown + $2k appreciation (5.0% local appreciation)).
- Stevens County population projected at -12% by 2050 — secular population decline; favor cash flow + early exit over multi-decade hold.
- At projected returns (5.0% appreciation + 3.0% rent growth), your $11k cash investment doubles in ~2 years — after that, you're playing with house money.
Negotiation context
- It's been on market 265 days — a 12% lower offer ($35k) is reasonable based on typical stale-listing flexibility.
Risks & watch-outs
- Watch-outs: flood insurance adds $66/mo.
- Climate carrying-cost: severe flood risk; major wildfire risk — expect insurance premiums to compound above CPI over the hold.
Questions for the listing agent
- It's been on market 265 days. Have you received any prior offers? Is the seller open to a 12% concession, seller financing, or rate buy-down credit?
- Built in 1979 — when were the roof, HVAC, electrical panel, plumbing, and water heater last replaced?
- What's the actual annual flood-insurance premium (NFIP or private), and is the property in a SFHA with mandatory coverage?
- Why hasn't it sold? Are there any deal-killer items the seller is aware of (foundation, flood, title, zoning, code violations)?
- Is there a deadline driving the sale (1031 exchange, divorce, estate, relocation)? That informs how much negotiation room exists.
- Crime grade is F in this area — have there been break-ins, vandalism, or insurance claims at this property in the last 3 years? What carrier currently insures it and at what premium?
- What's the average days-on-market for RENTAL listings here right now (not sales)? A rising rental-DOM trend means longer vacancies and softer asking-rent achievability than the comps imply.
- What's the recent tenant-quality profile in this submarket — average credit score on applications, eviction rate, late-payment / NSF rate, and stable-employment percentage? A property-management company in the area should have these aggregated.
- How much new for-sale + rental construction is in the pipeline within 1–3 miles? Heavy new supply typically softens prices + rents 12–24 months out; constrained supply supports both.
Investment metrics
- 1% rule
- 1.98% ✓
- Cap rate
- 17.31%
- Cash-on-cash
- 39.35%
- DSCR
- 2.75
- GRM
- 4.2
CMA / ARV
No comps found within radius.
Projected returns pro-forma
4.95% appreciation · 3.0% rent growth · sell at horizon
- IRR
- 41.2%
- Equity multiple
- 3.53×
- Total profit
- $28,315
- Equity at exit
- $22,554
- IRR
- 39.3%
- Equity multiple
- 7.18×
- Total profit
- $69,167
- Equity at exit
- $38,832
Cash invested: $11,200 (down + closing). Projections, not guarantees.
Landlord ↔ Tenant lean methodology
- Overall (STATE)
- 28 Tenant-Leaning
- State Washington
- 28 Tenant-Leaning · D+8
- County
- — inherits STATE
- City
- — inherits STATE
ZIP-level market 99157
- Home prices YoY
- 2.0%
- Active inventory
- 25
- Price-to-rent
- 4.2×
Monthly cashflow live
- Estimated rent
- $791 medium interval (Pro) →
- Mortgage (P&I)
- −$210
- Tax from tax record
- −$31 /mo · $370/yr
- Insurance
- −$17
- Flood insurance flood zone
- −$66 /mo · $798/yr
- HOA
- −$0
- Vacancy / Maint / Mgmt
- −$166
- Net cashflow
- $301
Break-even live
UW: 25.0% down · 7.5% · 30yr · 1.5% tax · 5.0% vac · 8.0% maint · 8.0% mgmt
Financing live
Cash to close
- Down payment
- $10,000
- Closing costs
- $1,200
- Reserves months
- —
- Total cash needed
- —
Loan-product check · same deal, 3 products live
Conventional
25% down · 7.5% · 30yr
- Down + closing
- —
- Monthly P&I
- —
- Monthly cashflow
- —
- DSCR
- —
- Eligible?
- —
Personal DTI + credit; lowest rate.
DSCR
20% down · 8.5% · 30yr
- Down + closing
- —
- Monthly P&I
- —
- Monthly cashflow
- —
- DSCR
- —
- Eligible?
- —
No personal income docs; deal must DSCR.
Hard money
10% down · 12.0% · 12mo
- Down + closing
- —
- Monthly P&I
- —
- Monthly cashflow
- —
- DSCR
- —
- Eligible?
- —
Short-term bridge; refi at stabilization.
Listing history 18 events
-
2026-06-18days on market $40,000 Active 265 DOM
-
2026-06-17days on market $40,000 Active 264 DOM
-
2026-06-16days on market $40,000 Active 263 DOM
-
2026-06-15days on market $40,000 Active 262 DOM
-
2026-06-15days on market $40,000 Active 261 DOM
-
2026-06-13days on market $40,000 Active 260 DOM
-
2026-06-12days on market $40,000 Active 259 DOM
-
2026-06-09days on market $40,000 Active 256 DOM
-
2026-06-08days on market $40,000 Active 255 DOM
-
2026-06-08days on market $40,000 Active 254 DOM
-
2026-06-05days on market $40,000 Active 252 DOM
-
2026-06-03days on market $40,000 Active 250 DOM
-
2026-06-02days on market $40,000 Active 249 DOM
-
2026-06-01days on market $40,000 Active 248 DOM
-
2026-05-31days on market $40,000 Active 247 DOM
-
2026-04-28price $40,000
-
2026-02-24price $50,000
-
2025-09-26$60,000 Active
ⓘ Source: listings_history table (triggers on properties + properties_extension) + one-shot
backfill from property_details.listing_events for pre-trigger history.
Tax reassessment forecast WA · Resets to sale price
- Current annual tax
- $370 · $31/mo
- Projected year-2 tax
- $392 · $33/mo
- Expected delta
- +$22/yr (+$2/mo · 6.0%)
ⓘ Screening estimate from a state-policy table — verify with the county assessor before closing.
Climate risk First Street
- Flood 8/10 Severe FEMA zone X · 78% chance over 30 yrs
- Wildfire 6/10 Major
- Heat 4/10 Moderate 8 d/yr ≥92°F today · 18 d/yr by 30 yrs out
- Wind 1/10 Low
- Air quality 10/10 Extreme 21 unhealthy d/yr today · 23 by 30 yrs out
Nearby sold comps map
Loading sold comps map…
Walkable amenities ~0.75 mi
Loading nearby amenities…
Taxation est. · year 1
- Rental income
- $9,487
- − Mortgage interest
- −$2,241
- − Property taxes
- −$370
- − Insurance
- −$998
- − Repairs & maintenance
- −$759
- − Management
- −$759
- − Depreciation
- −$1,164
- Taxable income
- $3,197
- Est. tax owed @ 24.0%
- −$767
- After-tax cash flow
- $2,843/yr
For passive investors: Depreciation is non-cash, so a rental often shows a tax loss while cash-flowing — sheltering income. Rental losses are passive: they offset passive income freely, and up to $25,000/yr can offset ordinary (W-2) income if you actively participate and your MAGI is under $100k (phasing out to $0 by $150k); unused losses carry forward. On sale, claimed depreciation is recaptured at up to 25%, and gains may owe capital-gains tax (a 1031 exchange can defer both). Figures are a year-1 estimate at your 24.0% rate — not tax advice; consult a CPA.
Schools (NCES district)
- District
- Northport School District
- NCES district ID
- 5305880
- Math proficiency
- 50% ▲ 10.00%
- Reading proficiency
- 60% ▼ -5.00%
- Median HH income
- $31,668
- Composite
- 46.98/100
- National rank
- #5150
- State rank
- #121 of 291 in WA
Livability — Northport
- Score
- 58/100
- State rank
- #518
- US rank
- #21474
Category grades
Schools grade is shown separately in the Schools card above.
Census & demographics
- Census place
- Northport, WA
- Population (ZIP)
- 719
Population outlook (Stevens County) Hauer SSP2
- Today (2025)
- 43,696 people
- By 2030
- 43,203 · -1.1%
- By 2040
- 41,190 · -5.7%
- By 2050
- 38,231 · -12.5%
- By 2075
- 31,260 · -28.5%
- By 2100
- 22,931 · -47.5%
Race, ethnicity, and origin ACS 2023
- Neighborhood character
- Predominantly White (93%)
- Race & ethnicity
- White 93% Two or more races 4% Hispanic / Latino 3% Asian 2%
- Common ancestry
- Slovak 7% Portuguese 6% Serbian 3%
- Foreign-born
- 1% · Canada
- Languages at home
- 99% English-only · Spanish 1% Other Asian/Pacific 1%
Political lean MEDSL · Stevens
- 2024 margin
- Solid R (+44.1) · D 26.7% · R 70.8% · Other 2.5%
- 2008→2024 swing
- -23.4pp toward R · 2008: -20.7pp · 2024: -44.1pp
- All cycles
- 2024: R+44.1 2020: R+42.1 2016: R+40.8 2012: R+27.7 2008: R+20.7
Not yet ingested
- Civics
- —
Market trends
- HPI YoY
- ▲ 4.95%
- Current HPI
- 246.5781
- Rent YoY
- —
- Metro
- —
- State GDP YoY
- ▲ 4.65%
- F500 in state
- 22
Industry mix (Fortune 500 HQ in WA)
| Industry | F500 HQs | Revenue |
|---|---|---|
| Retail | 2 | $269B |
|
||
| Technology / Retail | 1 | $638B |
|
||
| Technology | 1 | $245B |
|
||
| Telecommunications | 1 | $38B |
|
||
| Food / Beverage | 1 | $36B |
|
||
| Automotive / Trucks | 1 | $34B |
|
||
Price history
-33.3% since first listed3 events — show timeline
- 2026-04-28 Price Changed $40,000 NWMLS as Distributed by MLS Grid
- 2026-02-24 Price Changed $50,000 NWMLS as Distributed by MLS Grid
- 2025-09-26 Listed $60,000 NWMLS as Distributed by MLS Grid
Property tax history
+1.3%/yrLatest (2026): $370 · -2.9% YoY. Source: county tax records.
Cash-flow waterfall
monthlySold comps — $/sqft
last 12 mo · ≤1 miLoading sold comps…