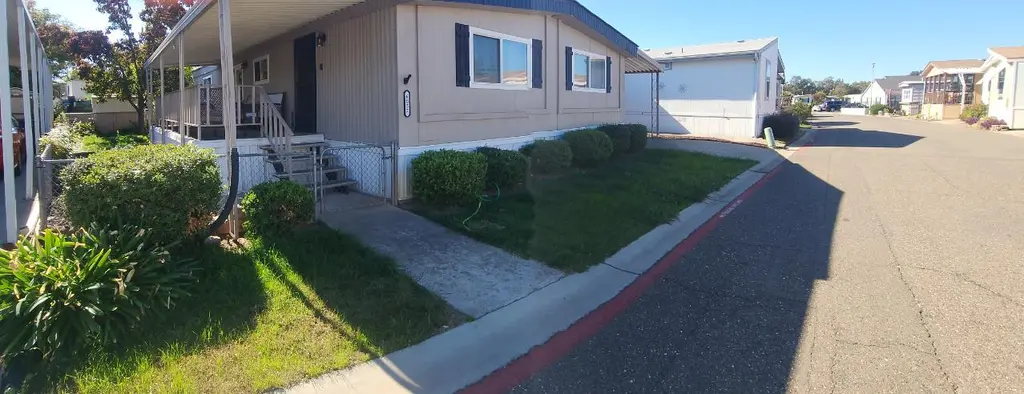
6057 Declaration Cir · Citrus Heights, CA
Flood risk 5/10 · Moderate
- FEMA flood zone
- X (unshaded)
- Chance of flooding over 30 yrs
- 0.32%
- Est. flood insurance / yr
- $507 – $1,088
Fire risk 1/10 · Minimal
- Est. fire insurance / yr
- $659 – $1,223
Heat risk 7/10 · Major
- Hot days now (above 102°F)
- 7 days/yr
- Hot days in 30 yrs
- 16 days/yr
Wind risk 1/10 · Minimal
- Chance of severe wind over 30 yrs
- —
Air-quality risk 10/10 · Severe
- Unhealthy air days now
- 34 days/yr
- Unhealthy air days in 30 yrs
- 36 days/yr
Risk factors via First Street. Map © Google.
Why this score? — see what drove the B+ grade
The composite is a weighted blend of 9 inputs, each scored 0–100. Each bar is that input's sub-score; the figure is the points it added to the 100-point composite (weight × sub-score).
- Cash flow +30.0/30.0
- ARV discount +15.0/15.0
- 1% rule +10.0/10.0
- DSCR +10.0/10.0
- Schools +4.4/10.0
- Rent growth +3.0/5.0
- Livability +3.0/5.0
- Condition / age +2.5/5.0
- Appreciation +0.0/10.0
$99,000
🖨 Deal sheet (PDF) 📄 Offer letter ✓ Due diligence
Listing remarks
Welcome Home! This SPACIOUS 2 Bed/2 Full Bath, located in the desirable all-age community of Creekside Estates features a fully Fenced and Gated Lot Space with a most delicious Orange Tree, Large Bedrooms, Open Kitchen with Island, Family Room, Living Room, Dining Room, Laundry Room with Jack-n-Jill Bathroom providing for a 2nd Master Bedroom, Storage Shed, Energy Efficient Dual Pane Windows, and more. Refrigerator, Gas Range, Washer/Dryer included. Enjoy the Pool, Clubhouse, Playground, and more! This Open and Spacious Floorplan and convenient location near shopping, entertainment, and freeway access makes this the perfect place. Welcome Home! Financing Available.
Key facts
- Clubhouse
- Community garden
- Pool
Tags
Neighborhood map
What this means for you Summary
Snapshot
- This is a 2-bed/2.0-bath manufactured listed at $99k.
Deal economics
- At list price, monthly cash flow is $922 ($11k/yr) — positive.
- The deal already cash-flows at list — no discount required.
- Meets the 1% rule at list price ($2k rent vs $99k).
- Recommended offer: $87k (12.0% below list) — sets the bar for market timing.
- Cap rate 17.5% vs local median 3.4% in Citrus Heights — top-decile yield for the area; either an underpriced asset or a hidden risk that comps aren't pricing in. Stress-test before assuming the spread holds.
Location & tenants
- Location reads 60/100 on livability (#614 in CA) — a middle-class / working-renter tenant base. Strengths: housing A+; Watch: schools D, crime D-, amenities F.
- San Juan Unified (suburban): math 40% / reading 62% proficiency, ranked #138 of 517 in CA (top 27%) — acceptable for families but not a draw, mixed tenant base, ~2y average lease.
- Market conditions: Rents rising (+1.9%/yr); 219 active listings in the ZIP; 40 comparable units currently listed for rent nearby; rentals at typical pace (median 19d on market — plan ~3-4 weeks tenant-placement turnaround); solid renter incomes; 6,825 units permitted in Sacramento County in 2024 (1,752 in 5+ unit buildings).
- This rent runs 30% of the median local income ($81k/yr) — at the standard rent-burdened threshold; future hikes will face affordability resistance.
Forward outlook
- Local home prices are declining (-3.0%/yr); year-one equity from $684 of loan paydown is wiped out by about $3k of value loss. Plan a longer hold.
- Sacramento County population projected at +17% by 2050 — long-run rental-demand tailwind backs the buy-and-hold thesis.
- At projected returns (-3.0% appreciation + 1.9% rent growth), your $28k cash investment doubles in ~4 years — after that, you're playing with house money.
Negotiation context
- It's been on market 211 days — a 12% lower offer ($87k) is reasonable based on typical stale-listing flexibility.
Risks & watch-outs
- Climate carrying-cost: moderate flood risk; extreme-heat days projected 7→16/yr by 2055 (HVAC capex compounding) — expect insurance premiums to compound above CPI over the hold.
Questions for the listing agent
- It's been on market 211 days. Have you received any prior offers? Is the seller open to a 12% concession, seller financing, or rate buy-down credit?
- Built in 1977 — when were the roof, HVAC, electrical panel, plumbing, and water heater last replaced?
- Why hasn't it sold? Are there any deal-killer items the seller is aware of (foundation, flood, title, zoning, code violations)?
- Is there a deadline driving the sale (1031 exchange, divorce, estate, relocation)? That informs how much negotiation room exists.
- Schools are D-rated, which usually means shorter tenancies and higher turnover. Who's the typical renter profile here, and what's been the actual vacancy rate?
- Crime grade is D in this area — have there been break-ins, vandalism, or insurance claims at this property in the last 3 years? What carrier currently insures it and at what premium?
- What's the average days-on-market for RENTAL listings here right now (not sales)? A rising rental-DOM trend means longer vacancies and softer asking-rent achievability than the comps imply.
- What's the recent tenant-quality profile in this submarket — average credit score on applications, eviction rate, late-payment / NSF rate, and stable-employment percentage? A property-management company in the area should have these aggregated.
- How much new for-sale + rental construction is in the pipeline within 1–3 miles? Heavy new supply typically softens prices + rents 12–24 months out; constrained supply supports both.
Investment metrics
- 1% rule
- 2.05% ✓
- Cap rate
- 17.47%
- Cash-on-cash
- 39.90%
- DSCR
- 2.78
- GRM
- 4.1
CMA / ARV
- ARV (median comp)
- $131,468
- List price
- $99,000
- Delta
- -24.70%
- Verdict
- UNDERPRICED
- Comps
- 20 within 1.0 mi
Show comp detail 12 sales within ~0.75 mi
| Address | Dist | Beds/Ba | Sqft | Sold | Price | $/sf | Match |
|---|---|---|---|---|---|---|---|
| 6226 Gettysburg Ln #14 | 0.08mi | 2/2.0 | 1,144 (-1%) | 14mo | $155,000 | $135 | 84 |
| 6213 Plymouth Rock Ln #100 | 0.09mi | 2/2.0 | 1,200 (+4%) | 14mo | $119,000 | $99 | 78 |
| 6625 Galaxy Ct | 0.47mi | 2/2.0 | 1,146 (-0%) | 2mo | $155,000 | $135 | 76 |
| 6212 Gettysburg Ln #90 | 0.10mi | 2/2.0 | 1,270 (+10%) | 14mo | $139,000 | $109 | 67 |
| 6036 Declaration Cir | 0.04mi | 3/2.0 (+1) | 1,262 (+10%) | 13mo | $142,995 | $113 | 67 |
| 6223 Lurline Ave | 0.30mi | 2/2.0 | 1,248 (+8%) | 9mo | $75,000 | $60 | 65 |
| 5740 Clearwater Dr #28 | 0.31mi | 2/2.0 | 1,248 (+8%) | 10mo | $74,900 | $60 | 64 |
| 6621 Grosse Point Ct | 0.47mi | 2/2.0 | 1,248 (+8%) | 1mo | $130,000 | $104 | 64 |
| 6230 Calgary | 0.32mi | 2/2.0 | 1,040 (-10%) | 9mo | $64,000 | $62 | 62 |
| 6105 Mame Ct | 0.50mi | 3/2.0 (+1) | 1,248 (+8%) | 3mo | $85,000 | $68 | 55 |
| 6625 Shamus Ct | 0.46mi | 3/2.0 (+1) | 1,248 (+8%) | 8mo | $190,000 | $152 | 53 |
| 6728 Kate Ln | 0.62mi | 2/2.0 | 1,248 (+8%) | 12mo | $135,000 | $108 | 48 |
Match score weights: distance 35% · size 25% · config 20% · recency 20%. Top-matched comps best support the ARV.
Projected returns pro-forma
-3.0% appreciation · 1.9% rent growth · sell at horizon
- IRR
- 35.0%
- Equity multiple
- 2.46×
- Total profit
- $40,467
- Equity at exit
- $14,761
- IRR
- 41.2%
- Equity multiple
- 4.68×
- Total profit
- $102,021
- Equity at exit
- $8,560
Cash invested: $27,720 (down + closing). Projections, not guarantees.
Landlord ↔ Tenant lean methodology
- Overall (STATE)
- 18 Strongly Tenant-Friendly
- State California
- 18 Strongly Tenant-Friendly · D+13
- County
- — inherits STATE
- City
- — inherits STATE
ZIP-level market 95621
- Rents YoY
- 1.9%
- Active inventory
- 219
- Price-to-rent
- 4.1×
Monthly cashflow live
- Estimated rent
- $2,033 high interval (Pro) →
- Mortgage (P&I)
- −$519
- Tax est. 1.5%
- −$124 /mo · $1,485/yr
- Insurance
- −$41
- HOA
- −$0
- Vacancy / Maint / Mgmt
- −$427
- Net cashflow
- $922
Break-even live
Sensitivity live
| Price | -10% $990 | -5% $956 | +0% $922 | +5% $887 | +10% $853 |
|---|---|---|---|---|---|
| Rent | -10% $761 | -5% $841 | +0% $922 | +5% $1,002 | +10% $1,082 |
| Rate | -1.0pp $972 | -0.5pp $947 | base $922 | +0.5pp $896 | +1.0pp $870 |
UW: 25.0% down · 7.5% · 30yr · 1.5% tax · 5.0% vac · 8.0% maint · 8.0% mgmt
Financing live
Cash to close
- Down payment
- $24,750
- Closing costs
- $2,970
- Reserves months
- —
- Total cash needed
- —
Loan-product check · same deal, 3 products live
Conventional
25% down · 7.5% · 30yr
- Down + closing
- —
- Monthly P&I
- —
- Monthly cashflow
- —
- DSCR
- —
- Eligible?
- —
Personal DTI + credit; lowest rate.
DSCR
20% down · 8.5% · 30yr
- Down + closing
- —
- Monthly P&I
- —
- Monthly cashflow
- —
- DSCR
- —
- Eligible?
- —
No personal income docs; deal must DSCR.
Hard money
10% down · 12.0% · 12mo
- Down + closing
- —
- Monthly P&I
- —
- Monthly cashflow
- —
- DSCR
- —
- Eligible?
- —
Short-term bridge; refi at stabilization.
Rent comps 40 comps
| Address | Beds | Baths | Sqft | Rent | $/sqft | DOM | Units | Dist |
|---|---|---|---|---|---|---|---|---|
| 6011 Shadow Ln Citrus Heights, CA | 1.0–2.0 | 1.0–2.0 | 779 | $2,348 | $3.01 | 2d | 15 | 0.23mi |
| 6219 Oak Valley Ln Citrus Heights, CA | 3.0 | 3.0 | 1304 | $2,295 | $1.76 | 18d | 1 | 0.25mi |
| 6219 Oak Valley Ln Citrus Heights, CA | 3.0 | 2.5 | 1304 | $2,295 | $1.76 | 44d | 1 | 0.25mi |
| 6203 Ackland Ct Citrus Heights, CA | 3.0 | 1.5 | 1322 | $2,500 | $1.89 | 24d | 1 | 0.35mi |
| 5979 Devecchi Ave Citrus Heights, CA | 1.0–2.0 | 1.0–2.0 | 775 | $1,871 | $2.41 | 2d | 15 | 0.36mi |
| 6104 Rockport Ln Citrus Heights, CA | 3.0 | 2.5 | 1150 | $2,295 | $2.00 | 23d | 1 | 0.38mi |
| 6430 Verner Ave Sacramento, CA | 1.0–2.0 | 1.0–2.0 | 705 | $2,295 | $3.25 | 24d | 1 | 0.51mi |
| 6245 Longford Dr #3 Citrus Heights, CA | 2.0 | 1.0 | 840 | $1,395 | $1.66 | 24d | 1 | 0.52mi |
| 5844 Garden Park Ct Unit RV 5853-D Carmichael, CA | 2.0 | 1.0 | 915 | $1,525 | $1.67 | 17d | 1 | 0.54mi |
| 5844 Garden Park Ct Unit RV 5877-B Carmichael, CA | 2.0 | 1.0 | 915 | $1,575 | $1.72 | 17d | 1 | 0.54mi |
| 6228 Longford Dr #3 Citrus Heights, CA | 2.0 | 1.0 | 840 | $1,595 | $1.90 | 18d | 1 | 0.55mi |
| 5718 Manzanita Ave Carmichael, CA | 2.0 | 1.0 | 980 | $2,000 | $2.04 | 44d | 1 | 0.61mi |
| 6544 Auburn Blvd Citrus Heights, CA | 2.0 | 2.0 | 800 | $1,850 | $2.31 | 24d | 1 | 0.63mi |
| 6533 Greenback Ln #3 Citrus Heights, CA | 2.0 | 1.0 | 840 | $1,800 | $2.14 | 24d | 1 | 0.66mi |
| 5922 Petaluma Ct Sacramento, CA | 2.0 | 2.0 | 1048 | $2,075 | $1.98 | 2d | 1 | 0.71mi |
| 6558 Meadowcreek Way Citrus Heights, CA | 3.0 | 2.0 | 1304 | $2,500 | $1.92 | 44d | 1 | 0.79mi |
| 6546 Auburn Blvd Citrus Heights, CA | 2.0 | 1.0 | 624 | $1,853 | $2.97 | 5d | 10 | 0.81mi |
| 5840 Garfield Ave Sacramento, CA | 2.0 | 1.0 | 850 | $1,545 | $1.82 | 2d | 2 | 0.81mi |
| 6687 Greenback Ln Citrus Heights, CA | 3.0 | 2.0 | 1323 | $2,495 | $1.89 | 18d | 1 | 0.83mi |
| 5417 Olympic Way Sacramento, CA | 2.0 | 1.0 | 920 | $1,795 | $1.95 | 15d | 1 | 0.84mi |
| 5587 Keoncrest Cir Unit 2 Sacramento, CA | 2.0 | 1.5 | 900 | $2,000 | $2.22 | 2d | 1 | 0.84mi |
| 5501 Keoncrest Cir Unit 1 Sacramento, CA | 2.0 | 1.0 | 750 | $1,300 | $1.73 | 2d | 1 | 0.88mi |
| 6319 Misty Wood Way Citrus Heights, CA | 3.0 | 2.0 | 1454 | $2,500 | $1.72 | 44d | 1 | 1.00mi |
| 5233 Calistoga Way Sacramento, CA | 3.0 | 2.0 | 1200 | $2,495 | $2.08 | 2d | 1 | 1.01mi |
| 6225 Wildomar Way Carmichael, CA | 3.0 | 1.0 | 1040 | $3,000 | $2.88 | 44d | 1 | 1.02mi |
| 5402 Mona Way Sacramento, CA | 2.0 | 1.0 | 863 | $1,750 | $2.03 | 23d | 1 | 1.10mi |
| 6004 Rutland Dr Unit 128 Carmichael, CA | 2.0 | 1.0 | 900 | $1,495 | $1.66 | 5d | 1 | 1.13mi |
| 5308 Winfield Way #2 Sacramento, CA | 3.0 | 1.5 | 1105 | $2,100 | $1.90 | 44d | 1 | 1.22mi |
| 5109 Andrea Blvd Sacramento, CA | 2.0 | 1.0 | 828 | $1,769 | $2.14 | 2d | 2 | 1.24mi |
| 5300 Winfield Way #2 Sacramento, CA | 3.0 | 1.5 | 1105 | $2,100 | $1.90 | 24d | 1 | 1.24mi |
| 7024 San Altos Cir Citrus Heights, CA | 2.0 | 2.0 | 1120 | $2,800 | $2.50 | 44d | 1 | 1.26mi |
| 6841 Concert Way Sacramento, CA | 2.0 | 2.0 | 1000 | $1,995 | $2.00 | 2d | 1 | 1.29mi |
| 5244 Hackberry Ln Sacramento, CA | 2.0 | 1.0 | 712 | $1,712 | $2.41 | 44d | 1 | 1.29mi |
| 5425 Garfield Ave Sacramento, CA | 1.0–2.0 | 1.0–2.0 | 787 | $1,650 | $2.10 | 21d | 5 | 1.31mi |
| 7120 Van Maren Ln Citrus Heights, CA | 3.0 | 2.0 | 1292 | $2,495 | $1.93 | 18d | 1 | 1.36mi |
| 5322 Hemlock St Sacramento, CA | 1.0–2.0 | 1.0 | 800 | $1,875 | $2.34 | 3d | 2 | 1.37mi |
| 5233 Columbine Way Carmichael, CA | 3.0 | 2.0 | 1008 | $2,375 | $2.36 | 5d | 1 | 1.37mi |
| 5500 Foothill Garden Ct Sacramento, CA | 1.0 | 1.0 | 750 | $1,472 | $1.96 | 3d | 2 | 1.40mi |
| 6200 Osullivan Ln Sacramento, CA | 2.0 | 2.0 | 1316 | $1,775 | $1.35 | 8d | 1 | 1.41mi |
| 6172 Peoria Dr Citrus Heights, CA | 2.0 | 1.0 | 917 | $1,695 | $1.85 | 5d | 1 | 1.41mi |
Climate risk First Street
- Flood 5/10 Major FEMA zone X (unshaded) · 32% chance over 30 yrs
- Wildfire 1/10 Low
- Heat 7/10 Severe 7 d/yr ≥102°F today · 16 d/yr by 30 yrs out
- Wind 1/10 Low
- Air quality 10/10 Extreme 34 unhealthy d/yr today · 36 by 30 yrs out
Nearby sold comps map
Loading sold comps map…
Walkable amenities ~0.75 mi
Loading nearby amenities…
Taxation est. · year 1
- Rental income
- $24,393
- − Mortgage interest
- −$5,546
- − Property taxes
- −$1,485
- − Insurance
- −$495
- − Repairs & maintenance
- −$1,951
- − Management
- −$1,951
- − Depreciation
- −$2,880
- Taxable income
- $10,085
- Est. tax owed @ 24.0%
- −$2,420
- After-tax cash flow
- $8,640/yr
For passive investors: Depreciation is non-cash, so a rental often shows a tax loss while cash-flowing — sheltering income. Rental losses are passive: they offset passive income freely, and up to $25,000/yr can offset ordinary (W-2) income if you actively participate and your MAGI is under $100k (phasing out to $0 by $150k); unused losses carry forward. On sale, claimed depreciation is recaptured at up to 25%, and gains may owe capital-gains tax (a 1031 exchange can defer both). Figures are a year-1 estimate at your 24.0% rate — not tax advice; consult a CPA.
Schools (NCES district)
- District
- San Juan Unified
- NCES district ID
- 0634620
- Math proficiency
- 40% ▲ 3.00%
- Reading proficiency
- 62% ▲ 16.00%
- Median HH income
- $55,655
- Composite
- 44.07/100
- National rank
- #2878
- State rank
- #138 of 517 in CA
Livability — Citrus Heights
- Score
- 60/100
- State rank
- #614
- US rank
- #19580
Category grades
Schools grade is shown separately in the Schools card above.
Census & demographics
- Census place
- Citrus Heights, CA
- County
- Sacramento County · 1,539,646 people
- City population
- 89,370
- Metro
- Sacramento-Roseville-Folsom, CA
- Population (ZIP)
- 42,442
- Household income
- $80,901
- Rent vs Own
- Severe rent burden
- 1854.0
Population outlook (Sacramento County) Hauer SSP2
- Today (2025)
- 1,660,763 people
- By 2030
- 1,732,990 · +4.3%
- By 2040
- 1,855,755 · +11.7%
- By 2050
- 1,941,335 · +16.9%
- By 2075
- 2,046,162 · +23.2%
- By 2100
- 1,961,444 · +18.1%
Race, ethnicity, and origin ACS 2023
- Neighborhood character
- Predominantly White (66%)
- Race & ethnicity
- White 66% Hispanic / Latino 19% Two or more races 11% Asian 6% Black 2%
- Hispanic origin (detail)
- Mexican 16%
- Common ancestry
- Subsaharan African 3% Lithuanian 3% Scotch-Irish 2%
- Foreign-born
- 15% · Canada, Vietnam
- Languages at home
- 78% English-only · Spanish 10% Russian/Polish/Slavic 6% Other Indo-European 3%
Political lean MEDSL · Sacramento
- 2024 margin
- D (+19.7) · D 58.1% · R 38.4% · Other 3.5%
- 2008→2024 swing
- +0.7pp no change · 2008: 19.0pp · 2024: 19.7pp
- All cycles
- 2024: D+19.7 2020: D+25.3 2016: D+23.7 2012: D+16.3 2008: D+19.0
Not yet ingested
- Civics
- —
Market trends
- HPI YoY
- ▼ -408.14%
- Current HPI
- 351.9333
- Rent YoY
- ▲ 1.90%
- Metro
- Sacramento-Roseville-Folsom, CA
- State GDP YoY
- ▲ 3.21%
- F500 in state
- 116
Industry mix (Fortune 500 HQ in CA)
| Industry | F500 HQs | Revenue |
|---|---|---|
| Technology | 27 | $1,492B |
|
||
| Financial Services | 3 | $174B |
|
||
| Retail | 3 | $44B |
|
||
| Insurance | 3 | $26B |
|
||
| Media / Entertainment | 2 | $115B |
|
||
| Pharmaceuticals / Biotech | 2 | $62B |
|
||
Cash-flow waterfall
monthlySold comps — $/sqft
last 12 mo · ≤1 miLoading sold comps…