 🏷️ Likely Rental
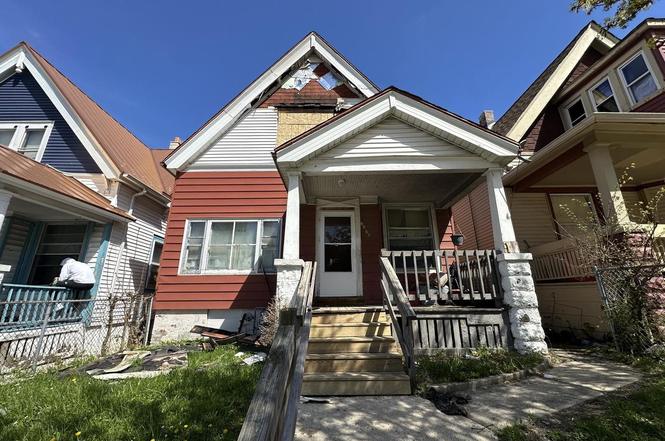
3320 N 3rd St · Milwaukee, WI
Flood risk 1/10 · Minimal
- FEMA flood zone
- X (unshaded)
- Chance of flooding over 30 yrs
- 0.0%
- Est. flood insurance / yr
- $473 – $860
Fire risk 1/10 · Minimal
- Est. fire insurance / yr
- $636 – $1,182
Heat risk 2/10 · Minimal
- Hot days now (above 98°F)
- 7 days/yr
- Hot days in 30 yrs
- 13 days/yr
Wind risk 2/10 · Minimal
- Chance of severe wind over 30 yrs
- —
Air-quality risk 3/10 · Minor
- Unhealthy air days now
- 3 days/yr
- Unhealthy air days in 30 yrs
- 4 days/yr
Risk factors via First Street. Map © Google.
Why this score? — see what drove the D grade
The composite is a weighted blend of 9 inputs, each scored 0–100. Each bar is that input's sub-score; the figure is the points it added to the 100-point composite (weight × sub-score).
- Cash flow +15.0/30.0
- ARV discount +7.5/15.0
- 1% rule +5.0/10.0
- DSCR +5.0/10.0
- Livability +4.0/5.0
- Rent growth +3.8/5.0
- Condition / age +2.5/5.0
- Schools +1.2/10.0
- Appreciation +0.0/10.0
$31,000
🖨 Deal sheet (PDF) 📄 Offer letter ✓ Due diligence
Listing remarks MLS
Great investment opportunity. Newer furnace and hot water heater. Room measurements are approximate, . Cap rate for the first year is an amazing 16.5%, The rent is $950.00 on a month to month lease, the tenants also pay all utilities including water. The current tenants are excellent renters with on time payments for two years.
Key facts
- 4,356 sq ft lot
- Built 1905
- Listed 4 days
Property features AI
Finance
- Other: All items left behind at the time of closing are included
Exterior
- Utilities: Municipal water
- Home design: 1.5-story single-family home; Less than 1/2 acre lot (approx. 0.1 acre); Zoned RT4
- Construction: Information source for year built: Assessor/Public Record
- Exterior features: Aluminum / Aluminum or steel exterior
Interior
- Kitchen: Kitchen on main level, approximately 11 x 10; Appliances: Other
- Bedrooms: Primary bedroom on main level, approximately 12 x 13; Second bedroom on upper level, approximately 12 x 13; Third bedroom on upper level, approximately 10 x 9; Fourth bedroom on upper level, approximately 10 x 8
- Bathrooms: One full bathroom; One half bathroom
- Heating & cooling: Radiant/hot water heating; Natural gas fuel
- Interior features: Full basement
- Laundry & utility: Radiant/hot water heating (natural gas)
Neighborhood map
What this means for you Summary
Snapshot
- This is a 4-bed/1.0-bath single-family listed at $31k.
Deal economics
- At list price, monthly cash flow is $1k ($12k/yr) — positive.
- The deal already cash-flows at list — no discount required.
- Meets the 1% rule at list price ($2k rent vs $31k).
- Cap rate 45.5% vs local median 5.1% in Milwaukee — top-decile yield for the area; either an underpriced asset or a hidden risk that comps aren't pricing in. Stress-test before assuming the spread holds.
Location & tenants
- Location reads 81/100 on livability (#55 in WI, #1,534 nationally) — a professional / high-income tenant draw. Strengths: amenities A+, commute A+, cost of living A+; Watch: employment D+, schools F, crime F.
- Milwaukee School District (urban): math 10% / reading 18% proficiency, ranked #337 of 342 in WI (top 98%) — low school quality limits family demand, transient renter base, plan for 1-2y turnover; 77% free/reduced lunch — lower-income household profile, screen leases tightly.
- Market conditions: Rents rising fast (+5.0%/yr); 131 active listings in the ZIP; 18 comparable units currently listed for rent nearby; rentals at typical pace (median 25d on market — plan ~3-4 weeks tenant-placement turnaround); 1,017 units permitted in Milwaukee County in 2024 (803 in 5+ unit buildings).
- This rent runs 42% of the median local income ($47k/yr) — at the standard rent-burdened threshold; future hikes will face affordability resistance.
Forward outlook
- Local home prices are declining (-3.0%/yr); year-one equity from $214 of loan paydown is wiped out by about $930 of value loss. Plan a longer hold.
- Milwaukee County population projected at +4% by 2050 — modest demand growth; plan on rents tracking national, not racing it.
- At projected returns (-3.0% appreciation + 5.0% rent growth), your $9k cash investment doubles in ~1 year — after that, you're playing with house money.
Negotiation context
- Only 5 days on market — expect competitive offers; lowballing is unlikely to land.
- 4 sale attempts since 12y ago with the ask held roughly flat each time — persistent listings suggest the price (not the market) is what's stuck; bring a comps-based counter.
Risks & watch-outs
- Watch-outs: property tax is 4.4% of price; built in 1905 — expect roof / HVAC / electrical / plumbing capex.
Questions for the listing agent
- Built in 1905 — when were the roof, HVAC, electrical panel, plumbing, and water heater last replaced?
- Property tax is high relative to price — has the assessment been appealed recently, and will the sale trigger a re-assessment?
- Is there a deadline driving the sale (1031 exchange, divorce, estate, relocation)? That informs how much negotiation room exists.
- Schools are F-rated, which usually means shorter tenancies and higher turnover. Who's the typical renter profile here, and what's been the actual vacancy rate?
- Crime grade is F in this area — have there been break-ins, vandalism, or insurance claims at this property in the last 3 years? What carrier currently insures it and at what premium?
- The area grade is low — what's the realistic commute time and amenity access for the typical tenant pool here? Any planned neighborhood developments (good or bad) we should know about?
- What's the average days-on-market for RENTAL listings here right now (not sales)? A rising rental-DOM trend means longer vacancies and softer asking-rent achievability than the comps imply.
- What's the recent tenant-quality profile in this submarket — average credit score on applications, eviction rate, late-payment / NSF rate, and stable-employment percentage? A property-management company in the area should have these aggregated.
- How much new for-sale + rental construction is in the pipeline within 1–3 miles? Heavy new supply typically softens prices + rents 12–24 months out; constrained supply supports both.
Investment metrics
- 1% rule
- 5.31% ✓
- Cap rate
- 45.47%
- Cash-on-cash
- 139.92%
- DSCR
- 7.23
- GRM
- 1.6
CMA / ARV
- ARV (on-the-fly)
- $195,960
- Comps found
- 12
Show comp detail 12 sales within ~0.75 mi
| Address | Dist | Beds/Ba | Sqft | Sold | Price | $/sf | Match |
|---|---|---|---|---|---|---|---|
| 3234 N Achilles St | 0.24mi | 4/1.5 | 1,645 (-4%) | 1mo | $105,000 | $64 | 80 |
| 3279 N Dr William Finlayson St | 0.20mi | 4/2.0 | 1,504 (-12%) | 1mo | $202,500 | $135 | 67 |
| 3206 N 12th St | 0.65mi | 4/1.0 | 1,710 (+0%) | 3mo | $25,800 | $15 | 66 |
| 3421 N Fratney St | 0.61mi | 4/2.5 | 1,680 (-1%) | 1mo | $385,000 | $229 | 62 |
| 3033 N Holton St | 0.56mi | 3/1.0 (-1) | 1,652 (-3%) | 2mo | $124,000 | $75 | 62 |
| 3766 N Vel R Phillips Ave | 0.41mi | 4/3.0 | 1,621 (-5%) | 4mo | $129,000 | $80 | 61 |
| 3558 N 11th St | 0.61mi | 5/1.5 (+1) | 1,656 (-3%) | 5mo | $150,000 | $91 | 56 |
| 3230 N 12th St | 0.64mi | 5/1.0 (+1) | 1,762 (+3%) | 4mo | $140,000 | $79 | 56 |
| 3783 N 9th St | 0.65mi | 4/2.0 | 1,562 (-8%) | 2mo | $220,000 | $141 | 50 |
| 3480 N Bremen St | 0.71mi | 4/1.5 | 1,524 (-11%) | 4mo | $186,500 | $122 | 43 |
| 615 E Chambers St | 0.69mi | 3/1.5 (-1) | 1,540 (-10%) | 6mo | $272,500 | $177 | 40 |
| 402 W Melvina St | 0.63mi | 5/2.0 (+1) | 1,948 (+14%) | 4mo | $223,137 | $115 | 35 |
Match score weights: distance 35% · size 25% · config 20% · recency 20%. Top-matched comps best support the ARV.
Projected returns pro-forma
-3.0% appreciation · 5.0% rent growth · sell at horizon
- IRR
- —
- Equity multiple
- 8.25×
- Total profit
- $62,887
- Equity at exit
- $4,622
- IRR
- —
- Equity multiple
- 18.57×
- Total profit
- $152,499
- Equity at exit
- $2,680
Cash invested: $8,680 (down + closing). Projections, not guarantees.
Landlord ↔ Tenant lean methodology
- Overall (STATE)
- 73 Landlord-Friendly
- State Wisconsin
- 73 Landlord-Friendly · R+2
- County
- — inherits STATE
- City
- — inherits STATE
ZIP-level market 53212
- Rents YoY
- 5.0%
- Active inventory
- 131
- Price-to-rent
- 1.6×
Monthly cashflow live
- Estimated rent
- $1,647 high interval (Pro) →
- Mortgage (P&I)
- −$163
- Tax from tax record
- −$113 /mo · $1,361/yr
- Insurance
- −$13
- HOA
- −$0
- Vacancy / Maint / Mgmt
- −$346
- Net cashflow
- $1,012
Break-even live
Sensitivity live
| Price | -10% $1,030 | -5% $1,021 | +0% $1,012 | +5% $1,003 | +10% $995 |
|---|---|---|---|---|---|
| Rent | -10% $882 | -5% $947 | +0% $1,012 | +5% $1,077 | +10% $1,142 |
| Rate | -1.0pp $1,028 | -0.5pp $1,020 | base $1,012 | +0.5pp $1,004 | +1.0pp $996 |
UW: 25.0% down · 7.5% · 30yr · 1.5% tax · 5.0% vac · 8.0% maint · 8.0% mgmt
Financing live
Cash to close
- Down payment
- $7,750
- Closing costs
- $930
- Reserves months
- —
- Total cash needed
- —
Loan-product check · same deal, 3 products live
Conventional
25% down · 7.5% · 30yr
- Down + closing
- —
- Monthly P&I
- —
- Monthly cashflow
- —
- DSCR
- —
- Eligible?
- —
Personal DTI + credit; lowest rate.
DSCR
20% down · 8.5% · 30yr
- Down + closing
- —
- Monthly P&I
- —
- Monthly cashflow
- —
- DSCR
- —
- Eligible?
- —
No personal income docs; deal must DSCR.
Hard money
10% down · 12.0% · 12mo
- Down + closing
- —
- Monthly P&I
- —
- Monthly cashflow
- —
- DSCR
- —
- Eligible?
- —
Short-term bridge; refi at stabilization.
Rent comps 18 comps
| Address | Beds | Baths | Sqft | Rent | $/sqft | DOM | Units | Dist |
|---|---|---|---|---|---|---|---|---|
| 312 E Townsend St Unit 312 Milwaukee, WI | 3.0 | 1.0 | 1400 | $1,250 | $0.89 | 24d | 1 | 0.37mi |
| 223 E Burleigh St Unit 223 Milwaukee, WI | 4.0 | 1.0 | 1153 | $1,395 | $1.21 | 44d | 1 | 0.41mi |
| 3042 N Palmer St #5 Milwaukee, WI | 3.0 | 1.0 | 1718 | $1,050 | $0.61 | 24d | 1 | 0.43mi |
| 3045 N 11th St #3047 Milwaukee, WI | 3.0 | 1.0 | 1065 | $1,175 | $1.10 | 5d | 1 | 0.67mi |
| 3416 N 17th St Unit 1 Milwaukee, WI | 3.0 | 1.0 | 1200 | $1,100 | $0.92 | 44d | 1 | 0.92mi |
| 2772 N Bremen St #2774 Milwaukee, WI | 3.0 | 1.0 | 1500 | $1,795 | $1.20 | 44d | 1 | 0.99mi |
| 2761 N Humboldt Blvd Unit First Floor Milwaukee, WI | 3.0 | 1.0 | 1236 | $1,600 | $1.29 | 18d | 1 | 1.07mi |
| 2507 N Buffum St Milwaukee, WI | 3.0 | 1.0 | 1300 | $1,375 | $1.06 | 20d | 1 | 1.09mi |
| 400 E Meinecke Ave #402 Milwaukee, WI | 3.0 | 1.0 | 1700 | $1,800 | $1.06 | 17d | 1 | 1.22mi |
| 3131 N Bartlett Ave Unit 1 Milwaukee, WI | 4.0 | 1.0 | 1600 | $1,750 | $1.09 | 44d | 1 | 1.27mi |
| 2106A W Keefe Ave Unit 2106 Lower Milwaukee, WI | 3.0 | 1.0 | 1300 | $1,100 | $0.85 | 18d | 1 | 1.27mi |
| 3377 N Oakland Ave Milwaukee, WI | 4.0 | 2.0 | 1358 | $2,550 | $1.88 | 2d | 1 | 1.31mi |
| 2429 N Weil St Milwaukee, WI | 3.0 | 1.0 | 1300 | $1,500 | $1.15 | 44d | 1 | 1.34mi |
| 3246 N Oakland Ave #3244 Milwaukee, WI | 3.0 | 1.0 | 1309 | $2,010 | $1.54 | 2d | 1 | 1.35mi |
| 1814 E Linnwood Ave Milwaukee, WI | 4.0 | 2.0 | 1800 | $3,100 | $1.72 | 44d | 1 | 1.41mi |
| 1902 E Linnwood Ave Unit 1902 05 Milwaukee, WI | 4.0 | 1.5 | 1599 | $2,400 | $1.50 | 5d | 1 | 1.46mi |
| 1902 E Linnwood Ave Unit 1902 3002 Milwaukee, WI | 3.0 | 1.0 | 1300 | $1,899 | $1.46 | 44d | 1 | 1.46mi |
| 1902 E Linnwood Ave Unit 1902 04 Milwaukee, WI | 4.0 | 1.5 | 1599 | $2,400 | $1.50 | 18d | 1 | 1.46mi |
Listing history 4 events
-
2026-06-21days on market $31,000 Active 5 DOM
-
2026-06-18days on market $31,000 Active 2 DOM
-
2026-06-17remarks 699-char remark
-
2026-06-17$31,000 Active 1 DOM
ⓘ Source: listings_history table (triggers on properties + properties_extension) + one-shot
backfill from property_details.listing_events for pre-trigger history.
Tax reassessment forecast WI · Partial reset (capped growth)
- Current annual tax
- $1,361 · $113/mo
- Projected year-2 tax
- $1,361 · $113/mo
- Expected delta
- $0/yr ($0/mo · 0.0%)
ⓘ Screening estimate from a state-policy table — verify with the county assessor before closing.
Climate risk First Street
- Flood 1/10 Low FEMA zone X (unshaded) · 0% chance over 30 yrs
- Wildfire 1/10 Low
- Heat 2/10 Low 7 d/yr ≥98°F today · 13 d/yr by 30 yrs out
- Wind 2/10 Low
- Air quality 3/10 Moderate 3 unhealthy d/yr today · 4 by 30 yrs out
Nearby sold comps map
Loading sold comps map…
Walkable amenities ~0.75 mi
Loading nearby amenities…
Taxation est. · year 1
- Rental income
- $19,762
- − Mortgage interest
- −$1,736
- − Property taxes
- −$1,361
- − Insurance
- −$155
- − Repairs & maintenance
- −$1,581
- − Management
- −$1,581
- − Depreciation
- −$902
- Taxable income
- $12,446
- Est. tax owed @ 24.0%
- −$2,987
- After-tax cash flow
- $9,158/yr
For passive investors: Depreciation is non-cash, so a rental often shows a tax loss while cash-flowing — sheltering income. Rental losses are passive: they offset passive income freely, and up to $25,000/yr can offset ordinary (W-2) income if you actively participate and your MAGI is under $100k (phasing out to $0 by $150k); unused losses carry forward. On sale, claimed depreciation is recaptured at up to 25%, and gains may owe capital-gains tax (a 1031 exchange can defer both). Figures are a year-1 estimate at your 24.0% rate — not tax advice; consult a CPA.
Schools (NCES district)
- District
- Milwaukee School District
- NCES district ID
- 5509600
- Math proficiency
- 10% ▼ -5.00%
- Reading proficiency
- 18% ▬ 0.00%
- Median HH income
- $36,339
- Composite
- 11.61/100
- National rank
- #9696
- State rank
- #337 of 342 in WI
Livability — Milwaukee
- Score
- 81/100
- State rank
- #55
- US rank
- #1534
Category grades
Schools grade is shown separately in the Schools card above.
Census & demographics
- Census place
- Milwaukee, WI
- County
- Milwaukee County · 926,379 people
- City population
- 573,768
- Metro
- Milwaukee-Waukesha, WI
- Population (ZIP)
- 28,938
- Household income
- $47,298
- Rent vs Own
- Severe rent burden
- 2397.0
Population outlook (Milwaukee County) Hauer SSP2
- Today (2025)
- 995,758 people
- By 2030
- 1,009,124 · +1.3%
- By 2040
- 1,028,128 · +3.3%
- By 2050
- 1,040,066 · +4.4%
- By 2075
- 1,057,849 · +6.2%
- By 2100
- 1,039,774 · +4.4%
Race, ethnicity, and origin ACS 2023
- Neighborhood character
- Diverse neighborhood (Simpson 0.64)
- Race & ethnicity
- Black 48% White 35% Hispanic / Latino 12% Two or more races 9%
- Hispanic origin (detail)
- Mexican 4% Puerto Rican 6%
- Common ancestry
- Romanian 4% Portuguese 2% Italian 2%
- Foreign-born
- 2% · Canada
- Languages at home
- 92% English-only · Spanish 6%
Political lean MEDSL · Milwaukee
- 2024 margin
- Solid D (+38.5) · D 68.3% · R 29.8% · Other 1.8%
- 2008→2024 swing
- +2.7pp toward D · 2008: 35.9pp · 2024: 38.5pp
- All cycles
- 2024: D+38.5 2020: D+39.9 2016: D+37.5 2012: D+34.6 2008: D+35.9
Not yet ingested
- Civics
- —
Market trends
- HPI YoY
- ▼ -216.73%
- Current HPI
- 385.8225
- Rent YoY
- ▲ 5.00%
- Metro
- Milwaukee-Waukesha, WI
- State GDP YoY
- ▲ 2.10%
- F500 in state
- 20
Industry mix (Fortune 500 HQ in WI)
| Industry | F500 HQs | Revenue |
|---|---|---|
| Industrial Machinery | 4 | $23B |
|
||
| Industrial Technology | 2 | $36B |
|
||
| Insurance | 1 | $36B |
|
||
| Professional Services | 1 | $19B |
|
||
| Utilities | 1 | $9B |
|
||
| Consumer Goods | 1 | $3B |
|
||
Price history
+156.2% since first listed14 events — show timeline
- 2026-06-17 Listed $31,000 METROMLS
- 2023-08-21 Sold (Public Records) $60,000 Public Records
- 2023-08-16 Sold (MLS) $60,000 METROMLS
- 2023-07-15 Pending — METROMLS
- 2023-06-09 Relisted — METROMLS
- 2023-05-28 Pending — METROMLS
- 2023-05-09 Price Changed $69,000 METROMLS
- 2023-04-12 Listed $79,000 METROMLS
- 2014-01-08 Listing Removed — METROMLS
- 2014-01-08 Listed $16,000 METROMLS
- 2012-04-11 Sold (Public Records) $343,200 Public Records
- 2012-03-26 Sold (MLS) $13,725 METROMLS
- 2000-01-10 Sold (Public Records) $32,000 Public Records
- 1971-01-01 Sold (Public Records) $12,100 Public Records
Property tax history
+2.3%/yrLatest (2024): $1,361 · -13.4% YoY. Source: county tax records.
Cash-flow waterfall
monthlySold comps — $/sqft
last 12 mo · ≤1 miLoading sold comps…