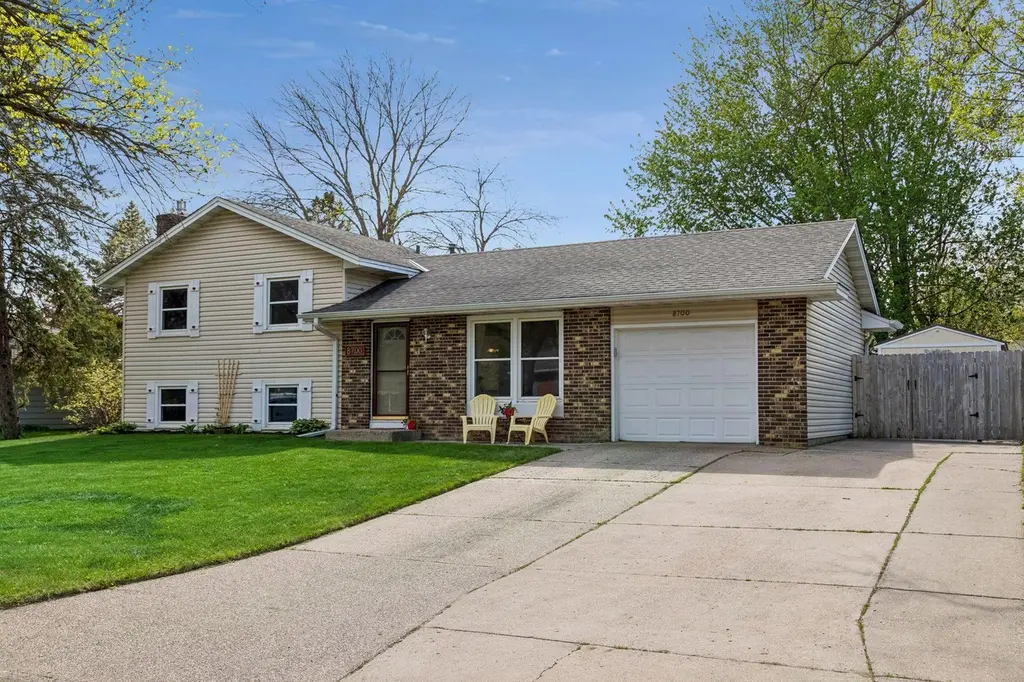
8700 Ironwood Ave S · Cottage Grove, MN
Flood risk 1/10 · Minimal
- FEMA flood zone
- X (unshaded)
- Chance of flooding over 30 yrs
- 0.0%
- Est. flood insurance / yr
- $473 – $860
Fire risk 1/10 · Minimal
- Est. fire insurance / yr
- $888 – $1,650
Heat risk 2/10 · Minimal
- Hot days now (above 98°F)
- 7 days/yr
- Hot days in 30 yrs
- 14 days/yr
Wind risk 2/10 · Minimal
- Chance of severe wind over 30 yrs
- —
Air-quality risk 1/10 · Minimal
- Unhealthy air days now
- 0 days/yr
- Unhealthy air days in 30 yrs
- 0 days/yr
Risk factors via First Street. Map © Google.
Why this score? — see what drove the D grade
The composite is a weighted blend of 9 inputs, each scored 0–100. Each bar is that input's sub-score; the figure is the points it added to the 100-point composite (weight × sub-score).
- ARV discount +14.5/15.0
- Cash flow +9.6/30.0
- Schools +5.2/10.0
- Livability +3.9/5.0
- Rent growth +3.4/5.0
- DSCR +2.7/10.0
- Condition / age +2.5/5.0
- 1% rule +2.4/10.0
- Appreciation +0.0/10.0
$314,900
🖨 Deal sheet (PDF) 📄 Offer letter ✓ Due diligence
Listing remarks MLS
Multiple Offers. Highest and Best due 9 am 9/15/14. 3 BR, 1 BA home features a new kitchen and bathroom, new carpet, new furnace and water heater, and fresh interior paint!
Key facts
- 0.23 acre lot
- Garage
- Built 1969
Property features AI
Exterior
- Parking: Attached garage (1 space, 14 x 23)
- Utilities: City water (connected); City sewer (connected); Natural gas
- Home design: Residential property; Three-level split
- Construction: Block foundation
- Exterior features: Patio; Stone and vinyl exterior; Storage shed
Interior
- Kitchen: Dishwasher; Microwave; Range; Refrigerator
- Bedrooms: Three bedrooms (upper level)
- Bathrooms: One full bathroom (upper level)
- Heating & cooling: Forced air heating; Central air conditioning
- Interior features: Finished basement; Fireplace in family room (gas); Kitchen/Dining combination; Three-bedroom on one level layout
- Laundry & utility: Washer; Dryer
Neighborhood map
What this means for you Summary
Snapshot
- This is a 3-bed/1.0-bath single-family listed at $315k.
Deal economics
- At list price, monthly cash flow is $-212 ($-3k/yr) — negative.
- To cash-flow at today's rent, offer at most $277k (11.9% below list).
- To meet the 1% rule (rent ≥ 1% of price), the offer needs to be $234k (25.8% below list).
- Recommended offer: $234k (25.8% below list) — sets the bar for 1% rule.
- Cap rate 5.5% vs local median 3.4% in Cottage Grove — top-decile yield for the area; either an underpriced asset or a hidden risk that comps aren't pricing in. Stress-test before assuming the spread holds.
Location & tenants
- Location reads 77/100 on livability (#132 in MN, #2,948 nationally) — a middle-class / working-renter tenant base. Strengths: crime A+, employment A+, housing A+; Watch: cost of living C-, amenities F, commute F.
- South Washington County School District (suburban): math 52% / reading 61% proficiency, ranked #40 of 301 in MN (top 13%) — acceptable for families but not a draw, mixed tenant base, ~2y average lease; only 14% free/reduced lunch — higher-income household profile.
- Zoned schools: Nuevas Fronteras Spanish Immersion (math 47% / reading 47%, grade D-, #492 of 857 statewide, top 61%, 499 students, 16% FRL); Oltman Middle School (math 36% / reading 54%, grade D, #113 of 258 statewide, top 45%, 969 students, 36% FRL); Park High School (math 39% / reading 63%, grade D+, #127 of 471 statewide, top 27%, 1,938 students, 33% FRL).
- Market conditions: Rents rising (+3.8%/yr); 401 active listings in the ZIP; 3 comparable units currently listed for rent nearby; rentals leasing fast (median 0d on market — plan ~1-2 weeks tenant-placement turnaround); high-income renter base; 1,405 units permitted in Washington County in 2024 (121 in 5+ unit buildings).
Forward outlook
- Local home prices are declining (-3.0%/yr); year-one equity from $2k of loan paydown is wiped out by about $9k of value loss. Plan a longer hold.
- Washington County population projected at +16% by 2050 — long-run rental-demand tailwind backs the buy-and-hold thesis.
Negotiation context
- Only 3 days on market — expect competitive offers; lowballing is unlikely to land.
- 7 sale attempts since 31y ago with the ask held roughly flat each time — persistent listings suggest the price (not the market) is what's stuck; bring a comps-based counter.
- Current owner paid $173k; list at $315k implies a 82% gain — meaningful room to come down on a strong offer.
Questions for the listing agent
- What do current leases actually rent for vs. the listed asking? Can we see a recent rent roll and the last 12 months of T-12 income?
- Built in 1969 — when were the roof, HVAC, electrical panel, plumbing, and water heater last replaced?
- Is there a deadline driving the sale (1031 exchange, divorce, estate, relocation)? That informs how much negotiation room exists.
- Schools are B-rated — typically a magnet for longer-tenancy family renters. What's the average tenant stay here, and is there a school-zone premium baked into asking?
- The area grade is low — what's the realistic commute time and amenity access for the typical tenant pool here? Any planned neighborhood developments (good or bad) we should know about?
- What's the average days-on-market for RENTAL listings here right now (not sales)? A rising rental-DOM trend means longer vacancies and softer asking-rent achievability than the comps imply.
- What's the recent tenant-quality profile in this submarket — average credit score on applications, eviction rate, late-payment / NSF rate, and stable-employment percentage? A property-management company in the area should have these aggregated.
- How much new for-sale + rental construction is in the pipeline within 1–3 miles? Heavy new supply typically softens prices + rents 12–24 months out; constrained supply supports both.
Investment metrics
- 1% rule
- 0.74% ✗
- Cap rate
- 5.48%
- Cash-on-cash
- -2.89%
- DSCR
- 0.87
- GRM
- 11.2
CMA / ARV
- ARV (median comp)
- $372,469
- List price
- $314,900
- Delta
- -15.46%
- Verdict
- UNDERPRICED
- Comps
- 3 within 1.0 mi
Projected returns pro-forma
-3.0% appreciation · 3.78% rent growth · sell at horizon
- IRR
- -20.3%
- Equity multiple
- 0.29×
- Total profit
- $-62,731
- Equity at exit
- $46,953
- IRR
- -11.9%
- Equity multiple
- 0.27×
- Total profit
- $-64,473
- Equity at exit
- $27,227
Cash invested: $88,172 (down + closing). Projections, not guarantees.
Landlord ↔ Tenant lean methodology
- Overall (STATE)
- 46 Balanced
- State Minnesota
- 46 Balanced · D+2
- County
- — inherits STATE
- City
- — inherits STATE
ZIP-level market 55016
- Rents YoY
- 3.8%
- Active inventory
- 401
- Price-to-rent
- 11.2×
Monthly cashflow live
- Estimated rent
- $2,337 medium interval (Pro) →
- Mortgage (P&I)
- −$1,651
- Tax from tax record
- −$276 /mo · $3,312/yr
- Insurance
- −$131
- HOA
- −$0
- Vacancy / Maint / Mgmt
- −$491
- Net cashflow
- $-212
Break-even live
Sensitivity live
| Price | -10% $-34 | -5% $-123 | +0% $-212 | +5% $-301 | +10% $-390 |
|---|---|---|---|---|---|
| Rent | -10% $-397 | -5% $-305 | +0% $-212 | +5% $-120 | +10% $-28 |
| Rate | -1.0pp $-54 | -0.5pp $-132 | base $-212 | +0.5pp $-294 | +1.0pp $-377 |
UW: 25.0% down · 7.5% · 30yr · 1.5% tax · 5.0% vac · 8.0% maint · 8.0% mgmt
Financing live
Cash to close
- Down payment
- $78,725
- Closing costs
- $9,447
- Reserves months
- —
- Total cash needed
- —
Loan-product check · same deal, 3 products live
Conventional
25% down · 7.5% · 30yr
- Down + closing
- —
- Monthly P&I
- —
- Monthly cashflow
- —
- DSCR
- —
- Eligible?
- —
Personal DTI + credit; lowest rate.
DSCR
20% down · 8.5% · 30yr
- Down + closing
- —
- Monthly P&I
- —
- Monthly cashflow
- —
- DSCR
- —
- Eligible?
- —
No personal income docs; deal must DSCR.
Hard money
10% down · 12.0% · 12mo
- Down + closing
- —
- Monthly P&I
- —
- Monthly cashflow
- —
- DSCR
- —
- Eligible?
- —
Short-term bridge; refi at stabilization.
Rent comps 3 comps
| Address | Beds | Baths | Sqft | Rent | $/sqft | DOM | Units | Dist |
|---|---|---|---|---|---|---|---|---|
| 7604 79th St S Cottage Grove, MN | 2.0 | 2.0 | 1222 | $1,995 | $1.63 | 45d | 1 | 1.35mi |
| 7550 80th St S Cottage Grove, MN | 3.0 | 1.0–2.0 | 993 | $2,700 | $2.72 | 0d | 11 | 1.35mi |
| 7750 Hinton Ave S Cottage Grove, MN | 1.0–3.0 | 1.0–2.0 | 1001 | $2,209 | $2.21 | 0d | 15 | 1.43mi |
Listing history 24 events
-
2026-05-18status Pending 521-char remark
-
2026-05-15$314,900 Active 521-char remark
-
2026-05-13historical $314,900 521-char remark
-
2014-10-30soldstatus $173,000 Sold 172-char remark
Show marketing remark (172 chars)
Multiple Offers. Highest and Best due 9 am 9/15/14. 3 BR, 1 BA home features a new kitchen and bathroom, new carpet, new furnace and water heater, and fresh interior paint!
-
2014-10-30soldstatus $173,000
Show marketing remark (172 chars)
Multiple Offers. Highest and Best due 9 am 9/15/14. 3 BR, 1 BA home features a new kitchen and bathroom, new carpet, new furnace and water heater, and fresh interior paint!
-
2014-10-30soldstatus $173,000
Show marketing remark (172 chars)
Multiple Offers. Highest and Best due 9 am 9/15/14. 3 BR, 1 BA home features a new kitchen and bathroom, new carpet, new furnace and water heater, and fresh interior paint!
-
2014-09-29status Pending 172-char remark
Show marketing remark (172 chars)
Multiple Offers. Highest and Best due 9 am 9/15/14. 3 BR, 1 BA home features a new kitchen and bathroom, new carpet, new furnace and water heater, and fresh interior paint!
-
2014-09-18historical Contingent - Other 172-char remark
Show marketing remark (172 chars)
Multiple Offers. Highest and Best due 9 am 9/15/14. 3 BR, 1 BA home features a new kitchen and bathroom, new carpet, new furnace and water heater, and fresh interior paint!
-
2014-09-11status Active 172-char remark
Show marketing remark (172 chars)
Multiple Offers. Highest and Best due 9 am 9/15/14. 3 BR, 1 BA home features a new kitchen and bathroom, new carpet, new furnace and water heater, and fresh interior paint!
-
2014-09-11historical Contingent - Other 172-char remark
Show marketing remark (172 chars)
Multiple Offers. Highest and Best due 9 am 9/15/14. 3 BR, 1 BA home features a new kitchen and bathroom, new carpet, new furnace and water heater, and fresh interior paint!
-
2014-08-18price $169,900 172-char remark
Show marketing remark (172 chars)
Multiple Offers. Highest and Best due 9 am 9/15/14. 3 BR, 1 BA home features a new kitchen and bathroom, new carpet, new furnace and water heater, and fresh interior paint!
-
2014-07-08$181,900 Active 172-char remark
Show marketing remark (172 chars)
Multiple Offers. Highest and Best due 9 am 9/15/14. 3 BR, 1 BA home features a new kitchen and bathroom, new carpet, new furnace and water heater, and fresh interior paint!
-
2014-07-08$169,900
Show marketing remark (172 chars)
Multiple Offers. Highest and Best due 9 am 9/15/14. 3 BR, 1 BA home features a new kitchen and bathroom, new carpet, new furnace and water heater, and fresh interior paint!
-
2014-07-08$169,900
Show marketing remark (172 chars)
Multiple Offers. Highest and Best due 9 am 9/15/14. 3 BR, 1 BA home features a new kitchen and bathroom, new carpet, new furnace and water heater, and fresh interior paint!
-
2006-07-21soldstatus $191,500
-
2000-04-25soldstatus $111,825
-
2000-04-06soldstatus $111,825
-
2000-02-24historical
-
2000-01-28$119,000
-
1995-06-13soldstatus $86,000
-
1995-05-20soldstatus $86,000
-
1995-03-21historical
-
1995-03-16$84,900
-
1981-08-01soldstatus $62,500
ⓘ Source: listings_history table (triggers on properties + properties_extension) + one-shot
backfill from property_details.listing_events for pre-trigger history.
Tax reassessment forecast MN · Partial reset (capped growth)
- Current annual tax
- $3,312 · $276/mo
- Projected year-2 tax
- $3,419 · $285/mo
- Expected delta
- +$107/yr (+$9/mo · 3.2%)
ⓘ Screening estimate from a state-policy table — verify with the county assessor before closing.
Climate risk First Street
- Flood 1/10 Low FEMA zone X (unshaded) · 0% chance over 30 yrs
- Wildfire 1/10 Low
- Heat 2/10 Low 7 d/yr ≥98°F today · 14 d/yr by 30 yrs out
- Wind 2/10 Low
- Air quality 1/10 Low 0 unhealthy d/yr today · 0 by 30 yrs out
Nearby sold comps map
Loading sold comps map…
Walkable amenities ~0.75 mi
Loading nearby amenities…
Taxation est. · year 1
- Rental income
- $28,046
- − Mortgage interest
- −$17,639
- − Property taxes
- −$3,312
- − Insurance
- −$1,574
- − Repairs & maintenance
- −$2,244
- − Management
- −$2,244
- − Depreciation
- −$9,161
- Taxable loss
- −$8,128
- Est. tax savings @ 24.0%
- +$1,951
- After-tax cash flow
- $-596/yr
For passive investors: Depreciation is non-cash, so a rental often shows a tax loss while cash-flowing — sheltering income. Rental losses are passive: they offset passive income freely, and up to $25,000/yr can offset ordinary (W-2) income if you actively participate and your MAGI is under $100k (phasing out to $0 by $150k); unused losses carry forward. On sale, claimed depreciation is recaptured at up to 25%, and gains may owe capital-gains tax (a 1031 exchange can defer both). Figures are a year-1 estimate at your 24.0% rate — not tax advice; consult a CPA.
Schools (NCES district)
- District
- South Washington County School District
- NCES district ID
- 2733810
- Math proficiency
- 52% ▼ -13.00%
- Reading proficiency
- 61% ▼ -7.00%
- Median HH income
- $88,285
- Composite
- 51.8/100
- National rank
- #1670
- State rank
- #40 of 301 in MN
Livability — Cottage Grove
- Score
- 77/100
- State rank
- #132
- US rank
- #2948
Category grades
Schools grade is shown separately in the Schools card above.
Census & demographics
- Census place
- Cottage Grove, MN
- County
- Washington County · 235,613 people
- City population
- 40,695
- Metro
- Minneapolis-St. Paul-Bloomington, MN-WI
- Population (ZIP)
- 40,695
- Household income
- $120,715
- Rent vs Own
- Severe rent burden
- 323.0
Population outlook (Washington County) Hauer SSP2
- Today (2025)
- 278,554 people
- By 2030
- 290,465 · +4.3%
- By 2040
- 310,014 · +11.3%
- By 2050
- 324,118 · +16.4%
- By 2075
- 362,697 · +30.2%
- By 2100
- 381,491 · +37.0%
Race, ethnicity, and origin ACS 2023
- Neighborhood character
- Predominantly White (76%)
- Race & ethnicity
- White 76% Two or more races 8% Hispanic / Latino 7% Asian 7% Black 5%
- Hispanic origin (detail)
- Mexican 5%
- Common ancestry
- Portuguese 10% Lithuanian 4% Romanian 3%
- Foreign-born
- 8% · Canada, Vietnam
- Languages at home
- 87% English-only · Other Asian/Pacific 5% Spanish 4% Other Indo-European 1%
Political lean MEDSL · Washington
- 2024 margin
- Lean D (+8.9) · D 53.5% · R 44.6% · Other 1.9%
- 2008→2024 swing
- +4.6pp toward D · 2008: 4.3pp · 2024: 8.9pp
- All cycles
- 2024: D+8.9 2020: D+9.2 2016: D+1.9 2012: D+0.8 2008: D+4.3
Not yet ingested
- Civics
- —
Market trends
- HPI YoY
- ▼ -258.55%
- Current HPI
- 241.1084
- Rent YoY
- ▲ 3.78%
- Metro
- Minneapolis-St. Paul-Bloomington, MN-WI
- State GDP YoY
- ▲ 2.41%
- F500 in state
- 34
Industry mix (Fortune 500 HQ in MN)
| Industry | F500 HQs | Revenue |
|---|---|---|
| Healthcare | 2 | $407B |
|
||
| Retail | 2 | $150B |
|
||
| Consumer Goods | 2 | $32B |
|
||
| Industrial Machinery | 2 | $6B |
|
||
| Agriculture | 1 | $40B |
|
||
| Healthcare / Medical Devices | 1 | $32B |
|
||
Price history
+403.8% since first listed24 events — show timeline
- 2026-05-18 Pending — NORTHSTARMLS as Distributed by MLS Grid
- 2026-05-15 Listed $314,900 NORTHSTARMLS as Distributed by MLS Grid
- 2026-05-13 Coming Soon $314,900 NORTHSTARMLS as Distributed by MLS Grid
- 2014-10-30 Sold (MLS) $173,000 LSAR
- 2014-10-30 Sold (MLS) $173,000 RASM
- 2014-10-30 Sold (MLS) $173,000 NORTHSTARMLS as Distributed by MLS Grid
- 2014-09-29 Pending — NORTHSTARMLS as Distributed by MLS Grid
- 2014-09-18 Contingent — NORTHSTARMLS as Distributed by MLS Grid
- 2014-09-11 Relisted — NORTHSTARMLS as Distributed by MLS Grid
- 2014-09-11 Contingent — NORTHSTARMLS as Distributed by MLS Grid
- 2014-08-18 Price Changed $169,900 NORTHSTARMLS as Distributed by MLS Grid
- 2014-07-08 Listed $181,900 NORTHSTARMLS as Distributed by MLS Grid
- 2014-07-08 Listed $169,900 LSAR
- 2014-07-08 Listed $169,900 RASM
- 2006-07-21 Sold (Public Records) $191,500 Public Records
- 2000-04-25 Sold (MLS) $111,825 NORTHSTARMLS as Distributed by MLS Grid
- 2000-04-06 Sold (Public Records) $111,825 Public Records
- 2000-02-24 Listing Removed — NORTHSTARMLS as Distributed by MLS Grid
- 2000-01-28 Listed $119,000 NORTHSTARMLS as Distributed by MLS Grid
- 1995-06-13 Sold (Public Records) $86,000 Public Records
- 1995-05-20 Sold (MLS) $86,000 NORTHSTARMLS as Distributed by MLS Grid
- 1995-03-21 Listing Removed — NORTHSTARMLS as Distributed by MLS Grid
- 1995-03-16 Listed $84,900 NORTHSTARMLS as Distributed by MLS Grid
- 1981-08-01 Sold (Public Records) $62,500 Public Records
Property tax history
+2.6%/yrLatest (2025): $3,312 · -2.4% YoY. Source: county tax records.
Cash-flow waterfall
monthlySold comps — $/sqft
last 12 mo · ≤1 miLoading sold comps…