 8-Plex
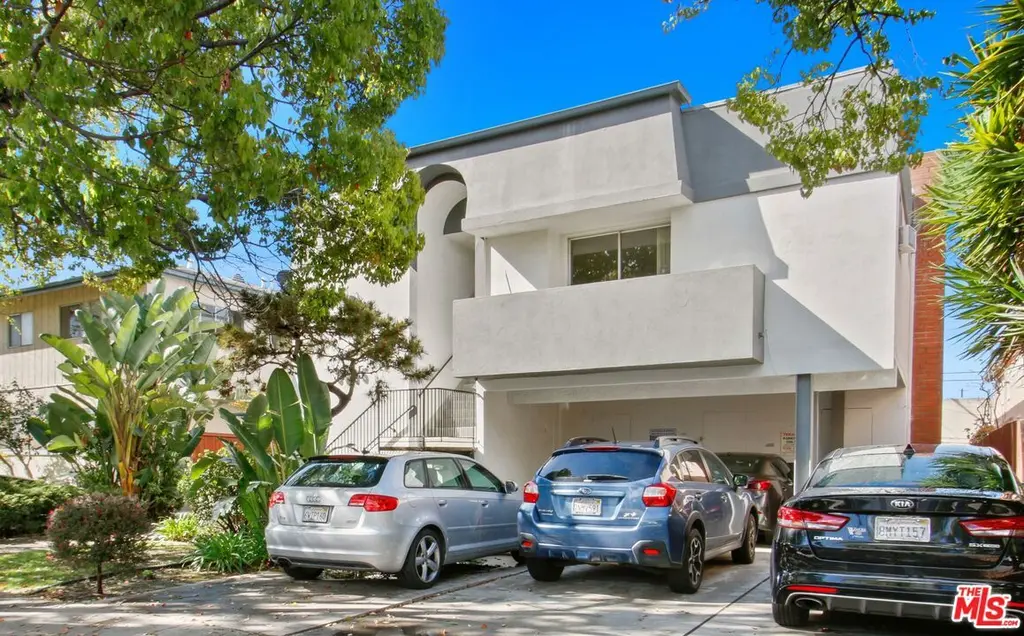
3735 Mentone Ave · Los Angeles, CA
Flood risk 1/10 · Minimal
- FEMA flood zone
- X (unshaded)
- Chance of flooding over 30 yrs
- 0.0%
- Est. flood insurance / yr
- $507 – $1,088
Fire risk 1/10 · Minimal
- Est. fire insurance / yr
- $659 – $1,223
Heat risk 6/10 · Moderate
- Hot days now (above 85°F)
- 7 days/yr
- Hot days in 30 yrs
- 21 days/yr
Wind risk 1/10 · Minimal
- Chance of severe wind over 30 yrs
- —
Air-quality risk 4/10 · Minor
- Unhealthy air days now
- 6 days/yr
- Unhealthy air days in 30 yrs
- 7 days/yr
Risk factors via First Street. Map © Google.
Why this score? — see what drove the C- grade
The composite is a weighted blend of 9 inputs, each scored 0–100. Each bar is that input's sub-score; the figure is the points it added to the 100-point composite (weight × sub-score).
- Cash flow +18.5/30.0
- ARV discount +12.5/15.0
- DSCR +5.8/10.0
- 1% rule +3.9/10.0
- Schools +3.6/10.0
- Livability +3.4/5.0
- Rent growth +2.6/5.0
- Condition / age +2.5/5.0
- Appreciation +0.0/10.0
$2,375,000
🖨 Deal sheet (PDF) 📄 Offer letter ✓ Due diligence
Multi-family units
County records classify this as Multi-Family (5+ Unit). Listing-text estimate: 8 units. confirmed
5+ unit building — per-unit beds/baths from public records are typically unavailable; the breakdown below (if shown) is an estimate from the listing text.
Listing remarks
Roque & Mark Co. is pleased to represent this well maintained 8-unit apartment building in the most desirable living area of Palms - north of Venice Blvd. and steps to restaurants, shopping, and downtown Culver City. This property can be purchased separately or with 3625 Mentone Ave. Excellent unit mix consisting of (3) 2 beds + 2 baths, (1) 1 bed + large den + 1 bath, (3) 1 bed + 1 bath, and (1) studio unit. The property is fully occupied and currently offered at a 11.0 GRM and 6.0% CAP rate with actual rents. Most units have their own balcony or patio. Plenty of parking with 8 individual spaces and 11 total if used as tandem. There is an alley. All soft-story retrofitting and balcon
Key facts
- Own balcony or patio
- Plenty of parking
- 8 individual spaces
Tags
Property features AI
Finance
- Other: Units are apartments (eight units total); unit rents range from approximately $1,087 to $2,895
- Financial info: Gross income: $215,424; Gross operating income: $211,116; Net operating income: $141,154; Total annual expenses: $69,962; Cap rate: 5.48%; Gross rent multiplier: 11.95; Vacancy allowance: 2%; Income reported as Actual
- HOA & community: 8 total units in complex
Exterior
- Parking: 11 total parking spaces; 8 carport spaces; 3 open parking spaces; Driveway access
- Utilities: Sewer connection in street; Water in street; served by LADWP; Tenant pays gas and electric; owner pays water
- Home design: Residential income property; Two total floors (building described as one level per unit)
- Construction: Composition/Shingle roof
- Exterior features: Alley access; No additional detached structures
Interior
- Kitchen: Garbage disposal included in units
- Bedrooms: Unit mix includes 3 two-bedroom units, 5 one-bedroom/efficiency units (unit-level breakdown below)
- Bathrooms: Multiple full and three-quarter bathrooms across units (see unit breakdown)
- Heating & cooling: Wall heating; No central cooling
- Interior features: Garbage disposal; Balcony
- Laundry & utility: Onsite community laundry (owner-owned equipment); Central gas water heater
Neighborhood map
What this means for you Summary
Snapshot
- This is a 3×2bd/2ba + 4×1bd/1ba + 1×?bd/1ba units multifamily listed at $2.38M.
Deal economics
- At list price, monthly cash flow is $2k ($27k/yr) — positive. Per door: $284/mo.
- The deal already cash-flows at list — no discount required.
- To meet the 1% rule (rent ≥ 1% of price), the offer needs to be $2.11M (11.0% below list).
- Recommended offer: $2.11M (11.0% below list) — sets the bar for 1% rule.
- Cap rate 7.4% vs local median 2.1% in Los Angeles — top-decile yield for the area; either an underpriced asset or a hidden risk that comps aren't pricing in. Stress-test before assuming the spread holds.
Location & tenants
- Location reads 68/100 on livability (#273 in CA) — a middle-class / working-renter tenant base. Strengths: amenities A+, commute A+, employment B; Watch: health & safety C-, crime F, cost of living F.
- Los Angeles Unified (urban): math 29% / reading 54% proficiency, ranked #223 of 517 in CA (top 43%) — families likely to look elsewhere, expect single-tenant / working-renter base with shorter leases; 67% free/reduced lunch — lower-income household profile, screen leases tightly.
- Zoned schools: Palms Elementary (250 students, 75% FRL); Palms Middle (1,244 students, 66% FRL); Alexander Hamilton Senior High (math 31% / reading 65%, grade D, #380 of 1,170 statewide, top 33%, 2,259 students, 74% FRL) — zoned schools at 72% FRL track the district average.
- Market conditions: Rents flat; 120 active listings in the ZIP; solid renter incomes; 19,697 units permitted in Los Angeles County in 2024 (9,426 in 5+ unit buildings).
- At $21,146/mo this rent would consume 240% of the median local household income ($106k/yr) (locally 4507% of renters already pay >50% of income on rent) — very limited rent-growth headroom before tenants either downsize or default.
Forward outlook
- Local home prices are declining (-3.0%/yr); year-one equity from $16k of loan paydown is wiped out by about $71k of value loss. Plan a longer hold.
- Los Angeles County population projected at +9% by 2050 — modest demand growth; plan on rents tracking national, not racing it.
Negotiation context
- It's been on market 40 days — a 3% lower offer ($2.30M) is reasonable based on typical stale-listing flexibility.
- 2 sale attempts since 2y ago; this cycle's ask has dropped $200k (8%) from the opening price — seller is motivated, your offer sets the floor, not the list.
- Current owner paid $435k; list at $2.38M implies a 446% gain — meaningful room to come down on a strong offer.
Risks & watch-outs
- Climate carrying-cost: extreme-heat days projected 7→21/yr by 2055 (HVAC capex compounding) — expect insurance premiums to compound above CPI over the hold.
Questions for the listing agent
- It's been on market 40 days. Have you received any prior offers? Is the seller open to a 11% concession, seller financing, or rate buy-down credit?
- Can we see the unit-by-unit rent roll, current vacancy, and any below-market leases? What's the average tenancy length?
- What capital expenditures (roof, boiler, parking lot, exteriors) have been made in the last 5 years, and what's planned in the next 2?
- Built in 1967 — when were the roof, HVAC, electrical panel, plumbing, and water heater last replaced?
- Is there a deadline driving the sale (1031 exchange, divorce, estate, relocation)? That informs how much negotiation room exists.
- Schools are D-rated, which usually means shorter tenancies and higher turnover. Who's the typical renter profile here, and what's been the actual vacancy rate?
- Crime grade is F in this area — have there been break-ins, vandalism, or insurance claims at this property in the last 3 years? What carrier currently insures it and at what premium?
- What's the average days-on-market for RENTAL listings here right now (not sales)? A rising rental-DOM trend means longer vacancies and softer asking-rent achievability than the comps imply.
- What's the recent tenant-quality profile in this submarket — average credit score on applications, eviction rate, late-payment / NSF rate, and stable-employment percentage? A property-management company in the area should have these aggregated.
- How much new apartment / multifamily construction is in the pipeline within 1–3 miles? Heavy new supply (>2% of stock underway) typically softens rents 12–24 months out; light construction supports rent growth.
Investment metrics
- 1% rule
- 0.89% ✗
- Cap rate
- 7.44%
- Cash-on-cash
- 4.09%
- DSCR
- 1.18
- GRM
- 9.4
CMA / ARV
- ARV (median comp)
- $2,669,081
- List price
- $2,375,000
- Delta
- -11.02%
- Verdict
- UNDERPRICED
- Comps
- 20 within 1.0 mi
Show comp detail 2 sales within ~0.75 mi
| Address | Dist | Beds/Ba | Sqft | Sold | Price | $/sf | Match |
|---|---|---|---|---|---|---|---|
| 3310 Keystone Ave | 0.58mi | 10/11.0 | 7,316 (-0%) | 2mo | $2,450,000 | $335 | 71 |
| 3831 Motor | 0.20mi | 10/13.0 | 8,159 (+12%) | 3mo | $2,045,000 | $251 | 61 |
Match score weights: distance 35% · size 25% · config 20% · recency 20%. Top-matched comps best support the ARV.
Projected returns pro-forma
-3.0% appreciation · 0.3% rent growth · sell at horizon
- IRR
- -12.7%
- Equity multiple
- 0.55×
- Total profit
- $-297,224
- Equity at exit
- $354,120
- IRR
- -7.9%
- Equity multiple
- 0.56×
- Total profit
- $-293,901
- Equity at exit
- $205,347
Cash invested: $665,000 (down + closing). Projections, not guarantees.
Landlord ↔ Tenant lean methodology
- Overall (CITY)
- 0 Strongly Tenant-Friendly
- State California
- 18 Strongly Tenant-Friendly · D+13
- County
- — inherits STATE
- City Los Angeles
- 0 Strongly Tenant-Friendly · D+22
ZIP-level market 90034
- Rents YoY
- 0.3%
- Active inventory
- 120
- Price-to-rent
- 72.1×
Monthly cashflow live
- Estimated rent
- $21,146 high interval (Pro) →
- Mortgage (P&I)
- −$12,455
- Tax from tax record
- −$993 /mo · $11,914/yr
- Insurance
- −$990
- HOA
- −$0
- Vacancy / Maint / Mgmt
- −$4,441
- Net cashflow
- $2,268
Break-even live
Sensitivity live
| Price | -10% $3,613 | -5% $2,940 | +0% $2,268 | +5% $1,596 | +10% $924 |
|---|---|---|---|---|---|
| Rent | -10% $598 | -5% $1,433 | +0% $2,268 | +5% $3,103 | +10% $3,939 |
| Rate | -1.0pp $3,464 | -0.5pp $2,872 | base $2,268 | +0.5pp $1,653 | +1.0pp $1,027 |
8-unit breakdown (identical units grouped — click to expand)
| Units | Beds | Baths | Est. rent |
|---|---|---|---|
| 3× units | 2 | 2 | $8,232 |
| #1 | 2 | 2 | $2,744 |
| #2 | 2 | 2 | $2,744 |
| #3 | 2 | 2 | $2,744 |
| 4× units | 1 | 1 | $10,332 |
| #4 | 1 | 1 | $2,583 |
| #5 | 1 | 1 | $2,583 |
| #6 | 1 | 1 | $2,583 |
| #7 | 1 | 1 | $2,583 |
| 1× unit | 0 | 1 | $2,584 |
| Total (8 units) | $21,146 | ||
UW: 25.0% down · 7.5% · 30yr · 1.5% tax · 5.0% vac · 8.0% maint · 8.0% mgmt
Financing live
Cash to close
- Down payment
- $593,750
- Closing costs
- $71,250
- Reserves months
- —
- Total cash needed
- —
Loan-product check · same deal, 3 products live
Conventional
25% down · 7.5% · 30yr
- Down + closing
- —
- Monthly P&I
- —
- Monthly cashflow
- —
- DSCR
- —
- Eligible?
- —
Personal DTI + credit; lowest rate.
DSCR
20% down · 8.5% · 30yr
- Down + closing
- —
- Monthly P&I
- —
- Monthly cashflow
- —
- DSCR
- —
- Eligible?
- —
No personal income docs; deal must DSCR.
Hard money
10% down · 12.0% · 12mo
- Down + closing
- —
- Monthly P&I
- —
- Monthly cashflow
- —
- DSCR
- —
- Eligible?
- —
Short-term bridge; refi at stabilization.
Listing history 20 events
-
2026-06-21days on market $2,375,000 Active 40 DOM
-
2026-06-18days on market $2,375,000 Active 37 DOM
-
2026-06-17days on market $2,375,000 Active 36 DOM
-
2026-06-16days on market $2,375,000 Active 35 DOM
-
2026-06-15price $2,375,000 Active 34 DOM
-
2026-06-15days on market $2,575,000 Active 34 DOM
-
2026-06-13days on market $2,575,000 Active 32 DOM
-
2026-06-09days on market $2,575,000 Active 28 DOM
-
2026-06-08days on market $2,575,000 Active 27 DOM
-
2026-06-07days on market $2,575,000 Active 26 DOM
-
2026-06-04days on market $2,575,000 Active 23 DOM
-
2026-06-03days on market $2,575,000 Active 22 DOM
-
2026-06-02days on market $2,575,000 Active 21 DOM
-
2026-06-01days on market $2,575,000 Active 20 DOM
-
2026-05-31days on market $2,575,000 Active 19 DOM
-
2026-05-12$2,575,000 Active 1122-char remark
-
2024-04-10historical $2,950
-
2024-03-29$2,950
-
2022-03-20price $2,950
-
1983-10-31soldstatus $435,000
ⓘ Source: listings_history table (triggers on properties + properties_extension) + one-shot
backfill from property_details.listing_events for pre-trigger history.
Tax reassessment forecast CA · Resets to sale price
- Current annual tax
- $11,914 · $993/mo
- Projected year-2 tax
- $18,050 · $1,504/mo
- Expected delta
- +$6,136/yr (+$511/mo · 51.5%)
ⓘ Screening estimate from a state-policy table — verify with the county assessor before closing.
Climate risk First Street
- Flood 1/10 Low FEMA zone X (unshaded) · 0% chance over 30 yrs
- Wildfire 1/10 Low
- Heat 6/10 Major 7 d/yr ≥85°F today · 21 d/yr by 30 yrs out
- Wind 1/10 Low
- Air quality 4/10 Moderate 6 unhealthy d/yr today · 7 by 30 yrs out
Nearby sold comps map
Loading sold comps map…
Walkable amenities ~0.75 mi
Loading nearby amenities…
Taxation est. · year 1
- Rental income
- $253,752
- − Mortgage interest
- −$133,037
- − Property taxes
- −$11,914
- − Insurance
- −$11,875
- − Repairs & maintenance
- −$20,300
- − Management
- −$20,300
- − Depreciation
- −$69,091
- Taxable loss
- −$12,765
- Est. tax savings @ 24.0%
- +$3,064
- After-tax cash flow
- $30,282/yr
For passive investors: Depreciation is non-cash, so a rental often shows a tax loss while cash-flowing — sheltering income. Rental losses are passive: they offset passive income freely, and up to $25,000/yr can offset ordinary (W-2) income if you actively participate and your MAGI is under $100k (phasing out to $0 by $150k); unused losses carry forward. On sale, claimed depreciation is recaptured at up to 25%, and gains may owe capital-gains tax (a 1031 exchange can defer both). Figures are a year-1 estimate at your 24.0% rate — not tax advice; consult a CPA.
Schools (NCES district)
- District
- Los Angeles Unified
- NCES district ID
- 0622710
- Math proficiency
- 29% ▼ -4.00%
- Reading proficiency
- 54% ▲ 10.00%
- Median HH income
- $50,403
- Composite
- 35.67/100
- National rank
- #4875
- State rank
- #223 of 517 in CA
Livability — Los Angeles
- Score
- 68/100
- State rank
- #273
- US rank
- #9237
Category grades
Schools grade is shown separately in the Schools card above.
Census & demographics
- Census place
- Los Angeles, CA
- County
- Los Angeles County · 9,444,647 people
- City population
- 3,838,149
- Metro
- Los Angeles-Long Beach-Anaheim, CA
- Population (ZIP)
- 57,075
- Household income
- $105,701
- Rent vs Own
- Severe rent burden
- 4507.0
Population outlook (Los Angeles County) Hauer SSP2
- Today (2025)
- 10,940,515 people
- By 2030
- 11,256,481 · +2.9%
- By 2040
- 11,729,929 · +7.2%
- By 2050
- 11,948,407 · +9.2%
- By 2075
- 11,818,114 · +8.0%
- By 2100
- 10,842,928 · -0.9%
Race, ethnicity, and origin ACS 2023
- Neighborhood character
- Highly diverse neighborhood (Simpson 0.73)
- Race & ethnicity
- White 41% Hispanic / Latino 26% Asian 18% Two or more races 13% Black 9%
- Hispanic origin (detail)
- Mexican 16%
- Common ancestry
- Scotch-Irish 3% Romanian 3% Italian 2%
- Foreign-born
- 30% · Canada, China, South Korea
- Languages at home
- 58% English-only · Spanish 21% Other Indo-European 6% Chinese 4%
Political lean MEDSL · Los Angeles
- 2024 margin
- Solid D (+32.9) · D 64.8% · R 31.9% · Other 3.3%
- 2008→2024 swing
- -7.4pp toward R · 2008: 40.4pp · 2024: 32.9pp
- All cycles
- 2024: D+32.9 2020: D+44.2 2016: D+48.0 2012: D+40.0 2008: D+40.4
Not yet ingested
- Civics
- —
Market trends
- HPI YoY
- ▼ -1346.08%
- Current HPI
- 445.7709
- Rent YoY
- ▲ 0.30%
- Metro
- Los Angeles-Long Beach-Anaheim, CA
- State GDP YoY
- ▲ 3.21%
- F500 in state
- 116
Industry mix (Fortune 500 HQ in CA)
| Industry | F500 HQs | Revenue |
|---|---|---|
| Technology | 27 | $1,492B |
|
||
| Financial Services | 3 | $174B |
|
||
| Retail | 3 | $44B |
|
||
| Insurance | 3 | $26B |
|
||
| Media / Entertainment | 2 | $115B |
|
||
| Pharmaceuticals / Biotech | 2 | $62B |
|
||
Price history
+446.0% since first listed6 events — show timeline
- 2026-06-15 Price Changed $2,375,000 TheMLS
- 2026-05-12 Listed $2,575,000 TheMLS
- 2024-04-10 Rental Removed $2,950 APPFOLIO
- 2024-03-29 Listed for Rent $2,950 APPFOLIO
- 2022-03-20 Price Changed $2,950 RENT.
- 1983-10-31 Sold (Public Records) $435,000 Public Records
Property tax history
+1.7%/yrLatest (2025): $11,914 · +1.6% YoY. Source: county tax records.
Cash-flow waterfall
monthlySold comps — $/sqft
last 12 mo · ≤1 miLoading sold comps…