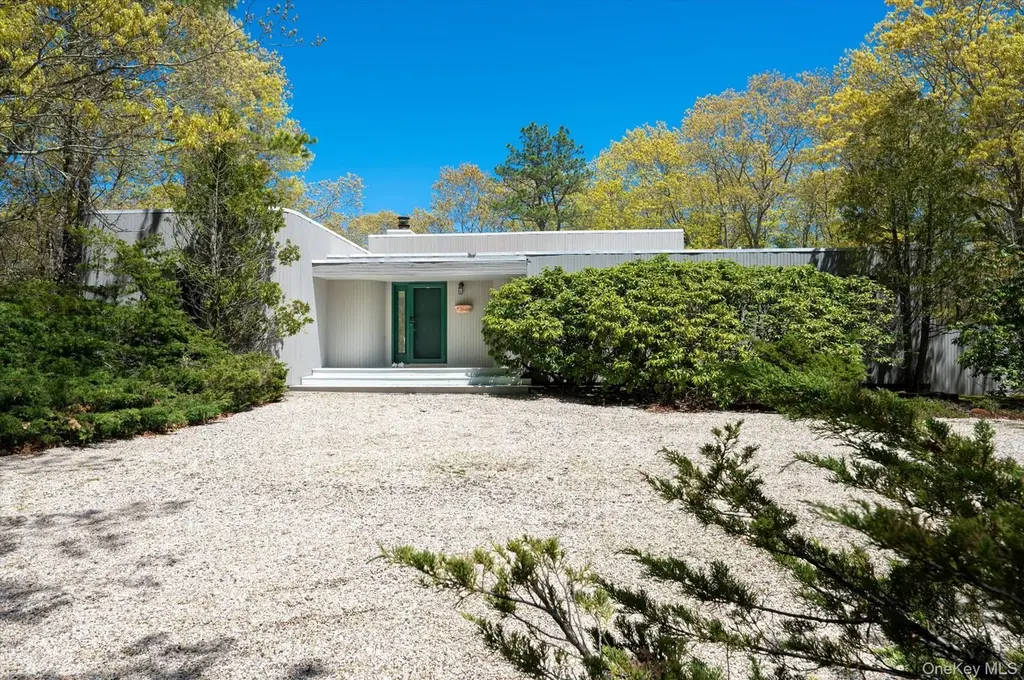
6 Deer Path · Quogue, NY
Flood risk 1/10 · Minimal
- FEMA flood zone
- X (unshaded)
- Chance of flooding over 30 yrs
- 0.0%
- Est. flood insurance / yr
- $473 – $860
Fire risk 1/10 · Minimal
- Est. fire insurance / yr
- $691 – $1,283
Heat risk 4/10 · Minor
- Hot days now (above 90°F)
- 7 days/yr
- Hot days in 30 yrs
- 19 days/yr
Wind risk 8/10 · Major
- Chance of severe wind over 30 yrs
- 80.0%
Air-quality risk 2/10 · Minimal
- Unhealthy air days now
- 2 days/yr
- Unhealthy air days in 30 yrs
- 2 days/yr
Risk factors via First Street. Map © Google.
Why this score? — see what drove the C+ grade
The composite is a weighted blend of 9 inputs, each scored 0–100. Each bar is that input's sub-score; the figure is the points it added to the 100-point composite (weight × sub-score).
- Cash flow +20.5/30.0
- ARV discount +9.3/15.0
- Appreciation +7.0/10.0
- Schools +6.6/10.0
- DSCR +6.5/10.0
- 1% rule +5.4/10.0
- Livability +3.4/5.0
- Rent growth +2.5/5.0
- Condition / age +2.5/5.0
$1,785,000
🖨 Deal sheet (PDF) 📄 Offer letter ✓ Due diligence
Listing remarks
A traditional Quogue ranch with so much to offer. Set on one acre on the quiet lane of Deer Path with proximity to the village and beaches of Quogue. This house offers a classic lay out with four bedrooms and three baths, a great room with a fireplace and a separate, sun-filled kitchen. The first-floor primary suite has sliders out to the deck; there is a guest bedroom with an en-suite bath and two more bedrooms. With high ceilings the home feels larger than it is and windows abound so the light streams everywhere. The front & back exterior is surrounded by trees that offer privacy and low maintenance. A large heated pool and ample deck in the rear of the property make this a perfect
Key facts
- One acre
- Great room
- Sliders out to deck
Tags
Property features AI
Finance
- Other: Living area recorded from public records
- Financial info: Not specified
- HOA & community: Not specified
Exterior
- Parking: Driveway (no carport)
- Security: Not specified
- Utilities: Septic tank; No utilities specified
- Home design: Single family residence; One story
- Construction: Frame construction with wood siding; Year built not specified
- Exterior features: Back yard; Landscaped yard; No waterfront; In-ground vinyl pool (private)
Interior
- Kitchen: Gas cooktop; Gas oven; Range; Oven; Dishwasher; Refrigerator
- Bedrooms: One-level home
- Flooring: Not specified
- Bathrooms: 3 full bathrooms
- Heating & cooling: Forced air heating; Central air conditioning; Wood-burning fireplace (1)
- Interior features: First-floor bedroom; First-floor full bathroom; Entrance foyer; Open kitchen; Primary bedroom on main level; Deck; Patio; Full unfinished basement
- Laundry & utility: Washer; Dryer
Neighborhood map
What this means for you Summary
Snapshot
- This is a 4-bed/3.0-bath single-family listed at $1.78M.
Deal economics
- At list price, monthly cash flow is $2k ($28k/yr) — positive.
- The deal already cash-flows at list — no discount required.
- Meets the 1% rule at list price ($19k rent vs $1.78M).
- Recommended offer: $1.76M (1.5% below list) — sets the bar for market timing.
Location & tenants
- Location reads 67/100 on livability (#600 in NY) — a middle-class / working-renter tenant base. Strengths: crime A+, employment A+, health & safety B+; Watch: amenities F, commute F, cost of living F.
- Quogue Union Free School District (suburban): math 70% / reading 80% proficiency, ranked #125 of 755 in NY (top 17%) — strong family-tenant draw, lease renewals of 3-5y typical; only 4% free/reduced lunch — higher-income household profile.
- Zoned schools: Quogue Elementary School (math 87% / reading 92%, grade A+, #45 of 2,108 statewide, top 3%, 84 students, 0% FRL) — zoned schools at 0% FRL track the district average.
- Zoned-school proficiency averages 90% at this address vs 75% district-wide (+14 pts) — the actual schools serving this property are materially stronger than the Quogue Union Free School District average implies; a family-tenant draw the district grade alone would hide.
- Market conditions: 37 active listings in the ZIP; 15 comparable units currently listed for rent nearby; rentals at typical pace (median 26d on market — plan ~3-4 weeks tenant-placement turnaround); 1,366 units permitted in Suffolk County in 2024 (216 in 5+ unit buildings).
Forward outlook
- In year one you build about $84k of equity ($12k loan paydown + $72k appreciation (4.0% local appreciation)).
- Suffolk County population projected to shrink 5% by 2050 — rents likely to lag national; underwrite the cash flow, not the appreciation.
- At projected returns (4.0% appreciation + 3.0% rent growth), your $500k cash investment doubles in ~5 years — after that, you're playing with house money.
- By year 2, paydown + projected appreciation supports a ~$135k cash-out refi (75% LTV) — recoverable capital for the next deal without selling this one.
Negotiation context
- It's been on market 28 days — a 2% lower offer ($1.76M) is reasonable based on typical stale-listing flexibility.
Risks & watch-outs
- Climate carrying-cost: severe wind risk, 80% chance of damaging wind over 30y — expect insurance premiums to compound above CPI over the hold.
Questions for the listing agent
- Is there a deadline driving the sale (1031 exchange, divorce, estate, relocation)? That informs how much negotiation room exists.
- Schools are A-rated — typically a magnet for longer-tenancy family renters. What's the average tenant stay here, and is there a school-zone premium baked into asking?
- What's the average days-on-market for RENTAL listings here right now (not sales)? A rising rental-DOM trend means longer vacancies and softer asking-rent achievability than the comps imply.
- What's the recent tenant-quality profile in this submarket — average credit score on applications, eviction rate, late-payment / NSF rate, and stable-employment percentage? A property-management company in the area should have these aggregated.
- How much new for-sale + rental construction is in the pipeline within 1–3 miles? Heavy new supply typically softens prices + rents 12–24 months out; constrained supply supports both.
Investment metrics
- 1% rule
- 1.04% ✓
- Cap rate
- 7.87%
- Cash-on-cash
- 5.65%
- DSCR
- 1.25
- GRM
- 8.0
CMA / ARV
- ARV (median comp)
- $1,857,470
- List price
- $1,785,000
- Delta
- -3.90%
- Verdict
- FAIR
- Comps
- 19 within 1.0 mi
Show comp detail 3 sales within ~0.75 mi
| Address | Dist | Beds/Ba | Sqft | Sold | Price | $/sf | Match |
|---|---|---|---|---|---|---|---|
| 58 Old Depot | 0.52mi | 3/2.5 (-1) | 2,156 (+3%) | 3mo | $1,325,000 | $615 | 62 |
| 20 Foster Rd | 0.38mi | 3/3.0 (-1) | 2,241 (+7%) | 17mo | $1,725,000 | $770 | 52 |
| 8 Hidden Path | 0.63mi | 4/2.0 | 2,406 (+14%) | 6mo | $1,210,000 | $503 | 37 |
Match score weights: distance 35% · size 25% · config 20% · recency 20%. Top-matched comps best support the ARV.
Projected returns pro-forma
4.01% appreciation · 3.0% rent growth · sell at horizon
- IRR
- 15.3%
- Equity multiple
- 1.93×
- Total profit
- $462,686
- Equity at exit
- $906,340
- IRR
- 16.4%
- Equity multiple
- 3.65×
- Total profit
- $1,322,370
- Equity at exit
- $1,483,446
Cash invested: $499,800 (down + closing). Projections, not guarantees.
Landlord ↔ Tenant lean methodology
- Overall (STATE)
- 15 Strongly Tenant-Friendly
- State New York
- 15 Strongly Tenant-Friendly · D+10
- County
- — inherits STATE
- City
- — inherits STATE
ZIP-level market 11959
- Home prices YoY
- 1.1%
- Active inventory
- 37
- Price-to-rent
- 8.0×
Monthly cashflow live
- Estimated rent
- $18,594 high interval (Pro) →
- Mortgage (P&I)
- −$9,361
- Tax est. 1.5%
- −$2,231 /mo · $26,775/yr
- Insurance
- −$744
- HOA
- −$0
- Vacancy / Maint / Mgmt
- −$3,905
- Net cashflow
- $2,353
Break-even live
Sensitivity live
| Price | -10% $3,587 | -5% $2,970 | +0% $2,353 | +5% $1,736 | +10% $1,120 |
|---|---|---|---|---|---|
| Rent | -10% $884 | -5% $1,619 | +0% $2,353 | +5% $3,088 | +10% $3,822 |
| Rate | -1.0pp $3,252 | -0.5pp $2,807 | base $2,353 | +0.5pp $1,891 | +1.0pp $1,420 |
UW: 25.0% down · 7.5% · 30yr · 1.5% tax · 5.0% vac · 8.0% maint · 8.0% mgmt
Financing live
Cash to close
- Down payment
- $446,250
- Closing costs
- $53,550
- Reserves months
- —
- Total cash needed
- —
Loan-product check · same deal, 3 products live
Conventional
25% down · 7.5% · 30yr
- Down + closing
- —
- Monthly P&I
- —
- Monthly cashflow
- —
- DSCR
- —
- Eligible?
- —
Personal DTI + credit; lowest rate.
DSCR
20% down · 8.5% · 30yr
- Down + closing
- —
- Monthly P&I
- —
- Monthly cashflow
- —
- DSCR
- —
- Eligible?
- —
No personal income docs; deal must DSCR.
Hard money
10% down · 12.0% · 12mo
- Down + closing
- —
- Monthly P&I
- —
- Monthly cashflow
- —
- DSCR
- —
- Eligible?
- —
Short-term bridge; refi at stabilization.
Rent comps 15 comps
| Address | Beds | Baths | Sqft | Rent | $/sqft | DOM | Units | Dist |
|---|---|---|---|---|---|---|---|---|
| 24 Quogue Riverhead Rd Quogue, NY | 3.0 | 3.0 | 2054 | $15,000 | $7.30 | 26d | 1 | 0.19mi |
| 2941 Quogue Riverhead Rd East Quogue, NY | 3.0 | 2.5 | 2044 | $80,000 | $39.14 | 26d | 1 | 0.67mi |
| 718 Montauk Hwy East Quogue, NY | 5.0 | 2.0 | 2500 | $25,000 | $10.00 | 26d | 1 | 0.85mi |
| 8 Paynes Ln East Quogue, NY | 4.0 | 2.0 | 1776 | $18,000 | $10.14 | 45d | 1 | 1.00mi |
| 1 Whippoorwill Ln East Quogue, NY | 4.0 | 4.0 | 2483 | $29,000 | $11.68 | 7d | 1 | 1.01mi |
| 11 Post Xing East Quogue, NY | 3.0 | 2.0 | 2926 | $20,000 | $6.84 | 20d | 1 | 1.01mi |
| 85 Lewis Rd East Quogue, NY | 3.0 | 2.0 | 1593 | $4,450 | $2.79 | 45d | 1 | 1.11mi |
| 131 Lewis Rd East Quogue, NY | 5.0 | 3.0 | 1541 | $12,000 | $7.79 | 20d | 1 | 1.12mi |
| 114 Spinney Rd East Quogue, NY | 4.0 | 3.0 | 2201 | $18,000 | $8.18 | 20d | 1 | 1.26mi |
| 16 Vail Ave East Quogue, NY | 5.0 | 2.0 | 1796 | $4,500 | $2.51 | 45d | 1 | 1.33mi |
| 10 Fox Hollow Dr East Quogue, NY | 4.0 | 3.5 | 2750 | $30,000 | $10.91 | 45d | 1 | 1.37mi |
| 21 Bayside Ave East Quogue, NY | 4.0 | 3.0 | 2900 | $14,000 | $4.83 | 45d | 1 | 1.39mi |
| 36 Walker Ave East Quogue, NY | 5.0 | 3.0 | 2500 | $23,000 | $9.20 | 9d | 1 | 1.40mi |
| 2 Bayside Ave East Quogue, NY | 4.0 | 3.0 | 2280 | $80,000 | $35.09 | 23d | 1 | 1.41mi |
| 69 Whippoorwill Ln Patchogue, NY | 4.0 | 4.0 | 2945 | $20,000 | $6.79 | 0d | 1 | 1.45mi |
Listing history 10 events
-
2026-06-13statusdays on market $1,785,000 Pending 28 DOM
-
2026-06-09days on market $1,785,000 Active 26 DOM
-
2026-06-08days on market $1,785,000 Active 25 DOM
-
2026-06-07days on market $1,785,000 Active 24 DOM
-
2026-06-04days on market $1,785,000 Active 21 DOM
-
2026-06-03days on market $1,785,000 Active 20 DOM
-
2026-06-02days on market $1,785,000 Active 19 DOM
-
2026-06-01days on market $1,785,000 Active 18 DOM
-
2026-05-31days on market $1,785,000 Active 17 DOM
-
2026-04-30$1,785,000 Active 733-char remark
ⓘ Source: listings_history table (triggers on properties + properties_extension) + one-shot
backfill from property_details.listing_events for pre-trigger history.
Climate risk First Street
- Flood 1/10 Low FEMA zone X (unshaded) · 0% chance over 30 yrs
- Wildfire 1/10 Low
- Heat 4/10 Moderate 7 d/yr ≥90°F today · 19 d/yr by 30 yrs out
- Wind 8/10 Severe 80% chance of damaging wind over 30 yrs
- Air quality 2/10 Low 2 unhealthy d/yr today · 2 by 30 yrs out
Nearby sold comps map
Loading sold comps map…
Walkable amenities ~0.75 mi
Loading nearby amenities…
Taxation est. · year 1
- Rental income
- $223,122
- − Mortgage interest
- −$99,988
- − Property taxes
- −$26,775
- − Insurance
- −$8,925
- − Repairs & maintenance
- −$17,850
- − Management
- −$17,850
- − Depreciation
- −$51,927
- Taxable loss
- −$192
- Est. tax savings @ 24.0%
- +$46
- After-tax cash flow
- $28,284/yr
For passive investors: Depreciation is non-cash, so a rental often shows a tax loss while cash-flowing — sheltering income. Rental losses are passive: they offset passive income freely, and up to $25,000/yr can offset ordinary (W-2) income if you actively participate and your MAGI is under $100k (phasing out to $0 by $150k); unused losses carry forward. On sale, claimed depreciation is recaptured at up to 25%, and gains may owe capital-gains tax (a 1031 exchange can defer both). Figures are a year-1 estimate at your 24.0% rate — not tax advice; consult a CPA.
Schools (NCES district)
- District
- Quogue Union Free School District
- NCES district ID
- 3624060
- Math proficiency
- 70% ▼ -10.00%
- Reading proficiency
- 80% ▬ 0.00%
- Median HH income
- $66,746
- Composite
- 66.09/100
- National rank
- #960
- State rank
- #125 of 755 in NY
Livability — Quogue
- Score
- 67/100
- State rank
- #600
- US rank
- #10895
Category grades
Schools grade is shown separately in the Schools card above.
Census & demographics
- Census place
- Quogue, NY
- City population
- 576
- Population (ZIP)
- 576
Population outlook (Suffolk County) Hauer SSP2
- Today (2025)
- 1,505,262 people
- By 2030
- 1,498,318 · -0.5%
- By 2040
- 1,471,101 · -2.3%
- By 2050
- 1,424,848 · -5.3%
- By 2075
- 1,337,157 · -11.2%
- By 2100
- 1,217,720 · -19.1%
Race, ethnicity, and origin ACS 2023
- Neighborhood character
- Predominantly White (71%)
- Race & ethnicity
- White 71% Two or more races 23% Hispanic / Latino 23% Black 3%
- Hispanic origin (detail)
- Common ancestry
- Italian 21% Portuguese 7% Scotch-Irish 4%
- Foreign-born
- 18% · Canada
- Languages at home
- 83% English-only · Spanish 17%
Political lean MEDSL · Suffolk
- 2024 margin
- Lean R (+10.0) · D 45.0% · R 55.0%
- 2008→2024 swing
- -16.0pp toward R · 2008: 6.0pp · 2024: -10.0pp
- All cycles
- 2024: R+10.0 2020: R+0.0 2016: R+8.2 2012: D+2.9 2008: D+6.0
Not yet ingested
- Civics
- —
Market trends
- HPI YoY
- ▲ 4.01%
- Current HPI
- 364.8746
- Rent YoY
- —
- Metro
- —
- State GDP YoY
- ▲ 2.60%
- F500 in state
- 92
Industry mix (Fortune 500 HQ in NY)
| Industry | F500 HQs | Revenue |
|---|---|---|
| Financial Services | 10 | $950B |
|
||
| Consumer Goods | 9 | $162B |
|
||
| Insurance | 4 | $225B |
|
||
| Telecommunications | 2 | $144B |
|
||
| Pharmaceuticals | 2 | $112B |
|
||
| Media / Entertainment | 2 | $69B |
|
||
Price history
2 events — show timeline
- 2026-06-11 Pending — OneKey® MLS as Distributed by MLS Grid
- 2026-04-30 Listed $1,785,000 OneKey® MLS as Distributed by MLS Grid
Property tax history
-1.1%/yrLatest (2025): $2,280 · +5.8% YoY. Source: county tax records.
Cash-flow waterfall
monthlySold comps — $/sqft
last 12 mo · ≤1 miLoading sold comps…