9568 State Route 97 Unit 9568 State Route 97, Callicoon, New York 12723 · Callicoon, NY
Flood risk 1/10 · Minimal
- FEMA flood zone
- X (unshaded)
- Chance of flooding over 30 yrs
- 0.0%
- Est. flood insurance / yr
- $473 – $860
Fire risk 3/10 · Minor
- Est. fire insurance / yr
- $691 – $1,283
Heat risk 2/10 · Minimal
- Hot days now (above 93°F)
- 7 days/yr
- Hot days in 30 yrs
- 14 days/yr
Wind risk 2/10 · Minimal
- Chance of severe wind over 30 yrs
- 1.0%
Air-quality risk 2/10 · Minimal
- Unhealthy air days now
- 0 days/yr
- Unhealthy air days in 30 yrs
- 1 days/yr
Risk factors via First Street. Map © Google.
Why this score? — see what drove the C+ grade
The composite is a weighted blend of 9 inputs, each scored 0–100. Each bar is that input's sub-score; the figure is the points it added to the 100-point composite (weight × sub-score).
- Cash flow +22.0/30.0
- Appreciation +10.0/10.0
- ARV discount +7.5/15.0
- DSCR +7.0/10.0
- 1% rule +5.8/10.0
- Schools +4.0/10.0
- Livability +2.8/5.0
- Rent growth +2.5/5.0
- Condition / age +2.2/5.0
$279,000
🖨 Deal sheet 📄 Offer letter ✓ Due diligence
Listing remarks
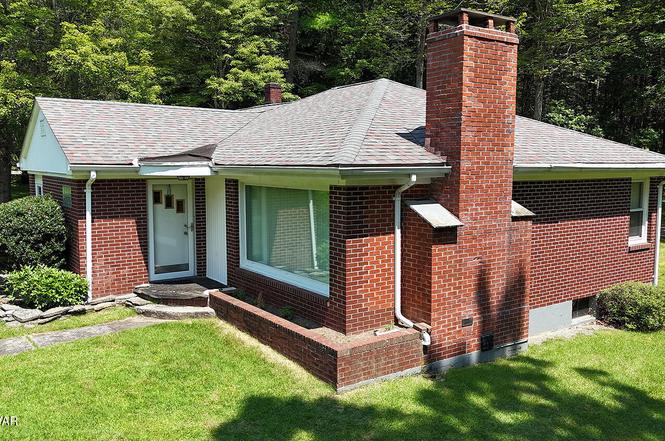
Life in the Callicoon Catskills doesn't get any better than this fine 2 bedroom brick ranch home surrounded by a level lawn and mature trees in a park-like setting. Easily accessed by a paved driveway which leads to a heated 2 car garage and breezeway. Inside find a well-designed kitchen with a comfortable dining room. The living room has a brick fireplace and a large picture window to enjoy nature. 2 large bedrooms and 1 full bath complete the first floor. Need space for hobbies or watching TV? Downstairs find a finished basement with family room/den with a large cedar closet (7.5x7.5), utility area with washer/dryer and a laundry chute. Home comes furnished-just move right in! Many upgra
Key facts
- Heated garage
- Level lawn
- Paved driveway
Tags
Property features AI
Finance
- Other: Additional parcel included (house and lot .43 acre; additional lot .30 acre); Public maintained paved road with state road frontage; Zoned residential
Exterior
- Parking: Attached heated garage with asphalt driveway; Garage door opener; 2 garage spaces
- Utilities: Private well water; Septic tank; Electricity connected; Cable available; Phone available
- Home design: Single-family house; One level; Has a view
- Construction: Brick and frame construction; Asphalt shingle roof; Concrete foundation; Built as a house (structure type)
- Exterior features: Private yard; Back yard; Level lot with few trees; Cleared lot
Interior
- Kitchen: Dishwasher; Electric range; Refrigerator
- Flooring: Carpet; Tile
- Bathrooms: 1 full bathroom
- Heating & cooling: Baseboard heating; Hot water heating
- Interior features: Cedar closets; Finished walk-out basement; Fireplace in the living room
- Laundry & utility: Washer and dryer; Laundry in basement; Electric water heater
Neighborhood map
What this means for you Summary
Snapshot
- This is a 2-bed/1.0-bath single-family listed at $279k. Condition is rated fair.
Deal economics
- At list price, monthly cash flow is $442 ($5k/yr) — positive.
- The deal already cash-flows at list — no discount required.
- Meets the 1% rule at list price ($3k rent vs $279k).
- Recommended offer: $246k (12.0% below list) — sets the bar for market timing.
Location & tenants
- Location reads 55/100 on livability (#1,135 in NY) — a working-class tenant base; expect higher turnover. Strengths: cost of living A+; Watch: schools C-, crime F, amenities F.
- Sullivan West Central School District (rural): math 45% / reading 47% proficiency, ranked #436 of 590 in NY (top 74%) — families likely to look elsewhere, expect single-tenant / working-renter base with shorter leases.
- Market conditions: 39 active listings in the ZIP; 1 comparable units currently listed for rent nearby; 739 units permitted in Sullivan County in 2024 (5 in 5+ unit buildings).
Forward outlook
- In year one you build about $30k of equity ($2k loan paydown + $28k appreciation (10.0% local appreciation)).
- Sullivan County population projected at -24% by 2050 — secular population decline; favor cash flow + early exit over multi-decade hold.
- At projected returns (10.0% appreciation + 3.0% rent growth), your $78k cash investment doubles in ~3 years — after that, you're playing with house money.
- By year 2, paydown + projected appreciation supports a ~$48k cash-out refi (75% LTV) — recoverable capital for the next deal without selling this one.
Negotiation context
- It's been on market 229 days — a 12% lower offer ($246k) is reasonable based on typical stale-listing flexibility.
Questions for the listing agent
- It's been on market 229 days. Have you received any prior offers? Is the seller open to a 12% concession, seller financing, or rate buy-down credit?
- Have any recent inspections been done? Can we get a copy of the seller's disclosures and any deferred-maintenance estimates?
- Built in 1973 — when were the roof, HVAC, electrical panel, plumbing, and water heater last replaced?
- Why hasn't it sold? Are there any deal-killer items the seller is aware of (foundation, flood, title, zoning, code violations)?
- Is there a deadline driving the sale (1031 exchange, divorce, estate, relocation)? That informs how much negotiation room exists.
- Crime grade is F in this area — have there been break-ins, vandalism, or insurance claims at this property in the last 3 years? What carrier currently insures it and at what premium?
- What's the average days-on-market for RENTAL listings here right now (not sales)? A rising rental-DOM trend means longer vacancies and softer asking-rent achievability than the comps imply.
- What's the recent tenant-quality profile in this submarket — average credit score on applications, eviction rate, late-payment / NSF rate, and stable-employment percentage? A property-management company in the area should have these aggregated.
- How much new for-sale + rental construction is in the pipeline within 1–3 miles? Heavy new supply typically softens prices + rents 12–24 months out; constrained supply supports both.
Investment metrics
- 1% rule
- 1.08% ✓
- Cap rate
- 8.19%
- Cash-on-cash
- 6.79%
- DSCR
- 1.30
- GRM
- 7.8
CMA / ARV
No comps found within radius.
Projected returns pro-forma
10.0% appreciation · 3.0% rent growth · sell at horizon
- IRR
- 29.2%
- Equity multiple
- 3.31×
- Total profit
- $180,140
- Equity at exit
- $251,345
- IRR
- 25.4%
- Equity multiple
- 7.51×
- Total profit
- $508,441
- Equity at exit
- $542,036
Cash invested: $78,120 (down + closing). Projections, not guarantees.
Landlord ↔ Tenant lean methodology
- Overall (STATE)
- 15 Strongly Tenant-Friendly
- State New York
- 15 Strongly Tenant-Friendly · D+10
- County
- — inherits STATE
- City
- — inherits STATE
ZIP-level market 12723
- Home prices YoY
- 23.4%
- Active inventory
- 39
- Price-to-rent
- 7.8×
Monthly cashflow live
- Estimated rent
- $3,000 medium interval (Pro) →
- Mortgage (P&I)
- −$1,463
- Tax est. 1.5%
- −$349 /mo · $4,185/yr
- Insurance
- −$116
- HOA
- −$0
- Vacancy / Maint / Mgmt
- −$630
- Net cashflow
- $442
Break-even live
UW: 25.0% down · 7.5% · 30yr · 1.5% tax · 5.0% vac · 8.0% maint · 8.0% mgmt
Financing live
Cash to close
- Down payment
- $69,750
- Closing costs
- $8,370
- Reserves months
- —
- Total cash needed
- —
Loan-product check · same deal, 3 products live
Conventional
25% down · 7.5% · 30yr
- Down + closing
- —
- Monthly P&I
- —
- Monthly cashflow
- —
- DSCR
- —
- Eligible?
- —
Personal DTI + credit; lowest rate.
DSCR
20% down · 8.5% · 30yr
- Down + closing
- —
- Monthly P&I
- —
- Monthly cashflow
- —
- DSCR
- —
- Eligible?
- —
No personal income docs; deal must DSCR.
Hard money
10% down · 12.0% · 12mo
- Down + closing
- —
- Monthly P&I
- —
- Monthly cashflow
- —
- DSCR
- —
- Eligible?
- —
Short-term bridge; refi at stabilization.
Rent comps 1 comps
| Address | Beds | Baths | Sqft | Rent | $/sqft | DOM | Units | Dist |
|---|---|---|---|---|---|---|---|---|
| 22 Mill St Callicoon, NY | 3.0 | 2.0 | 1470 | $3,000 | $2.04 | 43d | 1 | 1.34mi |
Listing history 11 events
-
2026-06-09statusdays on market $279,000 Pending 229 DOM
-
2026-06-08days on market $279,000 Active 228 DOM
-
2026-06-07days on market $279,000 Active 227 DOM
-
2026-06-07days on market $279,000 Active 226 DOM
-
2026-06-04days on market $279,000 Active 223 DOM
-
2026-06-02days on market $279,000 Active 222 DOM
-
2026-06-01days on market $279,000 Active 221 DOM
-
2026-05-31days on market $279,000 Active 220 DOM
-
2026-03-20price $279,000
-
2025-12-22price $289,000
-
2025-10-23$299,000 Active
ⓘ Source: listings_history table (triggers on properties + properties_extension) + one-shot
backfill from property_details.listing_events for pre-trigger history.
Climate risk First Street
- Flood 1/10 Low FEMA zone X (unshaded) · 0% chance over 30 yrs
- Wildfire 3/10 Moderate
- Heat 2/10 Low 7 d/yr ≥93°F today · 14 d/yr by 30 yrs out
- Wind 2/10 Low 100% chance of damaging wind over 30 yrs
- Air quality 2/10 Low 0 unhealthy d/yr today · 1 by 30 yrs out
Nearby sold comps map
Loading sold comps map…
Walkable amenities ~0.75 mi
Loading nearby amenities…
Taxation est. · year 1
- Rental income
- $36,000
- − Mortgage interest
- −$15,628
- − Property taxes
- −$4,185
- − Insurance
- −$1,395
- − Repairs & maintenance
- −$2,880
- − Management
- −$2,880
- − Depreciation
- −$8,116
- Taxable income
- $915
- Est. tax owed @ 24.0%
- −$220
- After-tax cash flow
- $5,083/yr
For passive investors: Depreciation is non-cash, so a rental often shows a tax loss while cash-flowing — sheltering income. Rental losses are passive: they offset passive income freely, and up to $25,000/yr can offset ordinary (W-2) income if you actively participate and your MAGI is under $100k (phasing out to $0 by $150k); unused losses carry forward. On sale, claimed depreciation is recaptured at up to 25%, and gains may owe capital-gains tax (a 1031 exchange can defer both). Figures are a year-1 estimate at your 24.0% rate — not tax advice; consult a CPA.
Condition & rehab AI · 13 photos
The home is in fair condition with some repairs and maintenance needed. Painting the exterior and interior, replacing the carpet and kitchen cabinets would significantly increase its resale value.
Repairs flagged
- Minor Kitchen cabinets — The kitchen cabinets appear to be in fair condition with some wear.
- Minor Living room carpet — The living room carpet appears to be in fair condition with some wear.
- Minor Exterior paint — The exterior paint appears to be in fair condition with some discoloration and minor wear.
- Minor Interior paint — The interior paint appears to be in fair condition with some discoloration and minor wear.
Value-add opportunities
- Resale Paint exterior — Painting the exterior can improve the curb appeal and make the home look more inviting to potential buyers.
- Resale Replace carpet in living room — Replacing the carpet in the living room can improve the overall look and feel of the home and make it more appealing to potential buyers.
- Resale Replace kitchen cabinets — Replacing the kitchen cabinets can improve the overall look and feel of the home and make it more appealing to potential buyers.
- Resale Paint interior walls — Painting the interior walls can improve the overall look and feel of the home and make it more appealing to potential buyers.
Renovation cost estimate screening
| Repair item | Severity | Est. cost |
|---|---|---|
| Kitchen cabinets · The kitchen cabinets appear to be in fair condition with some wear. | Minor | $500–3,000 |
| Living room carpet · The living room carpet appears to be in fair condition with some wear. | Minor | $500–3,000 |
| Exterior paint · The exterior paint appears to be in fair condition with some discoloration and minor wear. | Minor | $500–3,000 |
| Interior paint · The interior paint appears to be in fair condition with some discoloration and minor wear. | Minor | $500–3,000 |
| Total estimated repair cost · 4 items | $2,000–12,000 |
Value-add ROI direction
- Resale Paint exterior — Painting the exterior can improve the curb appeal and make the home look more inviting to potential buyers. ↑
- Resale Replace carpet in living room — Replacing the carpet in the living room can improve the overall look and feel of the home and make it more appealing to potential buyers. ↑
- Resale Replace kitchen cabinets — Replacing the kitchen cabinets can improve the overall look and feel of the home and make it more appealing to potential buyers. ↑
- Resale Paint interior walls — Painting the interior walls can improve the overall look and feel of the home and make it more appealing to potential buyers. ↑
ⓘ Cost ranges are severity-bucket heuristics (US national rule-of-thumb). Get contractor quotes + a written scope before underwriting a rehab budget.
Schools (NCES district)
- District
- Sullivan West Central School District
- NCES district ID
- 3600023
- Math proficiency
- 45% ▼ -7.00%
- Reading proficiency
- 47% ▼ -2.00%
- Median HH income
- $56,078
- Composite
- 40.05/100
- National rank
- #3817
- State rank
- #436 of 590 in NY
Livability — Callicoon
- Score
- 55/100
- State rank
- #1135
- US rank
- #23427
Category grades
Schools grade is shown separately in the Schools card above.
Census & demographics
- Population (ZIP)
- 1,854
Population outlook (Sullivan County) Hauer SSP2
- Today (2025)
- 68,974 people
- By 2030
- 65,609 · -4.9%
- By 2040
- 58,878 · -14.6%
- By 2050
- 52,500 · -23.9%
- By 2075
- 39,941 · -42.1%
- By 2100
- 28,880 · -58.1%
Race, ethnicity, and origin ACS 2023
- Neighborhood character
- Predominantly White (73%)
- Race & ethnicity
- White 73% Black 14% Hispanic / Latino 8% Two or more races 7%
- Hispanic origin (detail)
- Mexican 1% Puerto Rican 3%
- Common ancestry
- Romanian 4% Subsaharan African 3% Lithuanian 3%
- Foreign-born
- 8% · Canada, China
- Languages at home
- 89% English-only · Spanish 5% Russian/Polish/Slavic 3% French/Haitian/Cajun 2%
Political lean MEDSL · Sullivan
- 2024 margin
- R (+16.7) · D 41.6% · R 58.4%
- 2008→2024 swing
- -26.2pp toward R · 2008: 9.5pp · 2024: -16.7pp
- All cycles
- 2024: R+16.7 2020: R+9.2 2016: R+13.7 2012: D+10.4 2008: D+9.5
Not yet ingested
- Civics
- —
Market trends
- HPI YoY
- ▲ 64.22%
- Current HPI
- 339.0364
- Rent YoY
- —
- Metro
- —
- State GDP YoY
- ▲ 2.60%
- F500 in state
- 92
Industry mix (Fortune 500 HQ in NY)
| Industry | F500 HQs | Revenue |
|---|---|---|
| Financial Services | 10 | $950B |
|
||
| Consumer Goods | 9 | $162B |
|
||
| Insurance | 4 | $225B |
|
||
| Telecommunications | 2 | $144B |
|
||
| Pharmaceuticals | 2 | $112B |
|
||
| Media / Entertainment | 2 | $69B |
|
||
Price history
-6.7% since first listed3 events — show timeline
- 2026-03-20 Price Changed $279,000 PWMLS
- 2025-12-22 Price Changed $289,000 PWMLS
- 2025-10-23 Listed $299,000 PWMLS
Cash-flow waterfall
monthlySold comps — $/sqft
last 12 mo · ≤1 miLoading sold comps…