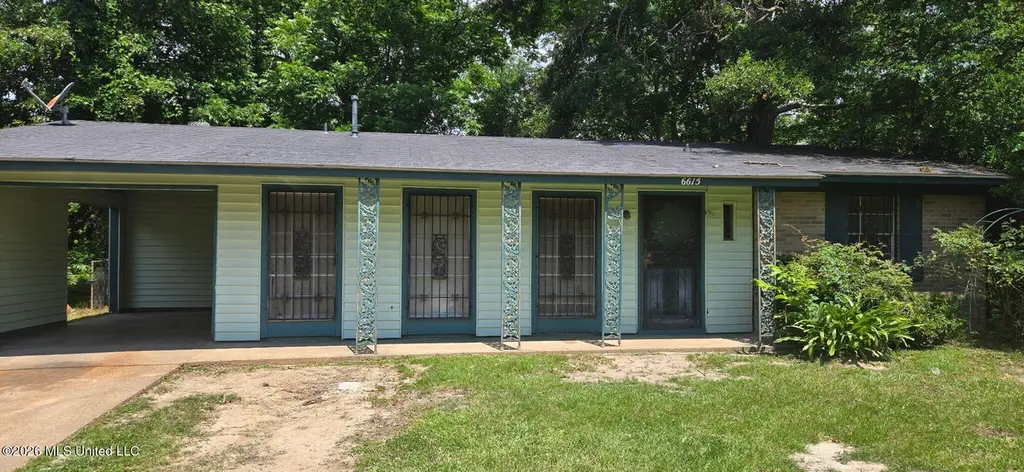
6615 Lyndon B Johnson Dr · Jackson, MS
Flood risk 6/10 · Moderate
- FEMA flood zone
- X (unshaded)
- Chance of flooding over 30 yrs
- 0.71%
- Est. flood insurance / yr
- $507 – $1,088
Fire risk 3/10 · Minor
- Est. fire insurance / yr
- $1,241 – $2,305
Heat risk 7/10 · Major
- Hot days now (above 107°F)
- 7 days/yr
- Hot days in 30 yrs
- 20 days/yr
Wind risk 8/10 · Major
- Chance of severe wind over 30 yrs
- 80.0%
Air-quality risk 1/10 · Minimal
- Unhealthy air days now
- 0 days/yr
- Unhealthy air days in 30 yrs
- 0 days/yr
Risk factors via First Street. Map © Google.
Why this score? — see what drove the A- grade
The composite is a weighted blend of 9 inputs, each scored 0–100. Each bar is that input's sub-score; the figure is the points it added to the 100-point composite (weight × sub-score).
- Cash flow +30.0/30.0
- ARV discount +14.0/15.0
- 1% rule +10.0/10.0
- DSCR +10.0/10.0
- Appreciation +10.0/10.0
- Livability +3.4/5.0
- Rent growth +2.5/5.0
- Condition / age +2.5/5.0
- Schools +1.1/10.0
$74,900
🖨 Deal sheet 📄 Offer letter ✓ Due diligence
Listing remarks MLS
Short Sale, great opportunity for an investor! Tenant occupied. 3 bedrooms, 1 bath in Presidential Hills. In good condition.
Key facts
- Central hvac
- Brick exterior
- Carport parking
Tags
Property features AI
Finance
- Other: Lot is level with few trees on a city lot (about 0.2 acres)
Exterior
- Parking: Carport (1 space); Paved parking
- Utilities: Public water; Public sewer; Electricity connected; Natural gas connected; Cable connected; Underground utilities
- Home design: Single family residence (house); One level
- Construction: Brick construction; Asphalt shingle roof; Slab foundation; Built (year per public records)
- Exterior features: Private yard; Back yard fencing; Rain gutters; Slab patio/porch
Interior
- Kitchen: Electric cooktop; Oven
- Flooring: Carpet
- Bathrooms: One full bathroom; One half bathroom
- Heating & cooling: Central heating (natural gas); Central air conditioning
- Interior features: Eat-in kitchen; Aluminum window frames; Lighting
- Laundry & utility: Laundry closet with washer hookup on the main level; Gas water heater
Neighborhood map
What this means for you Summary
Snapshot
- This is a 3-bed/2.0-bath single-family listed at $75k.
Deal economics
- At list price, monthly cash flow is $362 ($4k/yr) — positive.
- The deal already cash-flows at list — no discount required.
- Meets the 1% rule at list price ($1k rent vs $75k).
- Recommended offer: $74k (1.5% below list) — sets the bar for market timing.
- Cap rate 12.1% vs local median 9.9% in Jackson — meaningfully above typical; check what's discounted (condition, days-on-market, listing class) to confirm the premium yield is real.
Location & tenants
- Location reads 68/100 on livability (#66 in MS) — a middle-class / working-renter tenant base. Strengths: commute A+, cost of living A+, housing A+; Watch: amenities F, employment F, health & safety F.
- Jackson Public School District (urban): math 9% / reading 18% proficiency, ranked #112 of 130 in MS (top 86%) — low school quality limits family demand, transient renter base, plan for 1-2y turnover; 88% free/reduced lunch — lower-income household profile, screen leases tightly.
- Zoned schools: Raines Elementary School (math 2% / reading 12%, grade F, #337 of 375 statewide, top 94%, 224 students, 100% FRL); Northwest Middle School (math 31% / reading 52%, grade F, #53 of 179 statewide, top 30%, 206 students, 100% FRL); Callaway High School (math 3% / reading 10%, grade F, #191 of 197 statewide, top 97%, 923 students, 100% FRL).
- Market conditions: 81 active listings in the ZIP; 6 comparable units currently listed for rent nearby; rentals leasing fast (median 14d on market — plan ~1-2 weeks tenant-placement turnaround); lower-income renter base — watch delinquency; 167 units permitted in Hinds County in 2024 (0 in 5+ unit buildings).
- At $1,135/mo this rent would consume 46% of the median local household income ($30k/yr) (locally 1138% of renters already pay >50% of income on rent) — very limited rent-growth headroom before tenants either downsize or default.
Forward outlook
- In year one you build about $8k of equity ($518 loan paydown + $7k appreciation (10.0% local appreciation)).
- Hinds County population projected to shrink 6% by 2050 — rents likely to lag national; underwrite the cash flow, not the appreciation.
- At projected returns (10.0% appreciation + 3.0% rent growth), your $21k cash investment doubles in ~2 years — after that, you're playing with house money.
- By year 5, paydown + projected appreciation supports a ~$37k cash-out refi (75% LTV) — recoverable capital for the next deal without selling this one.
Negotiation context
- It's been on market 29 days — a 2% lower offer ($74k) is reasonable based on typical stale-listing flexibility.
- 3 sale attempts since 19y ago with the ask held roughly flat each time — persistent listings suggest the price (not the market) is what's stuck; bring a comps-based counter.
Risks & watch-outs
- Climate carrying-cost: major flood risk; severe wind risk, 80% chance of damaging wind over 30y; extreme-heat days projected 7→20/yr by 2055 (HVAC capex compounding) — expect insurance premiums to compound above CPI over the hold.
Questions for the listing agent
- Built in 1970 — when were the roof, HVAC, electrical panel, plumbing, and water heater last replaced?
- Is there a deadline driving the sale (1031 exchange, divorce, estate, relocation)? That informs how much negotiation room exists.
- Schools are F-rated, which usually means shorter tenancies and higher turnover. Who's the typical renter profile here, and what's been the actual vacancy rate?
- What's the average days-on-market for RENTAL listings here right now (not sales)? A rising rental-DOM trend means longer vacancies and softer asking-rent achievability than the comps imply.
- What's the recent tenant-quality profile in this submarket — average credit score on applications, eviction rate, late-payment / NSF rate, and stable-employment percentage? A property-management company in the area should have these aggregated.
- How much new for-sale + rental construction is in the pipeline within 1–3 miles? Heavy new supply typically softens prices + rents 12–24 months out; constrained supply supports both.
Investment metrics
- 1% rule
- 1.52% ✓
- Cap rate
- 12.09%
- Cash-on-cash
- 20.69%
- DSCR
- 1.92
- GRM
- 5.5
CMA / ARV
- ARV (on-the-fly)
- $87,444
- Comps found
- 5
Show comp detail 5 sales within ~0.75 mi
| Address | Dist | Beds/Ba | Sqft | Sold | Price | $/sf | Match |
|---|---|---|---|---|---|---|---|
| 6603 Lyndon B Johnson Dr | 0.04mi | 3/1.0 | 1,039 (-0%) | 3mo | $89,900 | $87 | 92 |
| 6634 Lyndon B Johnson Dr | 0.06mi | 3/2.0 | 1,120 (+8%) | 6mo | $107,000 | $96 | 79 |
| 375 James Garfield Cir | 0.31mi | 3/1.5 | 1,076 (+3%) | 1mo | $89,900 | $84 | 77 |
| 6505 Lyndon B. Johnson Drive Dr | 0.26mi | 3/1.5 | 1,036 (-0%) | 15mo | $87,000 | $84 | 73 |
| 345 William Mckinley Cir | 0.47mi | 3/1.5 | 1,166 (+12%) | 1mo | $72,000 | $62 | 55 |
Match score weights: distance 35% · size 25% · config 20% · recency 20%. Top-matched comps best support the ARV.
Projected returns pro-forma
10.0% appreciation · 3.0% rent growth · sell at horizon
- IRR
- 39.7%
- Equity multiple
- 4.04×
- Total profit
- $63,855
- Equity at exit
- $67,476
- IRR
- 34.3%
- Equity multiple
- 9.11×
- Total profit
- $169,982
- Equity at exit
- $145,514
Cash invested: $20,972 (down + closing). Projections, not guarantees.
Landlord ↔ Tenant lean methodology
- Overall (STATE)
- 90 Strongly Landlord-Friendly
- State Mississippi
- 90 Strongly Landlord-Friendly · R+11
- County
- — inherits STATE
- City
- — inherits STATE
ZIP-level market 39213
- Home prices YoY
- 7.0%
- Active inventory
- 81
- Price-to-rent
- 5.5×
Monthly cashflow live
- Estimated rent
- $1,135 high interval (Pro) →
- Mortgage (P&I)
- −$393
- Tax from tax record
- −$111 /mo · $1,332/yr
- Insurance
- −$31
- HOA
- −$0
- Vacancy / Maint / Mgmt
- −$238
- Net cashflow
- $362
Break-even live
UW: 25.0% down · 7.5% · 30yr · 1.5% tax · 5.0% vac · 8.0% maint · 8.0% mgmt
Financing live
Cash to close
- Down payment
- $18,725
- Closing costs
- $2,247
- Reserves months
- —
- Total cash needed
- —
Loan-product check · same deal, 3 products live
Conventional
25% down · 7.5% · 30yr
- Down + closing
- —
- Monthly P&I
- —
- Monthly cashflow
- —
- DSCR
- —
- Eligible?
- —
Personal DTI + credit; lowest rate.
DSCR
20% down · 8.5% · 30yr
- Down + closing
- —
- Monthly P&I
- —
- Monthly cashflow
- —
- DSCR
- —
- Eligible?
- —
No personal income docs; deal must DSCR.
Hard money
10% down · 12.0% · 12mo
- Down + closing
- —
- Monthly P&I
- —
- Monthly cashflow
- —
- DSCR
- —
- Eligible?
- —
Short-term bridge; refi at stabilization.
Rent comps 6 comps
| Address | Beds | Baths | Sqft | Rent | $/sqft | DOM | Units | Dist |
|---|---|---|---|---|---|---|---|---|
| 6605 George Washington Dr Jackson, MS | 3.0 | 2.0 | 1247 | $950 | $0.76 | 13d | 1 | 0.11mi |
| 6521 Lyndon B Johnson Dr Jackson, MS | 3.0 | 1.0 | 1180 | $1,150 | $0.97 | 23d | 1 | 0.22mi |
| 6521 Lyndon B Johnson Dr Jackson, MS | 3.0 | 1.0 | 1180 | $1,100 | $0.93 | 13d | 1 | 0.22mi |
| 6731 George Washington Dr Jackson, MS | 3.0 | 2.0 | 1134 | $1,300 | $1.15 | 23d | 1 | 0.37mi |
| 6731 George Washington Dr Jackson, MS | 3.0 | 2.0 | 1134 | $1,200 | $1.06 | 13d | 1 | 0.37mi |
| 6513 Abraham Lincoln Dr Jackson, MS | 3.0 | 1.5 | 1330 | $950 | $0.71 | 13d | 1 | 0.41mi |
Listing history 27 events
-
2026-06-18days on market $74,900 Active 29 DOM
-
2026-06-17days on market $74,900 Active 28 DOM
-
2026-06-16days on market $74,900 Active 27 DOM
-
2026-06-15days on market $74,900 Active 26 DOM
-
2026-06-14days on market $74,900 Active 24 DOM
-
2026-06-13days on market $74,900 Active 23 DOM
-
2026-06-10days on market $74,900 Active 21 DOM
-
2026-06-09days on market $74,900 Active 20 DOM
-
2026-06-08days on market $74,900 Active 19 DOM
-
2026-06-07days on market $74,900 Active 18 DOM
-
2026-06-05days on market $74,900 Active 15 DOM
-
2026-06-03days on market $74,900 Active 14 DOM
-
2026-06-02days on market $74,900 Active 13 DOM
-
2026-06-01days on market $74,900 Active 12 DOM
-
2026-05-31days on market $74,900 Active 11 DOM
-
2026-05-30days on market $74,900 Active 10 DOM
-
2026-05-20$74,900 Active
-
2022-01-24soldstatus
-
2018-04-16soldstatus 124-char remark
Show marketing remark (124 chars)
Short Sale, great opportunity for an investor! Tenant occupied. 3 bedrooms, 1 bath in Presidential Hills. In good condition.
-
2018-02-14$15,000 124-char remark
Show marketing remark (124 chars)
Short Sale, great opportunity for an investor! Tenant occupied. 3 bedrooms, 1 bath in Presidential Hills. In good condition.
-
2007-11-27soldstatus
-
2007-10-26soldstatus 37-char remark
Show marketing remark (37 chars)
GREAT FOR INVESTOR. GOOD RENTAL AREA.
-
2007-10-25soldstatus
-
2007-06-04$24,900 37-char remark
Show marketing remark (37 chars)
GREAT FOR INVESTOR. GOOD RENTAL AREA.
-
2001-12-18soldstatus
-
1996-12-31soldstatus
-
1995-11-16soldstatus
ⓘ Source: listings_history table (triggers on properties + properties_extension) + one-shot
backfill from property_details.listing_events for pre-trigger history.
Tax reassessment forecast MS · Resets to sale price
- Current annual tax
- $1,332 · $111/mo
- Projected year-2 tax
- $1,332 · $111/mo
- Expected delta
- $0/yr ($0/mo · 0.0%)
ⓘ Screening estimate from a state-policy table — verify with the county assessor before closing.
Climate risk First Street
- Flood 6/10 Major FEMA zone X (unshaded) · 71% chance over 30 yrs
- Wildfire 3/10 Moderate
- Heat 7/10 Severe 7 d/yr ≥107°F today · 20 d/yr by 30 yrs out
- Wind 8/10 Severe 80% chance of damaging wind over 30 yrs
- Air quality 1/10 Low 0 unhealthy d/yr today · 0 by 30 yrs out
Nearby sold comps map
Loading sold comps map…
Walkable amenities ~0.75 mi
Loading nearby amenities…
Taxation est. · year 1
- Rental income
- $13,620
- − Mortgage interest
- −$4,196
- − Property taxes
- −$1,332
- − Insurance
- −$374
- − Repairs & maintenance
- −$1,090
- − Management
- −$1,090
- − Depreciation
- −$2,179
- Taxable income
- $3,360
- Est. tax owed @ 24.0%
- −$806
- After-tax cash flow
- $3,534/yr
For passive investors: Depreciation is non-cash, so a rental often shows a tax loss while cash-flowing — sheltering income. Rental losses are passive: they offset passive income freely, and up to $25,000/yr can offset ordinary (W-2) income if you actively participate and your MAGI is under $100k (phasing out to $0 by $150k); unused losses carry forward. On sale, claimed depreciation is recaptured at up to 25%, and gains may owe capital-gains tax (a 1031 exchange can defer both). Figures are a year-1 estimate at your 24.0% rate — not tax advice; consult a CPA.
Schools (NCES district)
- District
- Jackson Public School District
- NCES district ID
- 2802190
- Math proficiency
- 9% ▼ -14.00%
- Reading proficiency
- 18% ▼ -7.00%
- Median HH income
- $33,234
- Composite
- 10.89/100
- National rank
- #9755
- State rank
- #112 of 130 in MS
Livability — Jackson
- Score
- 68/100
- State rank
- #66
- US rank
- #9695
Category grades
Schools grade is shown separately in the Schools card above.
Census & demographics
- Census place
- Jackson, MS
- County
- Hinds County · 167,040 people
- City population
- 140,204
- Metro
- Jackson, MS
- Population (ZIP)
- 18,691
- Household income
- $29,541
- Rent vs Own
- Severe rent burden
- 1138.0
Population outlook (Hinds County) Hauer SSP2
- Today (2025)
- 242,528 people
- By 2030
- 241,113 · -0.6%
- By 2040
- 235,557 · -2.9%
- By 2050
- 226,946 · -6.4%
- By 2075
- 199,995 · -17.5%
- By 2100
- 164,165 · -32.3%
Race, ethnicity, and origin ACS 2023
- Neighborhood character
- Predominantly Black (95%)
- Race & ethnicity
- Black 95% White 2% Two or more races 1% Hispanic / Latino 1%
- Foreign-born
- 0% · Canada
- Languages at home
- 98% English-only · Spanish 2%
Political lean MEDSL · Hinds
- 2024 margin
- Solid D (+46.1) · D 72.4% · R 26.3% · Other 1.4%
- 2008→2024 swing
- +7.1pp toward D · 2008: 39.0pp · 2024: 46.1pp
- All cycles
- 2024: D+46.1 2020: D+48.3 2016: D+43.7 2012: D+45.1 2008: D+39.0
Not yet ingested
- Civics
- —
Market trends
- HPI YoY
- ▲ 21.42%
- Current HPI
- 329.1844
- Rent YoY
- —
- Metro
- Jackson, MS
- State GDP YoY
- —
- F500 in state
- 0
Price history
+200.8% since first listed11 events — show timeline
- 2026-05-20 Listed $74,900 MLSU
- 2022-01-24 Sold (Public Records) — Public Records
- 2018-04-16 Sold (MLS) — MLSU
- 2018-02-14 Listed $15,000 MLSU
- 2007-11-27 Sold (Public Records) — Public Records
- 2007-10-26 Sold (MLS) — MLSU
- 2007-10-25 Sold (Public Records) — Public Records
- 2007-06-04 Listed $24,900 MLSU
- 2001-12-18 Sold (Public Records) — Public Records
- 1996-12-31 Sold (Public Records) — Public Records
- 1995-11-16 Sold (Public Records) — Public Records
Property tax history
+1.0%/yrLatest (2025): $1,332 · +1.5% YoY. Source: county tax records.
Cash-flow waterfall
monthlySold comps — $/sqft
last 12 mo · ≤1 miLoading sold comps…