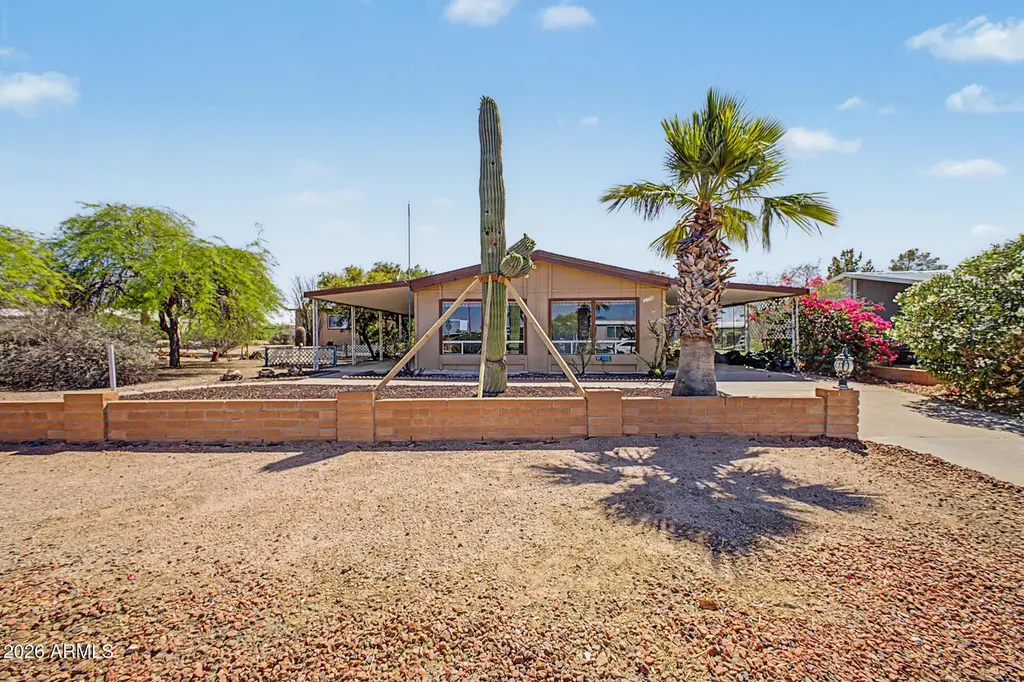
3709 N Florence Blvd · Florence, AZ
Flood risk 1/10 · Minimal
- FEMA flood zone
- X (unshaded)
- Chance of flooding over 30 yrs
- 0.0%
- Est. flood insurance / yr
- $507 – $1,088
Fire risk 5/10 · Moderate
- Est. fire insurance / yr
- $610 – $1,132
Heat risk 8/10 · Major
- Hot days now (above 112°F)
- 5 days/yr
- Hot days in 30 yrs
- 14 days/yr
Wind risk 1/10 · Minimal
- Chance of severe wind over 30 yrs
- —
Air-quality risk 2/10 · Minimal
- Unhealthy air days now
- 0 days/yr
- Unhealthy air days in 30 yrs
- 1 days/yr
Risk factors via First Street. Map © Google.
Why this score? — see what drove the B- grade
The composite is a weighted blend of 9 inputs, each scored 0–100. Each bar is that input's sub-score; the figure is the points it added to the 100-point composite (weight × sub-score).
- Cash flow +26.8/30.0
- ARV discount +15.0/15.0
- DSCR +9.2/10.0
- 1% rule +6.9/10.0
- Livability +3.0/5.0
- Rent growth +2.8/5.0
- Condition / age +2.5/5.0
- Schools +1.8/10.0
- Appreciation +0.0/10.0
$139,900
🖨 Deal sheet 📄 Offer letter ✓ Due diligence
Listing remarks MLS
Investor special, Great opportunity in the Florence Gardens 55+ community on a spacious 10,000 sq ft lot with garage. This property offers a chance to update and customize to your own style, making it ideal for a buyer looking to create value. The layout and lot size provide a strong foundation for improvements and renovation.
Key facts
- Spacious lot
- 0.23 acre lot
- Garage
Tags
Neighborhood map
What this means for you Summary
Snapshot
- This is a 2-bed/2.0-bath manufactured listed at $140k.
Deal economics
- At list price, monthly cash flow is $383 ($5k/yr) — positive.
- The deal already cash-flows at list — no discount required.
- Meets the 1% rule at list price ($2k rent vs $140k).
- Recommended offer: $136k (3.0% below list) — sets the bar for market timing.
- Cap rate 9.6% vs local median 4.2% in Florence — top-decile yield for the area; either an underpriced asset or a hidden risk that comps aren't pricing in. Stress-test before assuming the spread holds.
Location & tenants
- Location reads 60/100 on livability (#187 in AZ) — a middle-class / working-renter tenant base. Strengths: crime A+, cost of living A+, housing A+; Watch: schools F, amenities F, commute F.
- Florence Unified School District (4437) (rural): math 16% / reading 24% proficiency, ranked #178 of 249 in AZ (top 72%) — low school quality limits family demand, transient renter base, plan for 1-2y turnover.
- Market conditions: Rents rising (+1.3%/yr); 714 active listings in the ZIP; 1 comparable units currently listed for rent nearby; solid renter incomes; 9,504 units permitted in Pinal County in 2024 (776 in 5+ unit buildings).
Forward outlook
- Local home prices are declining (-3.0%/yr); year-one equity from $967 of loan paydown is wiped out by about $4k of value loss. Plan a longer hold.
Negotiation context
- It's been on market 32 days — a 3% lower offer ($136k) is reasonable based on typical stale-listing flexibility.
- Current owner paid $85k; list at $140k implies a 65% gain — meaningful room to come down on a strong offer.
Risks & watch-outs
- Climate carrying-cost: moderate wildfire risk; extreme-heat days projected 5→14/yr by 2055 (HVAC capex compounding) — expect insurance premiums to compound above CPI over the hold.
Questions for the listing agent
- It's been on market 32 days. Have you received any prior offers? Is the seller open to a 3% concession, seller financing, or rate buy-down credit?
- Built in 1979 — when were the roof, HVAC, electrical panel, plumbing, and water heater last replaced?
- What does the HOA fee cover, when was the last increase, and are there any pending special assessments or reserve-fund shortfalls?
- Is there a deadline driving the sale (1031 exchange, divorce, estate, relocation)? That informs how much negotiation room exists.
- Schools are F-rated, which usually means shorter tenancies and higher turnover. Who's the typical renter profile here, and what's been the actual vacancy rate?
- What's the average days-on-market for RENTAL listings here right now (not sales)? A rising rental-DOM trend means longer vacancies and softer asking-rent achievability than the comps imply.
- What's the recent tenant-quality profile in this submarket — average credit score on applications, eviction rate, late-payment / NSF rate, and stable-employment percentage? A property-management company in the area should have these aggregated.
- How much new for-sale + rental construction is in the pipeline within 1–3 miles? Heavy new supply typically softens prices + rents 12–24 months out; constrained supply supports both.
Investment metrics
- 1% rule
- 1.19% ✓
- Cap rate
- 9.58%
- Cash-on-cash
- 11.73%
- DSCR
- 1.52
- GRM
- 7.0
CMA / ARV
- ARV (median comp)
- $220,288
- List price
- $139,900
- Delta
- -36.49%
- Verdict
- UNDERPRICED
- Comps
- 20 within 1.0 mi
Show comp detail 12 sales within ~0.75 mi
| Address | Dist | Beds/Ba | Sqft | Sold | Price | $/sf | Match |
|---|---|---|---|---|---|---|---|
| 3703 N Colorado Ave | 0.07mi | 3/2.0 (+1) | 1,570 (+7%) | 0mo | $265,000 | $169 | 79 |
| 3716 N Montana Ave | 0.31mi | 3/2.0 (+1) | 1,457 (-0%) | 3mo | $150,000 | $103 | 77 |
| 806 E Pennsylvania Ave | 0.39mi | 3/2.0 (+1) | 1,457 (-0%) | 0mo | $174,900 | $120 | 76 |
| 3809 N Kansas Ave | 0.43mi | 2/2.0 | 1,501 (+2%) | 2mo | $198,500 | $132 | 74 |
| 812 E Lancaster Cir | 0.44mi | 3/2.0 (+1) | 1,457 (-0%) | 4mo | $260,000 | $178 | 70 |
| 3822 N Iowa Ave | 0.54mi | 2/2.0 | 1,429 (-2%) | 2mo | $280,000 | $196 | 69 |
| 800 E Mississippi St | 0.03mi | 3/2.0 (+1) | 1,260 (-14%) | 3mo | $210,000 | $167 | 68 |
| 813 E Pennsylvania Ave | 0.37mi | 3/2.0 (+1) | 1,569 (+7%) | 4mo | $180,000 | $115 | 63 |
| 3926 N Florence Blvd | 0.51mi | 2/2.0 | 1,561 (+7%) | 3mo | $255,000 | $163 | 62 |
| 808 E Pennsylvania Ave | 0.39mi | 2/2.0 | 1,249 (-15%) | 2mo | $196,500 | $157 | 56 |
| 3914 N Florence Blvd | 0.44mi | 2/2.0 | 1,248 (-15%) | 0mo | $205,000 | $164 | 54 |
| 3731 N Kansas Ave | 0.42mi | 3/2.0 (+1) | 1,249 (-15%) | 2mo | $195,000 | $156 | 49 |
Match score weights: distance 35% · size 25% · config 20% · recency 20%. Top-matched comps best support the ARV.
Projected returns pro-forma
-3.0% appreciation · 1.27% rent growth · sell at horizon
- IRR
- -0.8%
- Equity multiple
- 0.97×
- Total profit
- $-1,129
- Equity at exit
- $20,860
- IRR
- 7.0%
- Equity multiple
- 1.49×
- Total profit
- $19,126
- Equity at exit
- $12,096
Cash invested: $39,172 (down + closing). Projections, not guarantees.
Landlord ↔ Tenant lean methodology
- Overall (STATE)
- 87 Strongly Landlord-Friendly
- State Arizona
- 87 Strongly Landlord-Friendly · R+3
- County
- — inherits STATE
- City
- — inherits STATE
ZIP-level market 85132
- Home prices YoY
- -5.2%
- Rents YoY
- 1.3%
- Active inventory
- 714
- Price-to-rent
- 7.0×
Monthly cashflow live
- Estimated rent
- $1,670 medium interval (Pro) →
- Mortgage (P&I)
- −$734
- Tax from tax record
- −$43 /mo · $519/yr
- Insurance
- −$58
- HOA
- −$101
- Vacancy / Maint / Mgmt
- −$351
- Net cashflow
- $383
Break-even live
UW: 25.0% down · 7.5% · 30yr · 1.5% tax · 5.0% vac · 8.0% maint · 8.0% mgmt
Financing live
Cash to close
- Down payment
- $34,975
- Closing costs
- $4,197
- Reserves months
- —
- Total cash needed
- —
Loan-product check · same deal, 3 products live
Conventional
25% down · 7.5% · 30yr
- Down + closing
- —
- Monthly P&I
- —
- Monthly cashflow
- —
- DSCR
- —
- Eligible?
- —
Personal DTI + credit; lowest rate.
DSCR
20% down · 8.5% · 30yr
- Down + closing
- —
- Monthly P&I
- —
- Monthly cashflow
- —
- DSCR
- —
- Eligible?
- —
No personal income docs; deal must DSCR.
Hard money
10% down · 12.0% · 12mo
- Down + closing
- —
- Monthly P&I
- —
- Monthly cashflow
- —
- DSCR
- —
- Eligible?
- —
Short-term bridge; refi at stabilization.
Rent comps 1 comps
| Address | Beds | Baths | Sqft | Rent | $/sqft | DOM | Units | Dist |
|---|---|---|---|---|---|---|---|---|
| 3611 N Michigan Ave Florence, AZ | 2.0 | 1.5 | 1441 | $1,600 | $1.11 | 44d | 1 | 0.37mi |
HOA detail
- Monthly dues
- $101 · $1,212/yr
Listing history 6 events
-
2026-05-11status Pending 331-char remark
Show marketing remark (331 chars)
Investor special, Great opportunity in the Florence Gardens 55+ community on a spacious 10,000 sq ft lot with garage. This property offers a chance to update and customize to your own style, making it ideal for a buyer looking to create value. The layout and lot size provide a strong foundation for improvements and renovation.
-
2026-05-06price $139,900 331-char remark
Show marketing remark (331 chars)
Investor special, Great opportunity in the Florence Gardens 55+ community on a spacious 10,000 sq ft lot with garage. This property offers a chance to update and customize to your own style, making it ideal for a buyer looking to create value. The layout and lot size provide a strong foundation for improvements and renovation.
-
2026-04-09$149,000 Active 331-char remark
Show marketing remark (331 chars)
Investor special, Great opportunity in the Florence Gardens 55+ community on a spacious 10,000 sq ft lot with garage. This property offers a chance to update and customize to your own style, making it ideal for a buyer looking to create value. The layout and lot size provide a strong foundation for improvements and renovation.
-
2002-05-17soldstatus $85,000
-
2002-05-17soldstatus $85,000
-
1998-03-02soldstatus $77,500
ⓘ Source: listings_history table (triggers on properties + properties_extension) + one-shot
backfill from property_details.listing_events for pre-trigger history.
Tax reassessment forecast AZ · Resets to sale price
- Current annual tax
- $519 · $43/mo
- Projected year-2 tax
- $923 · $77/mo
- Expected delta
- +$405/yr (+$34/mo · 78.0%)
ⓘ Screening estimate from a state-policy table — verify with the county assessor before closing.
Climate risk First Street
- Flood 1/10 Low FEMA zone X (unshaded) · 0% chance over 30 yrs
- Wildfire 5/10 Major
- Heat 8/10 Severe 5 d/yr ≥112°F today · 14 d/yr by 30 yrs out
- Wind 1/10 Low
- Air quality 2/10 Low 0 unhealthy d/yr today · 1 by 30 yrs out
Nearby sold comps map
Loading sold comps map…
Walkable amenities ~0.75 mi
Loading nearby amenities…
Taxation est. · year 1
- Rental income
- $20,038
- − Mortgage interest
- −$7,837
- − Property taxes
- −$519
- − Insurance
- −$700
- − Repairs & maintenance
- −$1,603
- − Management
- −$1,603
- − HOA
- −$1,212
- − Depreciation
- −$4,070
- Taxable income
- $2,495
- Est. tax owed @ 24.0%
- −$599
- After-tax cash flow
- $3,997/yr
For passive investors: Depreciation is non-cash, so a rental often shows a tax loss while cash-flowing — sheltering income. Rental losses are passive: they offset passive income freely, and up to $25,000/yr can offset ordinary (W-2) income if you actively participate and your MAGI is under $100k (phasing out to $0 by $150k); unused losses carry forward. On sale, claimed depreciation is recaptured at up to 25%, and gains may owe capital-gains tax (a 1031 exchange can defer both). Figures are a year-1 estimate at your 24.0% rate — not tax advice; consult a CPA.
Schools (NCES district)
- District
- Florence Unified School District (4437)
- NCES district ID
- 0402920
- Math proficiency
- 16% ▼ -11.00%
- Reading proficiency
- 24% ▼ -7.00%
- Median HH income
- $54,426
- Composite
- 18.31/100
- National rank
- #8950
- State rank
- #178 of 249 in AZ
Livability — Florence
- Score
- 60/100
- State rank
- #187
- US rank
- #19483
Category grades
Schools grade is shown separately in the Schools card above.
Census & demographics
- Census place
- Florence, AZ
- County
- Pinal County · 399,947 people
- City population
- 38,671
- Metro
- Phoenix-Mesa-Chandler, AZ
- Population (ZIP)
- 38,671
- Household income
- $79,000
- Rent vs Own
- Severe rent burden
- 102.0
Population outlook (Pinal County) Hauer SSP2
- Today (2025)
- 437,574 people
- By 2030
- 446,903 · +2.1%
- By 2040
- 452,589 · +3.4%
- By 2050
- 444,126 · +1.5%
- By 2075
- 430,300 · -1.7%
- By 2100
- 393,536 · -10.1%
Race, ethnicity, and origin ACS 2023
- Neighborhood character
- Diverse neighborhood (Simpson 0.56)
- Race & ethnicity
- White 59% Hispanic / Latino 28% Two or more races 9% Black 7% Native American 3%
- Hispanic origin (detail)
- Mexican 23%
- Common ancestry
- Italian 5% Portuguese 2% Romanian 2%
- Foreign-born
- 9% · Canada
- Languages at home
- 79% English-only · Spanish 17% German/W. Germanic 1% Russian/Polish/Slavic 1%
Political lean MEDSL · Pinal
- 2024 margin
- Strong R (+22.1) · D 38.5% · R 60.6%
- 2008→2024 swing
- -7.6pp toward R · 2008: -14.5pp · 2024: -22.1pp
- All cycles
- 2024: R+22.1 2020: R+17.3 2016: R+19.3 2012: R+17.1 2008: R+14.5
Not yet ingested
- Civics
- —
Market trends
- HPI YoY
- ▼ -12.75%
- Current HPI
- 233.6644
- Rent YoY
- ▲ 1.27%
- Metro
- Phoenix-Mesa-Chandler, AZ
- State GDP YoY
- ▲ 4.54%
- F500 in state
- 20
Industry mix (Fortune 500 HQ in AZ)
| Industry | F500 HQs | Revenue |
|---|---|---|
| Technology | 2 | $13B |
|
||
| Mining / Metals | 1 | $23B |
|
||
| Environmental Services | 1 | $16B |
|
||
| Metals / Steel | 1 | $14B |
|
||
| Technology Distribution | 1 | $9B |
|
||
| Homebuilding | 1 | $8B |
|
||
Price history
+80.5% since first listed6 events — show timeline
- 2026-05-11 Pending — ARMLS
- 2026-05-06 Price Changed $139,900 ARMLS
- 2026-04-09 Listed $149,000 ARMLS
- 2002-05-17 Sold (Public Records) $85,000 Public Records
- 2002-05-17 Sold (Public Records) $85,000 Public Records
- 1998-03-02 Sold (Public Records) $77,500 Public Records
Property tax history
-2.9%/yrLatest (2025): $519 · +2.3% YoY. Source: county tax records.
Cash-flow waterfall
monthlySold comps — $/sqft
last 12 mo · ≤1 miLoading sold comps…