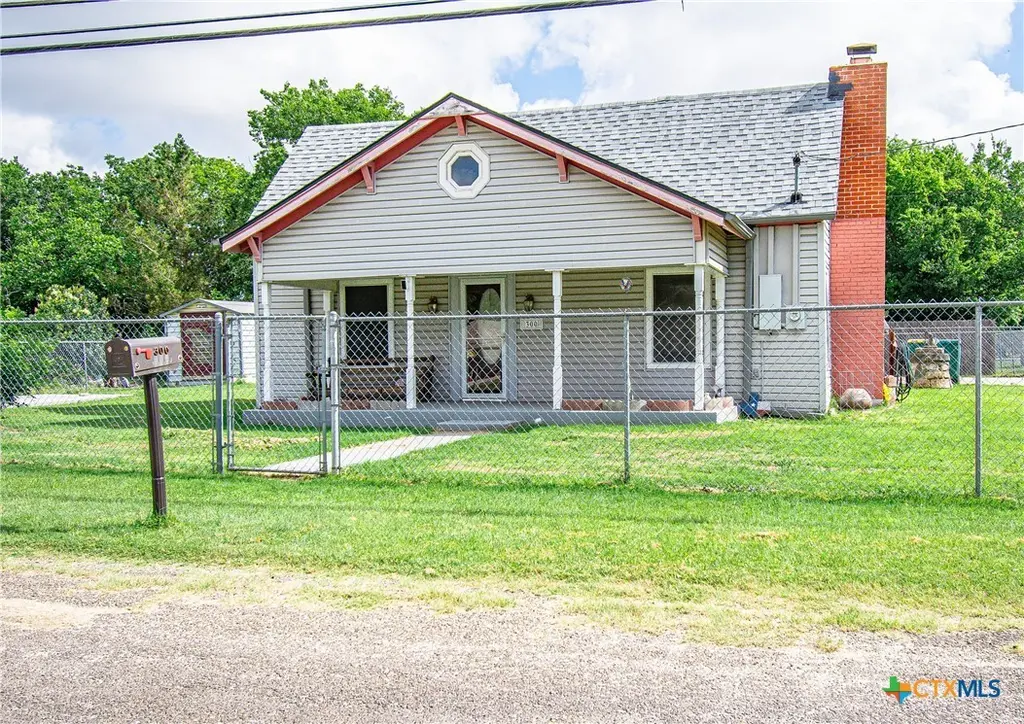
300 W Avenue J · Nolanville, TX
Flood risk 1/10 · Minimal
- FEMA flood zone
- X (unshaded)
- Chance of flooding over 30 yrs
- 0.0%
- Est. flood insurance / yr
- $507 – $1,088
Fire risk 5/10 · Moderate
- Est. fire insurance / yr
- $1,222 – $2,270
Heat risk 8/10 · Major
- Hot days now (above 107°F)
- 7 days/yr
- Hot days in 30 yrs
- 24 days/yr
Wind risk 6/10 · Moderate
- Chance of severe wind over 30 yrs
- 65.0%
Air-quality risk 2/10 · Minimal
- Unhealthy air days now
- 0 days/yr
- Unhealthy air days in 30 yrs
- 1 days/yr
Risk factors via First Street. Map © Google.
Why this score? — see what drove the B+ grade
The composite is a weighted blend of 9 inputs, each scored 0–100. Each bar is that input's sub-score; the figure is the points it added to the 100-point composite (weight × sub-score).
- Cash flow +28.0/30.0
- ARV discount +15.0/15.0
- DSCR +9.9/10.0
- 1% rule +7.1/10.0
- Appreciation +5.0/10.0
- Livability +3.7/5.0
- Schools +3.0/10.0
- Rent growth +2.5/5.0
- Condition / age +2.5/5.0
$149,500
🖨 Deal sheet 📄 Offer letter ✓ Due diligence
Listing remarks
Situated on a spacious corner lot in the heart of Nolanville, this charming 3-bedroom, 2-bath home offers character, functionality, and plenty of outdoor space. Built in 1940s and set on approximately 0.30 acres, the property features ample parking alongside the home, making it convenient for multiple vehicles, trailers, or recreational equipment. Several storage buildings provide abundant space for tools, hobbies, equipment, or additional storage needs. The large lot offers room to enjoy outdoor living, gardening, or future improvements. Conveniently located near schools, shopping, dining, and major commuter routes to Killeen, Harker Heights, Belton, and Fort Hood, this property presents a
Key facts
- Near schools
- Near shopping
- Ample parking
Tags
Property features AI
Finance
- HOA & community: Street lights in the community
Exterior
- Parking: No garage
- Utilities: Trash collection (public); Water available (public; not connected at lot); Public sewer (not connected at lot); Power / utilities available
- Home design: Single-story; Faces south; Resale property
- Construction: Masonry construction; Composition/shingle roof; Slab foundation; Built (year source: Assessor)
- Exterior features: Storage; Chain link fencing; City lot; Road frontage on a city street; Asphalt road surface
Interior
- Kitchen: Electric range / oven; Range; Refrigerator; Disposal
- Flooring: Carpet; Linoleum
- Bathrooms: 2 full bathrooms
- Heating & cooling: Heating present; One cooling unit
- Interior features: Ceiling fan(s); Permanent attic stairs; Breakfast bar; Kitchen/dining combo; Living room fireplace
- Laundry & utility: Electric dryer hookup; Laundry located inside
Neighborhood map
What this means for you Summary
Snapshot
- This is a 3-bed/1.0-bath single-family listed at $150k.
Deal economics
- At list price, monthly cash flow is $465 ($6k/yr) — positive.
- The deal already cash-flows at list — no discount required.
- Meets the 1% rule at list price ($2k rent vs $150k).
- Cap rate 10.0% vs local median 3.4% in Nolanville — top-decile yield for the area; either an underpriced asset or a hidden risk that comps aren't pricing in. Stress-test before assuming the spread holds.
Location & tenants
- Location reads 74/100 on livability (#176 in TX, #4,655 nationally) — a middle-class / working-renter tenant base. Strengths: crime A+, cost of living A+, housing A+; Watch: schools D+, amenities F, commute F.
- Killeen ISD (urban): math 31% / reading 38% proficiency, ranked #524 of 826 in TX (top 63%) — families likely to look elsewhere, expect single-tenant / working-renter base with shorter leases.
- Market conditions: 235 active listings in the ZIP; 19 comparable units currently listed for rent nearby; rentals at typical pace (median 23d on market — plan ~3-4 weeks tenant-placement turnaround); 3,222 units permitted in Bell County in 2024 (246 in 5+ unit buildings).
Forward outlook
- In year one you build about $1k of equity ($1k loan paydown + $55 appreciation (0.0% local appreciation)).
- Bell County population projected at +21% by 2050 — long-run rental-demand tailwind backs the buy-and-hold thesis.
- At projected returns (0.0% appreciation + 3.0% rent growth), your $42k cash investment doubles in ~6 years — after that, you're playing with house money.
Negotiation context
- Only 14 days on market — expect competitive offers; lowballing is unlikely to land.
Risks & watch-outs
- Watch-outs: built in 1940 — expect roof / HVAC / electrical / plumbing capex.
- Climate carrying-cost: major wind risk, 65% chance of damaging wind over 30y; moderate wildfire risk; extreme-heat days projected 7→24/yr by 2055 (HVAC capex compounding) — expect insurance premiums to compound above CPI over the hold.
Questions for the listing agent
- Built in 1940 — when were the roof, HVAC, electrical panel, plumbing, and water heater last replaced?
- Is there a deadline driving the sale (1031 exchange, divorce, estate, relocation)? That informs how much negotiation room exists.
- Schools are D-rated, which usually means shorter tenancies and higher turnover. Who's the typical renter profile here, and what's been the actual vacancy rate?
- What's the average days-on-market for RENTAL listings here right now (not sales)? A rising rental-DOM trend means longer vacancies and softer asking-rent achievability than the comps imply.
- What's the recent tenant-quality profile in this submarket — average credit score on applications, eviction rate, late-payment / NSF rate, and stable-employment percentage? A property-management company in the area should have these aggregated.
- How much new for-sale + rental construction is in the pipeline within 1–3 miles? Heavy new supply typically softens prices + rents 12–24 months out; constrained supply supports both.
Investment metrics
- 1% rule
- 1.21% ✓
- Cap rate
- 10.03%
- Cash-on-cash
- 13.33%
- DSCR
- 1.59
- GRM
- 6.9
CMA / ARV
- ARV (on-the-fly)
- $222,088
- Comps found
- 9
Show comp detail 9 sales within ~0.75 mi
| Address | Dist | Beds/Ba | Sqft | Sold | Price | $/sf | Match |
|---|---|---|---|---|---|---|---|
| 103 Black Walnut Ct | 0.59mi | 3/2.0 | 1,524 (-3%) | 7mo | $255,000 | $167 | 58 |
| 1217 E Avenue H | 0.62mi | 3/2.0 | 1,624 (+4%) | 4mo | $230,000 | $142 | 58 |
| 210 Cedar Ridge Dr | 0.51mi | 3/2.0 | 1,673 (+7%) | 6mo | $239,500 | $143 | 56 |
| 106 Black Gum Ct | 0.64mi | 3/2.0 | 1,656 (+6%) | 7mo | $250,000 | $151 | 51 |
| 214 N 10 St | 0.46mi | 3/2.0 | 1,740 (+11%) | 9mo | $235,000 | $135 | 49 |
| 217 Timber Ridge Dr | 0.60mi | 4/2.0 (+1) | 1,688 (+8%) | 2mo | $239,000 | $142 | 48 |
| 315 Sims Ridge Dr | 0.59mi | 3/2.0 | 1,631 (+4%) | 19mo | $221,000 | $135 | 46 |
| 112 Cedar Ridge Dr | 0.64mi | 4/2.0 (+1) | 1,668 (+7%) | 7mo | $245,000 | $147 | 44 |
| 306 Cindy Ln | 0.59mi | 3/1.5 | 1,336 (-15%) | 16mo | $185,000 | $138 | 33 |
Match score weights: distance 35% · size 25% · config 20% · recency 20%. Top-matched comps best support the ARV.
Projected returns pro-forma
0.04% appreciation · 3.0% rent growth · sell at horizon
- IRR
- 12.7%
- Equity multiple
- 1.61×
- Total profit
- $25,494
- Equity at exit
- $43,688
- IRR
- 17.3%
- Equity multiple
- 2.92×
- Total profit
- $80,192
- Equity at exit
- $52,737
Cash invested: $41,860 (down + closing). Projections, not guarantees.
Landlord ↔ Tenant lean methodology
- Overall (STATE)
- 87 Strongly Landlord-Friendly
- State Texas
- 87 Strongly Landlord-Friendly · R+5
- County
- — inherits STATE
- City
- — inherits STATE
ZIP-level market 76559
- Home prices YoY
- 0.0%
- Active inventory
- 235
- Price-to-rent
- 6.9×
Monthly cashflow live
- Estimated rent
- $1,811 high interval (Pro) →
- Mortgage (P&I)
- −$784
- Tax from tax record
- −$120 /mo · $1,436/yr
- Insurance
- −$62
- HOA
- −$0
- Vacancy / Maint / Mgmt
- −$380
- Net cashflow
- $465
Break-even live
UW: 25.0% down · 7.5% · 30yr · 1.5% tax · 5.0% vac · 8.0% maint · 8.0% mgmt
Financing live
Cash to close
- Down payment
- $37,375
- Closing costs
- $4,485
- Reserves months
- —
- Total cash needed
- —
Loan-product check · same deal, 3 products live
Conventional
25% down · 7.5% · 30yr
- Down + closing
- —
- Monthly P&I
- —
- Monthly cashflow
- —
- DSCR
- —
- Eligible?
- —
Personal DTI + credit; lowest rate.
DSCR
20% down · 8.5% · 30yr
- Down + closing
- —
- Monthly P&I
- —
- Monthly cashflow
- —
- DSCR
- —
- Eligible?
- —
No personal income docs; deal must DSCR.
Hard money
10% down · 12.0% · 12mo
- Down + closing
- —
- Monthly P&I
- —
- Monthly cashflow
- —
- DSCR
- —
- Eligible?
- —
Short-term bridge; refi at stabilization.
Rent comps 19 comps
| Address | Beds | Baths | Sqft | Rent | $/sqft | DOM | Units | Dist |
|---|---|---|---|---|---|---|---|---|
| 402 Topeka Ct Unit B Nolanville, TX | 3.0 | 2.0 | 1200 | $1,300 | $1.08 | 43d | 1 | 0.10mi |
| 605 Old Glory Rd Nolanville, TX | 4.0 | 3.0 | 2012 | $2,073 | $1.03 | 23d | 1 | 0.21mi |
| 408 W St John Ave Apt A Nolanville, TX | 3.0 | 2.0 | 1250 | $1,100 | $0.88 | 43d | 1 | 0.23mi |
| 870 Freedom Cir Nolanville, TX | 4.0 | 3.0 | 2191 | $2,223 | $1.01 | 21d | 1 | 0.25mi |
| 853 Freedom Cir Nolanville, TX | 4.0 | 3.0 | 2012 | $2,073 | $1.03 | 13d | 1 | 0.25mi |
| 202 East Avenue H Unit H Nolanville, TX | 3.0 | 2.0 | 1384 | $1,550 | $1.12 | 23d | 1 | 0.26mi |
| 854 Freedom Cir Nolanville, TX | 4.0 | 3.0 | 2012 | $1,901 | $0.94 | 43d | 1 | 0.28mi |
| 810 Freedom Cir Nolanville, TX | 4.0 | 2.0 | 1974 | $3,895 | $1.97 | 13d | 1 | 0.38mi |
| 217 Slippery Elm Dr Nolanville, TX | 4.0 | 2.5 | 2076 | $2,250 | $1.08 | 13d | 1 | 0.45mi |
| 310 10th St Unit B Nolanville, TX | 3.0 | 2.0 | 1281 | $1,095 | $0.85 | 43d | 1 | 0.48mi |
| 106 Cedar Ridge Dr Nolanville, TX | 4.0 | 2.0 | 1807 | $1,695 | $0.94 | 13d | 1 | 0.68mi |
| 240 W Elm St Unit A Nolanville, TX | 3.0 | 2.0 | 1200 | $1,600 | $1.33 | 23d | 1 | 0.81mi |
| 7026 Chimney Hill Dr Nolanville, TX | 4.0 | 2.5 | 2041 | $2,200 | $1.08 | 23d | 1 | 0.99mi |
| 406 Diana Ln Harker Heights, TX | 4.0 | 2.0 | 1617 | $1,600 | $0.99 | 43d | 1 | 1.26mi |
| 1806 Iron Jacket Trl Harker Heights, TX | 4.0 | 2.0 | 2178 | $2,345 | $1.08 | 23d | 1 | 1.27mi |
| 1901 Horatio St Nolanville, TX | 3.0 | 2.0 | 1945 | $2,050 | $1.05 | 23d | 1 | 1.44mi |
| 2053 Stillwell St Nolanville, TX | 4.0 | 2.0 | 1811 | $2,300 | $1.27 | 23d | 1 | 1.48mi |
| 1602 Old Nolanville Rd Unit B Nolanville, TX | 3.0 | 2.0 | 1276 | $1,350 | $1.06 | 23d | 1 | 1.49mi |
| 1805 Diana Ln Harker Heights, TX | 4.0 | 2.0 | 1732 | $1,595 | $0.92 | 43d | 1 | 1.49mi |
Listing history 11 events
-
2026-06-18days on market $149,500 Active 14 DOM
-
2026-06-17days on market $149,500 Active 13 DOM
-
2026-06-16days on market $149,500 Active 12 DOM
-
2026-06-15days on market $149,500 Active 11 DOM
-
2026-06-14days on market $149,500 Active 9 DOM
-
2026-06-13days on market $149,500 Active 8 DOM
-
2026-06-10days on market $149,500 Active 6 DOM
-
2026-06-09days on market $149,500 Active 5 DOM
-
2026-06-08days on market $149,500 Active 4 DOM
-
2026-06-07remarks 699-char remark
-
2026-06-07$149,500 Active 3 DOM
ⓘ Source: listings_history table (triggers on properties + properties_extension) + one-shot
backfill from property_details.listing_events for pre-trigger history.
Tax reassessment forecast TX · Resets to sale price
- Current annual tax
- $1,436 · $120/mo
- Projected year-2 tax
- $2,736 · $228/mo
- Expected delta
- +$1,300/yr (+$108/mo · 90.6%)
ⓘ Screening estimate from a state-policy table — verify with the county assessor before closing.
Climate risk First Street
- Flood 1/10 Low FEMA zone X (unshaded) · 0% chance over 30 yrs
- Wildfire 5/10 Major
- Heat 8/10 Severe 7 d/yr ≥107°F today · 24 d/yr by 30 yrs out
- Wind 6/10 Major 65% chance of damaging wind over 30 yrs
- Air quality 2/10 Low 0 unhealthy d/yr today · 1 by 30 yrs out
Nearby sold comps map
Loading sold comps map…
Walkable amenities ~0.75 mi
Loading nearby amenities…
Taxation est. · year 1
- Rental income
- $21,737
- − Mortgage interest
- −$8,374
- − Property taxes
- −$1,436
- − Insurance
- −$748
- − Repairs & maintenance
- −$1,739
- − Management
- −$1,739
- − Depreciation
- −$4,349
- Taxable income
- $3,352
- Est. tax owed @ 24.0%
- −$805
- After-tax cash flow
- $4,776/yr
For passive investors: Depreciation is non-cash, so a rental often shows a tax loss while cash-flowing — sheltering income. Rental losses are passive: they offset passive income freely, and up to $25,000/yr can offset ordinary (W-2) income if you actively participate and your MAGI is under $100k (phasing out to $0 by $150k); unused losses carry forward. On sale, claimed depreciation is recaptured at up to 25%, and gains may owe capital-gains tax (a 1031 exchange can defer both). Figures are a year-1 estimate at your 24.0% rate — not tax advice; consult a CPA.
Schools (NCES district)
- District
- Killeen ISD
- NCES district ID
- 4825660
- Math proficiency
- 31% ▼ -16.00%
- Reading proficiency
- 38% ▼ -3.00%
- Median HH income
- $47,665
- Composite
- 29.69/100
- National rank
- #6458
- State rank
- #524 of 826 in TX
Livability — Nolanville
- Score
- 74/100
- State rank
- #176
- US rank
- #4655
Category grades
Schools grade is shown separately in the Schools card above.
Census & demographics
- Census place
- Nolanville, TX
- City population
- 6,896
- Population (ZIP)
- 6,896
Population outlook (Bell County) Hauer SSP2
- Today (2025)
- 371,114 people
- By 2030
- 389,104 · +4.8%
- By 2040
- 420,592 · +13.3%
- By 2050
- 447,779 · +20.7%
- By 2075
- 499,130 · +34.5%
- By 2100
- 505,680 · +36.3%
Race, ethnicity, and origin ACS 2023
- Neighborhood character
- Diverse neighborhood (Simpson 0.65)
- Race & ethnicity
- White 52% Hispanic / Latino 20% Black 20% Two or more races 6% Asian 5% Pacific Islander 2%
- Hispanic origin (detail)
- Mexican 16% Puerto Rican 1%
- Common ancestry
- Italian 2% Lithuanian 1% Danish 1%
- Foreign-born
- 8% · Canada, Vietnam, South Korea
- Languages at home
- 88% English-only · Spanish 9% Other Indo-European 1% Korean 1%
Political lean MEDSL · Bell
- 2024 margin
- R (+16.2) · D 41.3% · R 57.6% · Other 1.1%
- 2008→2024 swing
- -6.5pp toward R · 2008: -9.8pp · 2024: -16.2pp
- All cycles
- 2024: R+16.2 2020: R+8.5 2016: R+15.1 2012: R+16.4 2008: R+9.8
Not yet ingested
- Civics
- —
Market trends
- HPI YoY
- ▬ 0.04%
- Current HPI
- 170.1375
- Rent YoY
- —
- Metro
- —
- State GDP YoY
- ▲ 3.95%
- F500 in state
- 110
Industry mix (Fortune 500 HQ in TX)
| Industry | F500 HQs | Revenue |
|---|---|---|
| Energy | 16 | $1,198B |
|
||
| Technology | 5 | $198B |
|
||
| Engineering / Construction | 4 | $72B |
|
||
| Energy Services | 3 | $60B |
|
||
| Utilities | 3 | $41B |
|
||
| Healthcare | 2 | $330B |
|
||
Price history
4 events — show timeline
- 2026-06-04 Listed $149,500 CTXMLS
- 2026-01-13 Sold (Public Records) — Public Records
- 2006-01-10 Sold (Public Records) — Public Records
- 1987-08-04 Sold (Public Records) — Public Records
Property tax history
+1.8%/yrLatest (2025): $1,436 · +11.8% YoY. Source: county tax records.
Cash-flow waterfall
monthlySold comps — $/sqft
last 12 mo · ≤1 miLoading sold comps…