 Multi-family
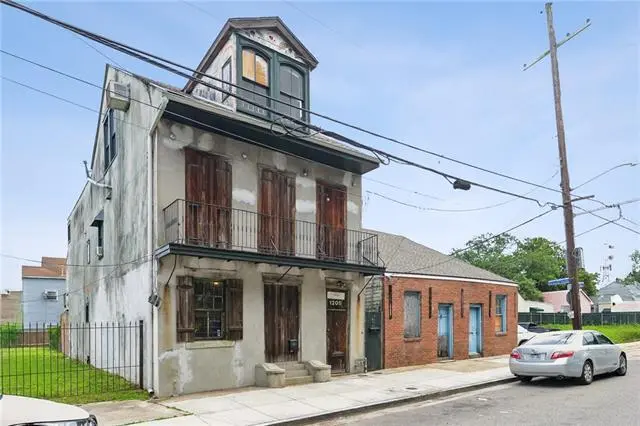
1201-05 St Philip St · New Orleans, LA
Flood risk 7/10 · Major
- FEMA flood zone
- X
- Chance of flooding over 30 yrs
- 0.74%
- Est. flood insurance / yr
- $507 – $1,088
Fire risk 1/10 · Minimal
- Est. fire insurance / yr
- $1,269 – $2,357
Heat risk 10/10 · Severe
- Hot days now (above 108°F)
- 7 days/yr
- Hot days in 30 yrs
- 21 days/yr
Wind risk 10/10 · Severe
- Chance of severe wind over 30 yrs
- 99.0%
Air-quality risk 4/10 · Minor
- Unhealthy air days now
- 4 days/yr
- Unhealthy air days in 30 yrs
- 4 days/yr
Risk factors via First Street. Map © Google.
Why this score? — see what drove the C grade
The composite is a weighted blend of 9 inputs, each scored 0–100. Each bar is that input's sub-score; the figure is the points it added to the 100-point composite (weight × sub-score).
- Cash flow +21.3/30.0
- ARV discount +15.0/15.0
- DSCR +6.8/10.0
- 1% rule +5.5/10.0
- Livability +4.0/5.0
- Rent growth +2.5/5.0
- Condition / age +2.5/5.0
- Schools +1.6/10.0
- Appreciation +0.0/10.0
$499,000
🖨 Deal sheet (PDF) 📄 Offer letter ✓ Due diligence
Multi-family units
County records classify this as Multi-Family (2-4 Unit). Listing-text estimate: 1 unit. estimate disagrees with records
Listing remarks
A RARE AND EXTRAORDINARY HISTORIC COMPOUND OFFERING IN THE HEART OF TREME! This remarkable and truly irreplaceable opportunity includes TWO SEPARATE BUILDINGS ~ ON TWO SEPARATE LOTS OF RECORD, all being offered together for the singular price of just $499,000. Prominently positioned at the highly visible corner of St. Philip Street and Henriette Delille Street, this exceptional offering consists of the historic Creole Cottage at 1201 St. Philip Street AND the neighboring 2 Story Mansion with an attached dependency unit at 1205 St. Philip Street. Together, these architecturally significant buildings represent more than 160+ years of New Orleans history, character, craftsmanship, and Authenti
Key facts
- Residential units
- Two separate lots
- Creole cottage
Tags
Property features AI
Exterior
- Parking: No dedicated parking
- Home design: 4-unit building; Each unit categorized as 'Other'
- Construction: Brick, concrete, and wood siding construction; Composition roof
- Exterior features: Fencing (other)
Interior
- Bathrooms: 6 full bathrooms
- Heating & cooling: Central heating; Other heating; Central air conditioning; Window unit(s)
- Interior features: Balcony
Neighborhood map
What this means for you Summary
Snapshot
- This is a 3-bed/3.5-bath multifamily listed at $499k.
Deal economics
- At list price, monthly cash flow is $663 ($8k/yr) — positive.
- The deal already cash-flows at list — no discount required.
- Meets the 1% rule at list price ($5k rent vs $499k).
- Cap rate 8.0% vs local median 4.4% in New Orleans — top-decile yield for the area; either an underpriced asset or a hidden risk that comps aren't pricing in. Stress-test before assuming the spread holds.
Location & tenants
- Location reads 81/100 on livability (#3 in LA, #1,383 nationally) — a professional / high-income tenant draw. Strengths: amenities A+, commute A+, health & safety A+; Watch: crime C-, employment D.
- Orleans Parish (urban): math 11% / reading 27% proficiency, ranked #69 of 98 in LA (top 70%) — low school quality limits family demand, transient renter base, plan for 1-2y turnover; 68% free/reduced lunch — lower-income household profile, screen leases tightly.
- Market conditions: Rents flat; 351 active listings in the ZIP; 37 comparable units currently listed for rent nearby; rentals at typical pace (median 25d on market — plan ~3-4 weeks tenant-placement turnaround); 43% of comp listings sitting > 30 days — soft ceiling on asking rent; 710 units permitted in Orleans Parish in 2024 (244 in 5+ unit buildings).
- At $5,218/mo this rent would consume 120% of the median local household income ($52k/yr) (locally 1001% of renters already pay >50% of income on rent) — very limited rent-growth headroom before tenants either downsize or default.
Forward outlook
- Local home prices are declining (-3.0%/yr); year-one equity from $3k of loan paydown is wiped out by about $15k of value loss. Plan a longer hold.
- Orleans County population projected at +61% by 2050 — long-run rental-demand tailwind backs the buy-and-hold thesis.
Negotiation context
- Only 13 days on market — expect competitive offers; lowballing is unlikely to land.
Risks & watch-outs
- Watch-outs: flood insurance adds $66/mo; built in 1850 — expect roof / HVAC / electrical / plumbing capex.
- Climate carrying-cost: major flood risk; severe wind risk, 99% chance of damaging wind over 30y; extreme-heat days projected 7→21/yr by 2055 (HVAC capex compounding) — expect insurance premiums to compound above CPI over the hold.
Questions for the listing agent
- Built in 1850 — when were the roof, HVAC, electrical panel, plumbing, and water heater last replaced?
- What's the actual annual flood-insurance premium (NFIP or private), and is the property in a SFHA with mandatory coverage?
- Is there a deadline driving the sale (1031 exchange, divorce, estate, relocation)? That informs how much negotiation room exists.
- What's the average days-on-market for RENTAL listings here right now (not sales)? A rising rental-DOM trend means longer vacancies and softer asking-rent achievability than the comps imply.
- What's the recent tenant-quality profile in this submarket — average credit score on applications, eviction rate, late-payment / NSF rate, and stable-employment percentage? A property-management company in the area should have these aggregated.
- How much new apartment / multifamily construction is in the pipeline within 1–3 miles? Heavy new supply (>2% of stock underway) typically softens rents 12–24 months out; light construction supports rent growth.
Investment metrics
- 1% rule
- 1.05% ✓
- Cap rate
- 8.05%
- Cash-on-cash
- 6.27%
- DSCR
- 1.28
- GRM
- 8.0
CMA / ARV
- ARV (on-the-fly)
- $704,462
- Comps found
- 7
Show comp detail 7 sales within ~0.75 mi
| Address | Dist | Beds/Ba | Sqft | Sold | Price | $/sf | Match |
|---|---|---|---|---|---|---|---|
| 1501-03 Governor Nicholls St | 0.23mi | 3/4.0 | 2,680 (-8%) | 10mo | $700,000 | $261 | 66 |
| 2734 36 St Philip St | 0.50mi | 4/2.5 (+1) | 2,906 (-0%) | 11mo | $520,000 | $179 | 58 |
| 939 41 Bienville St | 0.52mi | 4/5.0 (+1) | 3,074 (+6%) | 2mo | $1,050,000 | $342 | 54 |
| 920 Chartres St | 0.46mi | 4/3.0 (+1) | 2,850 (-2%) | 18mo | $1,150,000 | $404 | 53 |
| 941-943 Toulouse St | 0.33mi | 4/6.0 (+1) | 3,206 (+10%) | 1mo | $775,000 | $242 | 52 |
| 710 12 Marigny St | 0.72mi | 4/3.0 (+1) | 2,775 (-5%) | 16mo | $550,000 | $198 | 38 |
| 1940-42 Pauger St | 0.59mi | 4/4.0 (+1) | 2,556 (-12%) | 19mo | $120,000 | $47 | 29 |
Match score weights: distance 35% · size 25% · config 20% · recency 20%. Top-matched comps best support the ARV.
Projected returns pro-forma
-3.0% appreciation · 0.18% rent growth · sell at horizon
- IRR
- -10.7%
- Equity multiple
- 0.62×
- Total profit
- $-52,942
- Equity at exit
- $74,403
- IRR
- -6.0%
- Equity multiple
- 0.66×
- Total profit
- $-47,222
- Equity at exit
- $43,144
Cash invested: $139,720 (down + closing). Projections, not guarantees.
Landlord ↔ Tenant lean methodology
- Overall (STATE)
- 90 Strongly Landlord-Friendly
- State Louisiana
- 90 Strongly Landlord-Friendly · R+12
- County
- — inherits STATE
- City
- — inherits STATE
ZIP-level market 70116
- Home prices YoY
- -34.5%
- Rents YoY
- 0.2%
- Active inventory
- 351
- Price-to-rent
- 15.9×
Monthly cashflow live
- Estimated rent
- $5,218 high interval (Pro) →
- Mortgage (P&I)
- −$2,617
- Tax from tax record
- −$568 /mo · $6,815/yr
- Insurance
- −$208
- Flood insurance flood zone
- −$66 /mo · $798/yr
- HOA
- −$0
- Vacancy / Maint / Mgmt
- −$1,096
- Net cashflow
- $663
Break-even live
Sensitivity live
| Price | -10% $946 | -5% $804 | +0% $663 | +5% $522 | +10% $381 |
|---|---|---|---|---|---|
| Rent | -10% $251 | -5% $457 | +0% $663 | +5% $869 | +10% $1,075 |
| Rate | -1.0pp $914 | -0.5pp $790 | base $663 | +0.5pp $534 | +1.0pp $402 |
2-unit breakdown (identical units grouped — click to expand)
| Units | Beds | Baths | Est. rent |
|---|---|---|---|
| 2× units | 3 | 3 | $5,218 |
| #1 | 3 | 3 | $2,609 |
| #2 | 3 | 3 | $2,609 |
| Total (2 units) | $5,218 | ||
UW: 25.0% down · 7.5% · 30yr · 1.5% tax · 5.0% vac · 8.0% maint · 8.0% mgmt
Financing live
Cash to close
- Down payment
- $124,750
- Closing costs
- $14,970
- Reserves months
- —
- Total cash needed
- —
Loan-product check · same deal, 3 products live
Conventional
25% down · 7.5% · 30yr
- Down + closing
- —
- Monthly P&I
- —
- Monthly cashflow
- —
- DSCR
- —
- Eligible?
- —
Personal DTI + credit; lowest rate.
DSCR
20% down · 8.5% · 30yr
- Down + closing
- —
- Monthly P&I
- —
- Monthly cashflow
- —
- DSCR
- —
- Eligible?
- —
No personal income docs; deal must DSCR.
Hard money
10% down · 12.0% · 12mo
- Down + closing
- —
- Monthly P&I
- —
- Monthly cashflow
- —
- DSCR
- —
- Eligible?
- —
Short-term bridge; refi at stabilization.
Rent comps 37 comps
| Address | Beds | Baths | Sqft | Rent | $/sqft | DOM | Units | Dist |
|---|---|---|---|---|---|---|---|---|
| 1021 Henriette Delille St New Orleans, LA | 3.0 | 2.0 | 2012 | $2,250 | $1.12 | 18d | 1 | 0.01mi |
| 1000 Saint Philip St New Orleans, LA | 3.0 | 2.5 | 2650 | $4,800 | $1.81 | 45d | 1 | 0.15mi |
| 1301 N Rampart St New Orleans, LA | 2.0 | 2.0–2.5 | 2929 | $7,750 | $2.65 | 21d | 2 | 0.19mi |
| 811 Burgundy St New Orleans, LA | 4.0 | 2.5 | 2059 | $5,000 | $2.43 | 45d | 1 | 0.21mi |
| 839 Dumaine St New Orleans, LA | 3.0 | 4.0 | 2740 | $6,500 | $2.37 | 45d | 1 | 0.25mi |
| 1433 Esplanade Ave New Orleans, LA | 3.0 | 2.0 | 2411 | $5,000 | $2.07 | 3d | 1 | 0.33mi |
| 1423 N Villere St Unit A New Orleans, LA | 2.0 | 3.0 | 1964 | $2,500 | $1.27 | 45d | 1 | 0.33mi |
| 824 Royal St Unit G New Orleans, LA | 2.0 | 2.0 | 2080 | $3,300 | $1.59 | 45d | 1 | 0.39mi |
| 1860 Burgundy St New Orleans, LA | 4.0 | 4.0 | 3000 | $3,500 | $1.17 | 25d | 1 | 0.42mi |
| 627 St Peter New Orleans, LA | 2.0 | 2.5 | 2174 | $5,500 | $2.53 | 25d | 1 | 0.45mi |
| 939 Iberville St New Orleans, LA | 1.0–3.0 | 1.0 | 1502 | $3,800 | $2.53 | 13d | 7 | 0.60mi |
| 324 N Roman St New Orleans, LA | 3.0 | 3.0 | 2100 | $2,500 | $1.19 | 45d | 1 | 0.64mi |
| 2320 N Rampart St New Orleans, LA | 3.0 | 3.0 | 2317 | $3,700 | $1.60 | 45d | 1 | 0.77mi |
| 2317 N Rampart St Unit 1272378P New Orleans, LA | 3.0–6.0 | 2.0–4.0 | 1581 | $2,165 | $1.37 | 4d | 2 | 0.77mi |
| 210 Baronne St New Orleans, LA | 1.0–2.0 | 1.0–2.5 | 1530 | $5,000 | $3.27 | 3d | 26 | 0.82mi |
| 124 N Galvez St Unit 1 New Orleans, LA | 2.0 | 2.0 | 2200 | $2,200 | $1.00 | 25d | 1 | 0.88mi |
| 800 Gravier St Unit 1272312P New Orleans, LA | 2.0–4.0 | 2.0–4.0 | 1673 | $4,259 | $2.55 | 15d | 2 | 0.89mi |
| 2331 Columbus St New Orleans, LA | 3.0 | 1.0 | 1976 | $1,850 | $0.94 | 25d | 1 | 0.91mi |
| 431 Gravier St Ste 4 New Orleans, LA | 3.0 | 2.0 | 2100 | $3,700 | $1.76 | 45d | 1 | 0.94mi |
| 431 Gravier St Unit 2 New Orleans, LA | 2.0 | 2.0 | 2100 | $4,000 | $1.90 | 45d | 1 | 0.94mi |
| 1837 Touro St New Orleans, LA | 3.0 | 1.0 | 1994 | $2,000 | $1.00 | 25d | 1 | 0.96mi |
| 822 Perdido St Unit 1272370P New Orleans, LA | 1.0–5.0 | 1.0–5.0 | 1447 | $4,588 | $3.17 | 4d | 4 | 0.97mi |
| 419 Carondelet St Unit PHB New Orleans, LA | 3.0 | 2.5 | 2546 | $5,700 | $2.24 | 4d | 1 | 0.98mi |
| 323 Morgan St Apt E New Orleans, LA | 2.0 | 2.5 | 2000 | $3,600 | $1.80 | 45d | 1 | 1.06mi |
| 323 Morgan St Unit C New Orleans, LA | 2.0 | 2.0 | 2000 | $3,200 | $1.60 | 45d | 1 | 1.06mi |
| 323 Morgan St New Orleans, LA | 2.0 | 2.5 | 2000 | $3,600 | $1.80 | 18d | 1 | 1.06mi |
| 2731 Saint Philip St Unit 2733 New Orleans, LA | 4.0 | 2.0 | 2000 | $2,600 | $1.30 | 25d | 1 | 1.10mi |
| 713 Camp St #400 New Orleans, LA | 2.0 | 2.0 | 1935 | $4,750 | $2.45 | 45d | 1 | 1.20mi |
| 1000 Girod St Ph 2 New Orleans, LA | 3.0 | 3.5 | 2008 | $4,800 | $2.39 | 45d | 1 | 1.21mi |
| 1038 Montegut St New Orleans, LA | 3.0 | 2.5 | 2250 | $4,200 | $1.87 | 45d | 1 | 1.27mi |
| 1038 Montegut St New Orleans, LA | 3.0 | 2.5 | 2250 | $4,200 | $1.87 | 25d | 1 | 1.27mi |
| 875 O'Keefe Ave #301 New Orleans, LA | 3.0 | 2.5 | 2029 | $4,500 | $2.22 | 18d | 1 | 1.35mi |
| 801 Saint Joseph St #1 New Orleans, LA | 2.0 | 2.5 | 2400 | $14,000 | $5.83 | 45d | 1 | 1.38mi |
| 3024 Esplanade Ave New Orleans, LA | 3.0 | 2.5 | 2300 | $4,500 | $1.96 | 45d | 1 | 1.41mi |
| 822 Howard Ave Unit 1272354P New Orleans, LA | 1.0–5.0 | 1.0–4.0 | 1749 | $6,618 | $3.78 | 3d | 3 | 1.44mi |
| 1928 Franklin Ave New Orleans, LA | 2.0 | 2.5 | 2840 | $2,500 | $0.88 | 11d | 1 | 1.46mi |
| 2228 Arts St New Orleans, LA | 3.0 | 2.0 | 2270 | $1,675 | $0.74 | 4d | 1 | 1.49mi |
Listing history 9 events
-
2026-06-21days on market $499,000 Active 13 DOM
-
2026-06-18days on market $499,000 Active 10 DOM
-
2026-06-17days on market $499,000 Active 9 DOM
-
2026-06-16days on market $499,000 Active 8 DOM
-
2026-06-15days on market $499,000 Active 7 DOM
-
2026-06-13days on market $499,000 Active 5 DOM
-
2026-06-10days on market $499,000 Active 2 DOM
-
2026-06-08remarks 699-char remark
-
2026-06-08$499,000 Active 1 DOM
ⓘ Source: listings_history table (triggers on properties + properties_extension) + one-shot
backfill from property_details.listing_events for pre-trigger history.
Tax reassessment forecast LA · Resets to sale price
- Current annual tax
- $6,815 · $568/mo
- Projected year-2 tax
- $6,815 · $568/mo
- Expected delta
- $0/yr ($0/mo · 0.0%)
ⓘ Screening estimate from a state-policy table — verify with the county assessor before closing.
Climate risk First Street
- Flood 7/10 Severe FEMA zone X · 74% chance over 30 yrs
- Wildfire 1/10 Low
- Heat 10/10 Extreme 7 d/yr ≥108°F today · 21 d/yr by 30 yrs out
- Wind 10/10 Extreme 99% chance of damaging wind over 30 yrs
- Air quality 4/10 Moderate 4 unhealthy d/yr today · 4 by 30 yrs out
Nearby sold comps map
Loading sold comps map…
Walkable amenities ~0.75 mi
Loading nearby amenities…
Taxation est. · year 1
- Rental income
- $62,616
- − Mortgage interest
- −$27,952
- − Property taxes
- −$6,815
- − Insurance
- −$3,292
- − Repairs & maintenance
- −$5,009
- − Management
- −$5,009
- − Depreciation
- −$14,516
- Taxable income
- $21
- Est. tax owed @ 24.0%
- −$5
- After-tax cash flow
- $7,952/yr
For passive investors: Depreciation is non-cash, so a rental often shows a tax loss while cash-flowing — sheltering income. Rental losses are passive: they offset passive income freely, and up to $25,000/yr can offset ordinary (W-2) income if you actively participate and your MAGI is under $100k (phasing out to $0 by $150k); unused losses carry forward. On sale, claimed depreciation is recaptured at up to 25%, and gains may owe capital-gains tax (a 1031 exchange can defer both). Figures are a year-1 estimate at your 24.0% rate — not tax advice; consult a CPA.
Schools (NCES district)
- District
- Orleans Parish
- NCES district ID
- 2201170
- Math proficiency
- 11% ▼ -52.00%
- Reading proficiency
- 27% ▼ -46.00%
- Median HH income
- $37,011
- Composite
- 15.78/100
- National rank
- #9271
- State rank
- #69 of 98 in LA
Livability — New Orleans
- Score
- 81/100
- State rank
- #3
- US rank
- #1383
Category grades
Schools grade is shown separately in the Schools card above.
Census & demographics
- Census place
- New Orleans, LA
- County
- Orleans Parish · 338,817 people
- City population
- 338,817
- Metro
- New Orleans-Metairie, LA
- Population (ZIP)
- 10,404
- Household income
- $52,306
- Rent vs Own
- Severe rent burden
- 1001.0
Population outlook (Orleans County) Hauer SSP2
- Today (2025)
- 513,025 people
- By 2030
- 575,781 · +12.2%
- By 2040
- 700,174 · +36.5%
- By 2050
- 826,541 · +61.1%
- By 2075
- 1,123,374 · +119.0%
- By 2100
- 1,355,609 · +164.2%
Race, ethnicity, and origin ACS 2023
- Neighborhood character
- Diverse neighborhood (Simpson 0.63)
- Race & ethnicity
- White 45% Black 40% Hispanic / Latino 10% Two or more races 8%
- Hispanic origin (detail)
- Mexican 1% Cuban 3%
- Common ancestry
- Lithuanian 6% Slovak 3% Romanian 3%
- Foreign-born
- 5% · Canada
- Languages at home
- 90% English-only · Spanish 6% French/Haitian/Cajun 2%
Political lean MEDSL · Orleans
- 2024 margin
- Solid D (+67.0) · D 82.2% · R 15.2% · Other 2.7%
- 2008→2024 swing
- +6.7pp toward D · 2008: 60.3pp · 2024: 67.0pp
- All cycles
- 2024: D+67.0 2020: D+68.2 2016: D+66.2 2012: D+62.5 2008: D+60.3
Not yet ingested
- Civics
- —
Market trends
- HPI YoY
- ▼ -144.83%
- Current HPI
- 275.5453
- Rent YoY
- ▲ 0.18%
- Metro
- New Orleans-Metairie, LA
- State GDP YoY
- ▲ 3.29%
- F500 in state
- 10
Industry mix (Fortune 500 HQ in LA)
| Industry | F500 HQs | Revenue |
|---|---|---|
| Telecommunications | 2 | $23B |
|
||
| Utilities | 1 | $12B |
|
||
| Wholesale / Distribution | 1 | $5B |
|
||
| Advertising | 1 | $2B |
|
||
Price history
1 event — show timeline
- 2026-06-08 Listed $499,000 AcadianaMLS
Property tax history
+11.8%/yrLatest (2026): $6,815 · +1.1% YoY. Source: county tax records.
Cash-flow waterfall
monthlySold comps — $/sqft
last 12 mo · ≤1 miLoading sold comps…