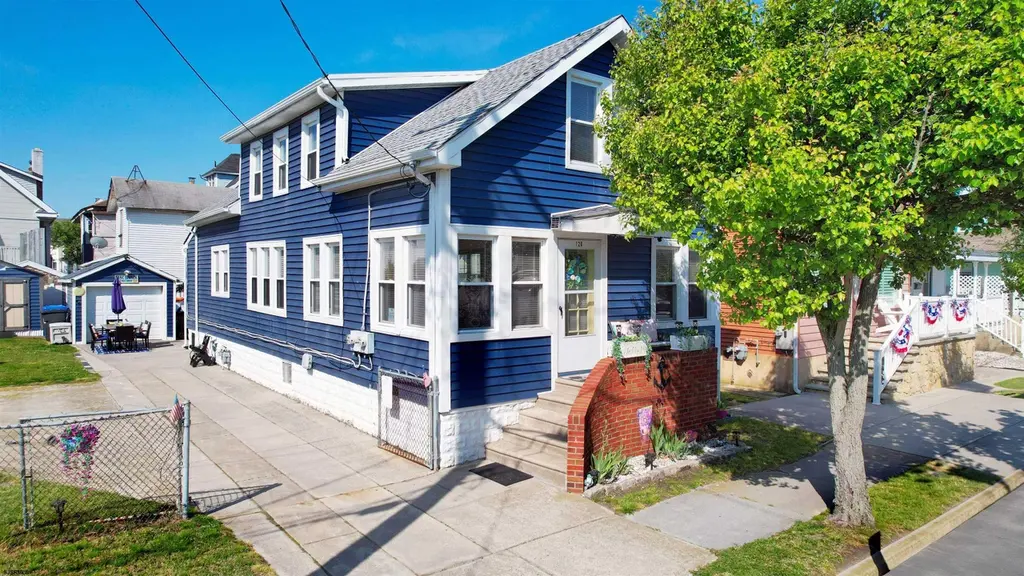
120 W Juniper Ave · Wildwood, NJ
Flood risk 10/10 · Severe
- FEMA flood zone
- AE
- Chance of flooding over 30 yrs
- 0.99%
- Est. flood insurance / yr
- $1,737 – $8,500
Fire risk 2/10 · Minimal
- Est. fire insurance / yr
- $526 – $976
Heat risk 8/10 · Major
- Hot days now (above 95°F)
- 7 days/yr
- Hot days in 30 yrs
- 19 days/yr
Wind risk 8/10 · Major
- Chance of severe wind over 30 yrs
- 80.0%
Air-quality risk 2/10 · Minimal
- Unhealthy air days now
- 1 days/yr
- Unhealthy air days in 30 yrs
- 1 days/yr
Risk factors via First Street. Map © Google.
Why this score? — see what drove the F grade
The composite is a weighted blend of 9 inputs, each scored 0–100. Each bar is that input's sub-score; the figure is the points it added to the 100-point composite (weight × sub-score).
- ARV discount +11.4/15.0
- Cash flow +5.8/30.0
- Livability +3.7/5.0
- Rent growth +2.5/5.0
- Condition / age +2.5/5.0
- Schools +1.6/10.0
- 1% rule +0.4/10.0
- DSCR +0.2/10.0
- Appreciation +0.0/10.0
$724,900
🖨 Deal sheet (PDF) 📄 Offer letter ✓ Due diligence
Listing remarks
* * * * Great location in Wildwood * * * * 5 bedrooms and 3 baths in excellent condition * * * * Pride of ownership shines on this home * * * * First floor has 3 bedrooms and 2 baths * * * * Kitchen with luxury vinyl planking, appliance package that includes microwave and tile back splash * * * * Combo living and dining room with ceiling fans and plenty of windows for natural light * * * 3 nice size bedrooms all with ceiling fans * * * * Laundry room, pantry and plenty of storage * * * * Tankless hot water heater * * * * Second Floor has 2 bedroom and 1 bath * * * * Recently renovated * * * * Eat in kitchen with gas range, dishwasher and ceramic tile flo
Key facts
- Laundry room
- Appliance package
- Eat in kitchen
Tags
Property features AI
Finance
- Other: Survey and seller's property condition and lead-based paint documents available
- Financial info: Property is offered for sale; 2 total units (1 two-bedroom unit, 1 three-bedroom unit)
Exterior
- Parking: Exterior parking for three or more cars (parking pad); One-car garage
- Utilities: Public water; Public sewer; Separate electric and gas meters; Gas tankless water heater
- Home design: Multi-family property with 2 units; Suitable for multi-family + rooms; Located in Boardwalk Area; 45 x 90 lot
- Construction: Vinyl siding; 25+ years old; Crawl space foundation
- Exterior features: Deck; Fenced yard; Outside shower; Shed; Sidewalks; Concrete driveway; Insulated glass
Interior
- Kitchen: Dishwasher; Gas stove; Microwave; Refrigerator
- Bedrooms: Lower unit: 3 bedrooms; Upper unit: 2 bedrooms
- Bathrooms: Lower unit: 2 bathrooms; Upper unit: 1 bathroom
- Heating & cooling: Ceiling fan(s); Natural gas heating; Hot water heating; Radiator heating
- Interior features: Blinds; Partially furnished; Dining area; Pantry; Recreation/family room
- Laundry & utility: Washer; Dryer; Laundry/utility room
Neighborhood map
What this means for you Summary
Snapshot
- This is a 5-bed/3.0-bath single-family listed at $725k.
Deal economics
- At list price, monthly cash flow is $-2k ($-23k/yr) — negative.
- To cash-flow at today's rent, offer at most $392k (46.0% below list).
- To meet the 1% rule (rent ≥ 1% of price), the offer needs to be $394k (45.7% below list).
- Recommended offer: $392k (46.0% below list) — sets the bar for cash-flow.
- Cap rate 3.9% vs local median 5.6% in Wildwood — below-typical yield; the buyer is paying a premium for something (appreciation thesis, condition, location) that the cap rate doesn't capture.
Location & tenants
- Location reads 74/100 on livability (#176 in NJ, #4,679 nationally) — a middle-class / working-renter tenant base. Strengths: amenities A+, commute A+, health & safety A+; Watch: employment D, crime F, cost of living F.
- Wildwood City School District (suburban): math 12% / reading 27% proficiency, ranked #442 of 472 in NJ (top 94%) — low school quality limits family demand, transient renter base, plan for 1-2y turnover; 80% free/reduced lunch — lower-income household profile, screen leases tightly.
- Zoned schools: Glenwood Avenue Elementary School (math 8% / reading 27%, grade F, #1,065 of 1,303 statewide, top 83%, 396 students, 89% FRL); Wildwood Middle School (math 12% / reading 22%, grade F, #409 of 431 statewide, top 95%, 172 students, 87% FRL); Wildwood High School (math 22% / reading 47%, grade F, #239 of 399 statewide, top 61%, 263 students, 69% FRL) — zoned schools at 82% FRL track the district average.
- Market conditions: 436 active listings in the ZIP; 877 units permitted in Cape May County in 2024 (35 in 5+ unit buildings).
Forward outlook
- Local home prices are declining (-3.0%/yr); year-one equity from $5k of loan paydown is wiped out by about $22k of value loss. Plan a longer hold.
- Cape May County population projected at -24% by 2050 — secular population decline; favor cash flow + early exit over multi-decade hold.
Negotiation context
- It's been on market 32 days — a 3% lower offer ($703k) is reasonable based on typical stale-listing flexibility.
- Current owner paid $242k; list at $725k implies a 200% gain — meaningful room to come down on a strong offer.
Risks & watch-outs
- Watch-outs: flood insurance adds $427/mo; built in 1920 — expect roof / HVAC / electrical / plumbing capex.
- Climate carrying-cost: in FEMA flood zone AE (mandatory federal flood insurance); severe wind risk, 80% chance of damaging wind over 30y; extreme-heat days projected 7→19/yr by 2055 (HVAC capex compounding) — expect insurance premiums to compound above CPI over the hold.
Questions for the listing agent
- What do current leases actually rent for vs. the listed asking? Can we see a recent rent roll and the last 12 months of T-12 income?
- It's been on market 32 days. Have you received any prior offers? Is the seller open to a 46% concession, seller financing, or rate buy-down credit?
- Built in 1920 — when were the roof, HVAC, electrical panel, plumbing, and water heater last replaced?
- What's the actual annual flood-insurance premium (NFIP or private), and is the property in a SFHA with mandatory coverage?
- Is there a deadline driving the sale (1031 exchange, divorce, estate, relocation)? That informs how much negotiation room exists.
- Schools are F-rated, which usually means shorter tenancies and higher turnover. Who's the typical renter profile here, and what's been the actual vacancy rate?
- Crime grade is F in this area — have there been break-ins, vandalism, or insurance claims at this property in the last 3 years? What carrier currently insures it and at what premium?
- The area grade is low — what's the realistic commute time and amenity access for the typical tenant pool here? Any planned neighborhood developments (good or bad) we should know about?
- What's the average days-on-market for RENTAL listings here right now (not sales)? A rising rental-DOM trend means longer vacancies and softer asking-rent achievability than the comps imply.
- What's the recent tenant-quality profile in this submarket — average credit score on applications, eviction rate, late-payment / NSF rate, and stable-employment percentage? A property-management company in the area should have these aggregated.
- How much new for-sale + rental construction is in the pipeline within 1–3 miles? Heavy new supply typically softens prices + rents 12–24 months out; constrained supply supports both.
Investment metrics
- 1% rule
- 0.54% ✗
- Cap rate
- 3.88%
- Cash-on-cash
- -8.64%
- DSCR
- 0.62
- GRM
- 15.3
CMA / ARV
- ARV (on-the-fly)
- $794,420
- Comps found
- 7
Show comp detail 7 sales within ~0.75 mi
| Address | Dist | Beds/Ba | Sqft | Sold | Price | $/sf | Match |
|---|---|---|---|---|---|---|---|
| 221 W 25th Ave | 0.15mi | 6/3.0 (+1) | 1,533 (-2%) | 5mo | $775,000 | $506 | 80 |
| 114 E 26th Ave | 0.12mi | 4/2.0 (-1) | 1,416 (-10%) | 2mo | $559,000 | $395 | 68 |
| 505 W Pine Ave | 0.44mi | 4/2.0 (-1) | 1,500 (-4%) | 3mo | $760,000 | $507 | 61 |
| 105 W 13th Ave | 0.72mi | 4/2.0 (-1) | 1,530 (-2%) | 9mo | $900,000 | $588 | 46 |
| 128 W Roberts Ave | 0.68mi | 5/4.0 | 1,750 (+12%) | 5mo | $430,000 | $246 | 41 |
| 1608 Ocean Ave | 0.72mi | 4/3.0 (-1) | 1,652 (+5%) | 15mo | $790,000 | $478 | 40 |
| 204 W 20th Ave | 0.34mi | 4/2.0 (-1) | 1,400 (-11%) | 21mo | $739,900 | $529 | 40 |
Match score weights: distance 35% · size 25% · config 20% · recency 20%. Top-matched comps best support the ARV.
Projected returns pro-forma
-3.0% appreciation · 3.0% rent growth · sell at horizon
- IRR
- -36.6%
- Equity multiple
- -0.17×
- Total profit
- $-237,605
- Equity at exit
- $108,085
- IRR
- -51.6%
- Equity multiple
- -0.78×
- Total profit
- $-361,460
- Equity at exit
- $62,676
Cash invested: $202,972 (down + closing). Projections, not guarantees.
Landlord ↔ Tenant lean methodology
- Overall (STATE)
- 21 Tenant-Leaning
- State New Jersey
- 21 Tenant-Leaning · D+6
- County
- — inherits STATE
- City
- — inherits STATE
ZIP-level market 08260
- Home prices YoY
- -30.7%
- Active inventory
- 436
- Price-to-rent
- 15.3×
Monthly cashflow live
- Estimated rent
- $3,936 medium interval (Pro) →
- Mortgage (P&I)
- −$3,801
- Tax from tax record
- −$466 /mo · $5,594/yr
- Insurance
- −$302
- Flood insurance flood zone
- −$427 /mo · $5,118/yr
- HOA
- −$0
- Vacancy / Maint / Mgmt
- −$826
- Net cashflow
- $-1,887
Break-even live
Sensitivity live
| Price | -10% $-1,477 | -5% $-1,682 | +0% $-1,887 | +5% $-2,092 | +10% $-2,297 |
|---|---|---|---|---|---|
| Rent | -10% $-2,198 | -5% $-2,043 | +0% $-1,887 | +5% $-1,732 | +10% $-1,576 |
| Rate | -1.0pp $-1,522 | -0.5pp $-1,703 | base $-1,887 | +0.5pp $-2,075 | +1.0pp $-2,266 |
UW: 25.0% down · 7.5% · 30yr · 1.5% tax · 5.0% vac · 8.0% maint · 8.0% mgmt
Financing live
Cash to close
- Down payment
- $181,225
- Closing costs
- $21,747
- Reserves months
- —
- Total cash needed
- —
Loan-product check · same deal, 3 products live
Conventional
25% down · 7.5% · 30yr
- Down + closing
- —
- Monthly P&I
- —
- Monthly cashflow
- —
- DSCR
- —
- Eligible?
- —
Personal DTI + credit; lowest rate.
DSCR
20% down · 8.5% · 30yr
- Down + closing
- —
- Monthly P&I
- —
- Monthly cashflow
- —
- DSCR
- —
- Eligible?
- —
No personal income docs; deal must DSCR.
Hard money
10% down · 12.0% · 12mo
- Down + closing
- —
- Monthly P&I
- —
- Monthly cashflow
- —
- DSCR
- —
- Eligible?
- —
Short-term bridge; refi at stabilization.
Listing history 22 events
-
2026-06-21days on market $724,900 Under Contract 32 DOM
-
2026-06-21days on market $724,900 Under Contract 31 DOM
-
2026-06-18days on market $724,900 Under Contract 29 DOM
-
2026-06-17days on market $724,900 Under Contract 28 DOM
-
2026-06-16days on market $724,900 Under Contract 27 DOM
-
2026-06-15days on market $724,900 Under Contract 26 DOM
-
2026-06-13days on market $724,900 Under Contract 24 DOM
-
2026-06-12days on market $724,900 Under Contract 23 DOM
-
2026-06-09days on market $724,900 Under Contract 20 DOM
-
2026-06-08days on market $724,900 Under Contract 19 DOM
-
2026-06-07days on market $724,900 Under Contract 18 DOM
-
2026-06-07days on market $724,900 Under Contract 17 DOM
-
2026-06-04statusdays on market $724,900 Under Contract 14 DOM
-
2026-06-02days on market $724,900 Active 13 DOM
-
2026-06-01days on market $724,900 Active 12 DOM
-
2026-05-31days on market $724,900 Active 11 DOM
-
2026-05-17$724,900 Active
-
2019-01-24soldstatus $242,000
-
2018-12-21soldstatus $242,000
-
2002-11-20soldstatus $183,000
-
2001-12-28soldstatus $82,500
-
1983-06-28soldstatus $62,000
ⓘ Source: listings_history table (triggers on properties + properties_extension) + one-shot
backfill from property_details.listing_events for pre-trigger history.
Tax reassessment forecast NJ · Partial reset (capped growth)
- Current annual tax
- $5,594 · $466/mo
- Projected year-2 tax
- $11,822 · $985/mo
- Expected delta
- +$6,228/yr (+$519/mo · 111.3%)
ⓘ Screening estimate from a state-policy table — verify with the county assessor before closing.
Climate risk First Street
- Flood 10/10 Extreme FEMA zone AE · 99% chance over 30 yrs
- Wildfire 2/10 Low
- Heat 8/10 Severe 7 d/yr ≥95°F today · 19 d/yr by 30 yrs out
- Wind 8/10 Severe 80% chance of damaging wind over 30 yrs
- Air quality 2/10 Low 1 unhealthy d/yr today · 1 by 30 yrs out
Nearby sold comps map
Loading sold comps map…
Walkable amenities ~0.75 mi
Loading nearby amenities…
Taxation est. · year 1
- Rental income
- $47,227
- − Mortgage interest
- −$40,606
- − Property taxes
- −$5,594
- − Insurance
- −$8,743
- − Repairs & maintenance
- −$3,778
- − Management
- −$3,778
- − Depreciation
- −$21,088
- Taxable loss
- −$36,360
- Est. tax savings @ 24.0%
- +$8,726
- After-tax cash flow
- $-13,919/yr
For passive investors: Depreciation is non-cash, so a rental often shows a tax loss while cash-flowing — sheltering income. Rental losses are passive: they offset passive income freely, and up to $25,000/yr can offset ordinary (W-2) income if you actively participate and your MAGI is under $100k (phasing out to $0 by $150k); unused losses carry forward. On sale, claimed depreciation is recaptured at up to 25%, and gains may owe capital-gains tax (a 1031 exchange can defer both). Figures are a year-1 estimate at your 24.0% rate — not tax advice; consult a CPA.
Schools (NCES district)
- District
- Wildwood City School District
- NCES district ID
- 3417940
- Math proficiency
- 12% ▼ -6.00%
- Reading proficiency
- 27% ▲ 5.00%
- Median HH income
- $33,232
- Composite
- 15.84/100
- National rank
- #9261
- State rank
- #442 of 472 in NJ
Livability — Wildwood
- Score
- 74/100
- State rank
- #176
- US rank
- #4679
Category grades
Schools grade is shown separately in the Schools card above.
Census & demographics
- Census place
- Wildwood, NJ
- Population (ZIP)
- 12,913
Population outlook (Cape May County) Hauer SSP2
- Today (2025)
- 88,234 people
- By 2030
- 84,144 · -4.6%
- By 2040
- 75,146 · -14.8%
- By 2050
- 67,389 · -23.6%
- By 2075
- 55,732 · -36.8%
- By 2100
- 44,972 · -49.0%
Race, ethnicity, and origin ACS 2023
- Neighborhood character
- Predominantly White (78%)
- Race & ethnicity
- White 78% Hispanic / Latino 14% Two or more races 7% Black 3% Native American 1%
- Hispanic origin (detail)
- Mexican 10% Puerto Rican 3%
- Common ancestry
- Romanian 7% Slovak 2% Lithuanian 1%
- Foreign-born
- 9% · Canada
- Languages at home
- 84% English-only · Spanish 12% Other Indo-European 3% French/Haitian/Cajun 1%
Political lean MEDSL · Cape May
- 2024 margin
- R (+19.2) · D 39.7% · R 58.9% · Other 1.4%
- 2008→2024 swing
- -10.6pp toward R · 2008: -8.7pp · 2024: -19.2pp
- All cycles
- 2024: R+19.2 2020: R+15.9 2016: R+19.9 2012: R+8.9 2008: R+8.7
Not yet ingested
- Civics
- —
Market trends
- HPI YoY
- ▼ -243.83%
- Current HPI
- 551.3393
- Rent YoY
- —
- Metro
- —
- State GDP YoY
- ▲ 2.05%
- F500 in state
- 34
Industry mix (Fortune 500 HQ in NJ)
| Industry | F500 HQs | Revenue |
|---|---|---|
| Consumer Goods | 3 | $31B |
|
||
| Pharmaceuticals | 2 | $153B |
|
||
| Technology | 2 | $21B |
|
||
| Insurance | 2 | $20B |
|
||
| Healthcare | 2 | $19B |
|
||
| Financial Services | 1 | $70B |
|
||
Price history
+1069.2% since first listed6 events — show timeline
- 2026-05-17 Listed $724,900 SJSRMLS
- 2019-01-24 Sold (Public Records) $242,000 Public Records
- 2018-12-21 Sold (Public Records) $242,000 Public Records
- 2002-11-20 Sold (Public Records) $183,000 Public Records
- 2001-12-28 Sold (Public Records) $82,500 Public Records
- 1983-06-28 Sold (Public Records) $62,000 Public Records
Property tax history
+2.9%/yrLatest (2025): $5,594 · +2.8% YoY. Source: county tax records.
Cash-flow waterfall
monthlySold comps — $/sqft
last 12 mo · ≤1 miLoading sold comps…