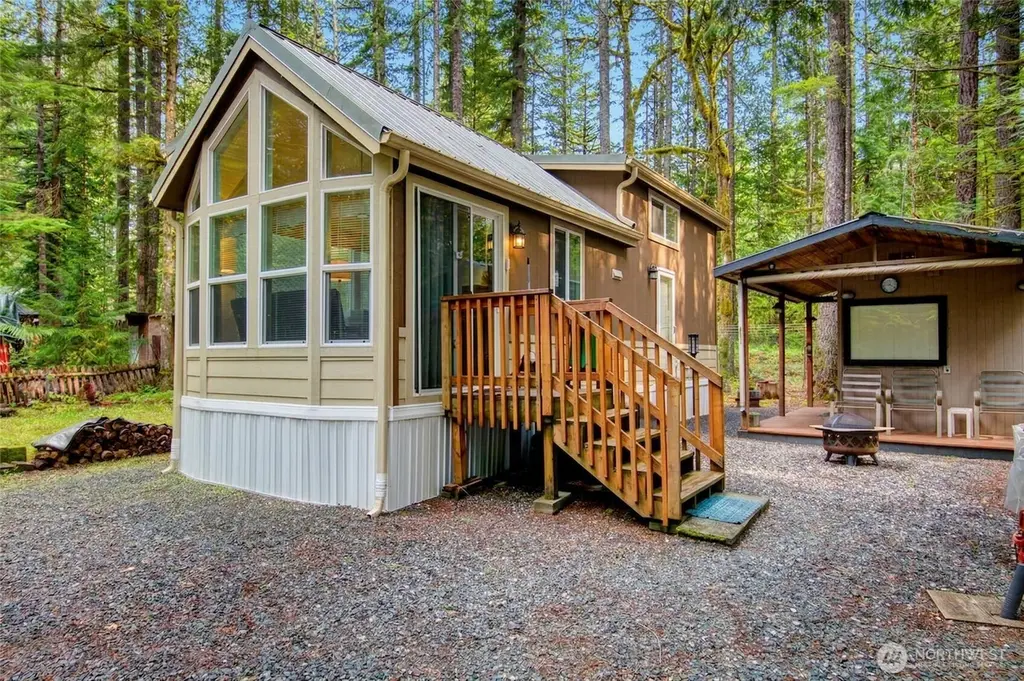
33 2 Wilderness Way · Maple Falls, WA
Flood risk No data
- FEMA flood zone
- —
- Chance of flooding over 30 yrs
- —
- Est. flood insurance / yr
- —
Fire risk No data
- Est. fire insurance / yr
- —
Heat risk No data
- Hot days now (above threshold)
- —
- Hot days in 30 yrs
- —
Wind risk No data
- Chance of severe wind over 30 yrs
- —
Air-quality risk No data
- Unhealthy air days now
- —
- Unhealthy air days in 30 yrs
- —
Risk factors via First Street. Map © Google.
Why this score? — see what drove the B grade
The composite is a weighted blend of 9 inputs, each scored 0–100. Each bar is that input's sub-score; the figure is the points it added to the 100-point composite (weight × sub-score).
- Cash flow +29.4/30.0
- 1% rule +10.0/10.0
- DSCR +10.0/10.0
- ARV discount +7.5/15.0
- Schools +4.2/10.0
- Condition / age +3.8/5.0
- Livability +2.8/5.0
- Rent growth +2.5/5.0
- Appreciation +0.0/10.0
$99,900
🖨 Deal sheet (PDF) 📄 Offer letter ✓ Due diligence
Listing remarks
Sitting on a wide-open lot, this bright and airy park model has a loft and is spacious all around. It boasts a heated water hose, and the furnace can be set to 40 degrees C/104 degrees F without freezing up, making it hassle free year-round! Inside, you'll find plenty of storage space, with no shortage of sleeping areas. There is plenty of room to spread out andrelax! Outside, a shed is on the property for additional and/or larger storage. There is also a firepit to sit around and enjoy the nature around you. The Glen is zoned recreational for 120 days of use out of the year and has all the amenities you could want, including 2 pools, hot tub, tennis court, library, laundry mat, 2 clubhouse
Key facts
- Firepit
- Hot tub
- 2 pools
Tags
Neighborhood map
What this means for you Summary
Snapshot
- This is a 1-bed/1.0-bath manufactured listed at $100k. Condition is rated good.
Deal economics
- At list price, monthly cash flow is $354 ($4k/yr) — positive.
- The deal already cash-flows at list — no discount required.
- Meets the 1% rule at list price ($2k rent vs $100k).
- Recommended offer: $91k (9.0% below list) — sets the bar for market timing.
Location & tenants
- Location reads 56/100 on livability (#544 in WA) — a working-class tenant base; expect higher turnover. Watch: health & safety D, amenities F, commute F.
- Mount Baker School District (rural): math 40% / reading 53% proficiency, ranked #165 of 291 in WA (top 57%) — families likely to look elsewhere, expect single-tenant / working-renter base with shorter leases.
- Market conditions: 143 active listings in the ZIP; 1,190 units permitted in Whatcom County in 2024 (327 in 5+ unit buildings).
Forward outlook
- Local home prices are declining (-3.0%/yr); year-one equity from $691 of loan paydown is wiped out by about $3k of value loss. Plan a longer hold.
- Whatcom County population projected at +28% by 2050 — long-run rental-demand tailwind backs the buy-and-hold thesis.
- At projected returns (-3.0% appreciation + 3.0% rent growth), your $28k cash investment doubles in ~8 years — after that, you're playing with house money.
Negotiation context
- It's been on market 91 days — a 9% lower offer ($91k) is reasonable based on typical stale-listing flexibility.
Questions for the listing agent
- It's been on market 91 days. Have you received any prior offers? Is the seller open to a 9% concession, seller financing, or rate buy-down credit?
- What does the HOA fee cover, when was the last increase, and are there any pending special assessments or reserve-fund shortfalls?
- Why hasn't it sold? Are there any deal-killer items the seller is aware of (foundation, flood, title, zoning, code violations)?
- Is there a deadline driving the sale (1031 exchange, divorce, estate, relocation)? That informs how much negotiation room exists.
- What's the average days-on-market for RENTAL listings here right now (not sales)? A rising rental-DOM trend means longer vacancies and softer asking-rent achievability than the comps imply.
- What's the recent tenant-quality profile in this submarket — average credit score on applications, eviction rate, late-payment / NSF rate, and stable-employment percentage? A property-management company in the area should have these aggregated.
- How much new for-sale + rental construction is in the pipeline within 1–3 miles? Heavy new supply typically softens prices + rents 12–24 months out; constrained supply supports both.
Investment metrics
- 1% rule
- 1.55% ✓
- Cap rate
- 10.55%
- Cash-on-cash
- 15.19%
- DSCR
- 1.68
- GRM
- 5.4
CMA / ARV
- ARV (median comp)
- $53,992
- List price
- $99,900
- Delta
- 85.03%
- Verdict
- OVERPRICED
- Comps
- 20 within 1.0 mi
Show comp detail 12 sales within ~0.75 mi
| Address | Dist | Beds/Ba | Sqft | Sold | Price | $/sf | Match |
|---|---|---|---|---|---|---|---|
| 62 2 Wilderness Way | 0.10mi | 1/1.0 | 380 (-5%) | 3mo | $112,500 | $296 | 84 |
| 112 2 Pioneer Cir | 0.12mi | 1/1.0 | 375 (-6%) | 2mo | $100,000 | $267 | 82 |
| 90 Christmas Tree Cir | 0.21mi | 1/1.0 | 370 (-8%) | 0mo | $44,000 | $119 | 78 |
| 109 Riverside Dr | 0.41mi | 1/1.0 | 392 (-2%) | 2mo | $50,000 | $128 | 76 |
| 183 Big River Blvd E | 0.48mi | 1/1.0 | 399 (-0%) | 2mo | $180,000 | $451 | 76 |
| 92 Riverside Dr | 0.36mi | 1/1.0 | 385 (-4%) | 3mo | $45,000 | $117 | 74 |
| 1383 Schinn Canyon Cir | 0.27mi | 1/1.0 | 374 (-6%) | 3mo | $100,000 | $267 | 74 |
| 187 Fireside Lodge Cir | 0.46mi | 1/1.0 | 396 (-1%) | 6mo | $38,500 | $97 | 72 |
| 175 Big River Blvd E | 0.49mi | 1/1.0 | 385 (-4%) | 1mo | $78,000 | $203 | 70 |
| 101 3 Sunset Cir | 0.16mi | 1/1.0 | 448 (+12%) | 8mo | $25,000 | $56 | 66 |
| 50 3 Schinn Canyon Cir | 0.38mi | 1/1.0 | 350 (-12%) | 3mo | $32,000 | $91 | 59 |
| 215 Big River Blvd E | 0.45mi | 1/1.0 | 350 (-12%) | 0mo | $28,500 | $81 | 58 |
Match score weights: distance 35% · size 25% · config 20% · recency 20%. Top-matched comps best support the ARV.
Projected returns pro-forma
-3.0% appreciation · 3.0% rent growth · sell at horizon
- IRR
- 6.0%
- Equity multiple
- 1.23×
- Total profit
- $6,492
- Equity at exit
- $14,895
- IRR
- 15.4%
- Equity multiple
- 2.26×
- Total profit
- $35,228
- Equity at exit
- $8,638
Cash invested: $27,972 (down + closing). Projections, not guarantees.
Landlord ↔ Tenant lean methodology
- Overall (STATE)
- 28 Tenant-Leaning
- State Washington
- 28 Tenant-Leaning · D+8
- County
- — inherits STATE
- City
- — inherits STATE
ZIP-level market 98244
- Home prices YoY
- -15.7%
- Active inventory
- 143
- Price-to-rent
- 5.4×
Monthly cashflow live
- Estimated rent
- $1,550 medium interval (Pro) →
- Mortgage (P&I)
- −$524
- Tax est. 1.5%
- −$125 /mo · $1,498/yr
- Insurance
- −$42
- HOA
- −$180
- Vacancy / Maint / Mgmt
- −$325
- Net cashflow
- $354
Break-even live
Sensitivity live
| Price | -10% $423 | -5% $389 | +0% $354 | +5% $319 | +10% $285 |
|---|---|---|---|---|---|
| Rent | -10% $232 | -5% $293 | +0% $354 | +5% $415 | +10% $476 |
| Rate | -1.0pp $404 | -0.5pp $379 | base $354 | +0.5pp $328 | +1.0pp $302 |
UW: 25.0% down · 7.5% · 30yr · 1.5% tax · 5.0% vac · 8.0% maint · 8.0% mgmt
Financing live
Cash to close
- Down payment
- $24,975
- Closing costs
- $2,997
- Reserves months
- —
- Total cash needed
- —
Loan-product check · same deal, 3 products live
Conventional
25% down · 7.5% · 30yr
- Down + closing
- —
- Monthly P&I
- —
- Monthly cashflow
- —
- DSCR
- —
- Eligible?
- —
Personal DTI + credit; lowest rate.
DSCR
20% down · 8.5% · 30yr
- Down + closing
- —
- Monthly P&I
- —
- Monthly cashflow
- —
- DSCR
- —
- Eligible?
- —
No personal income docs; deal must DSCR.
Hard money
10% down · 12.0% · 12mo
- Down + closing
- —
- Monthly P&I
- —
- Monthly cashflow
- —
- DSCR
- —
- Eligible?
- —
Short-term bridge; refi at stabilization.
HOA detail
- Monthly dues
- $180 · $2,160/yr
- Likely covers
- waterpool
Listing history 16 events
-
2026-06-18days on market $99,900 Active 91 DOM
-
2026-06-17days on market $99,900 Active 90 DOM
-
2026-06-16days on market $99,900 Active 89 DOM
-
2026-06-15days on market $99,900 Active 88 DOM
-
2026-06-14days on market $99,900 Active 86 DOM
-
2026-06-13days on market $99,900 Active 85 DOM
-
2026-06-10days on market $99,900 Active 83 DOM
-
2026-06-09days on market $99,900 Active 82 DOM
-
2026-06-08days on market $99,900 Active 81 DOM
-
2026-06-07days on market $99,900 Active 80 DOM
-
2026-06-05days on market $99,900 Active 77 DOM
-
2026-06-02days on market $99,900 Active 75 DOM
-
2026-06-01days on market $99,900 Active 74 DOM
-
2026-05-31days on market $99,900 Active 73 DOM
-
2026-05-30days on market $99,900 Active 72 DOM
-
2026-03-19$99,900 Active
ⓘ Source: listings_history table (triggers on properties + properties_extension) + one-shot
backfill from property_details.listing_events for pre-trigger history.
Nearby sold comps map
Loading sold comps map…
Walkable amenities ~0.75 mi
Loading nearby amenities…
Taxation est. · year 1
- Rental income
- $18,598
- − Mortgage interest
- −$5,596
- − Property taxes
- −$1,498
- − Insurance
- −$500
- − Repairs & maintenance
- −$1,488
- − Management
- −$1,488
- − HOA
- −$2,160
- − Depreciation
- −$2,906
- Taxable income
- $2,962
- Est. tax owed @ 24.0%
- −$711
- After-tax cash flow
- $3,537/yr
For passive investors: Depreciation is non-cash, so a rental often shows a tax loss while cash-flowing — sheltering income. Rental losses are passive: they offset passive income freely, and up to $25,000/yr can offset ordinary (W-2) income if you actively participate and your MAGI is under $100k (phasing out to $0 by $150k); unused losses carry forward. On sale, claimed depreciation is recaptured at up to 25%, and gains may owe capital-gains tax (a 1031 exchange can defer both). Figures are a year-1 estimate at your 24.0% rate — not tax advice; consult a CPA.
Condition & rehab AI · 12 photos
This park model is in good condition with minor repairs needed. It offers a spacious and well-maintained living space with potential for updates to enhance its resale and rental value.
Repairs flagged
- Minor staircase carpet — worn but still functional
- Minor kitchen backsplash — slight discoloration
Value-add opportunities
- Both paint interior walls — enhances curb appeal and interior aesthetics
- Both replace kitchen backsplash — improves functionality and aesthetics
- Both update flooring in kitchen — modernizes space and improves functionality
- Both update exterior siding — enhances curb appeal and improves home value
Renovation cost estimate screening
| Repair item | Severity | Est. cost |
|---|---|---|
| staircase carpet · worn but still functional | Minor | $500–3,000 |
| kitchen backsplash · slight discoloration | Minor | $500–3,000 |
| Total estimated repair cost · 2 items | $1,000–6,000 |
Value-add ROI direction
- Both paint interior walls — enhances curb appeal and interior aesthetics ↑
- Both replace kitchen backsplash — improves functionality and aesthetics ↑
- Both update flooring in kitchen — modernizes space and improves functionality ↑
- Both update exterior siding — enhances curb appeal and improves home value ↑
ⓘ Cost ranges are severity-bucket heuristics (US national rule-of-thumb). Get contractor quotes + a written scope before underwriting a rehab budget.
Schools (NCES district)
- District
- Mount Baker School District
- NCES district ID
- 5305310
- Math proficiency
- 40% ▲ 3.00%
- Reading proficiency
- 53% ▼ -1.00%
- Median HH income
- $53,695
- Composite
- 42.37/100
- National rank
- #6931
- State rank
- #165 of 291 in WA
Livability — Maple Falls
- Score
- 56/100
- State rank
- #544
- US rank
- #22984
Category grades
Schools grade is shown separately in the Schools card above.
Census & demographics
- Census place
- Maple Falls, WA
- Population (ZIP)
- 3,080
Population outlook (Whatcom County) Hauer SSP2
- Today (2025)
- 240,408 people
- By 2030
- 254,667 · +5.9%
- By 2040
- 281,365 · +17.0%
- By 2050
- 307,592 · +27.9%
- By 2075
- 375,576 · +56.2%
- By 2100
- 421,637 · +75.4%
Race, ethnicity, and origin ACS 2023
- Neighborhood character
- Predominantly White (80%)
- Race & ethnicity
- White 80% Native American 9% Two or more races 9% Asian 1%
- Common ancestry
- Slovak 6% Lithuanian 3% Serbian 3%
- Foreign-born
- 6% · Canada
- Languages at home
- 93% English-only · German/W. Germanic 2% Other Asian/Pacific 2% Korean 1%
Political lean MEDSL · Whatcom
- 2024 margin
- Strong D (+24.9) · D 60.8% · R 35.9% · Other 3.3%
- 2008→2024 swing
- +6.9pp toward D · 2008: 18.0pp · 2024: 24.9pp
- All cycles
- 2024: D+24.9 2020: D+23.9 2016: D+17.7 2012: D+12.1 2008: D+18.0
Not yet ingested
- Civics
- —
Market trends
- HPI YoY
- ▼ -78.13%
- Current HPI
- 420.4673
- Rent YoY
- —
- Metro
- —
- State GDP YoY
- ▲ 4.65%
- F500 in state
- 22
Industry mix (Fortune 500 HQ in WA)
| Industry | F500 HQs | Revenue |
|---|---|---|
| Retail | 2 | $269B |
|
||
| Technology / Retail | 1 | $638B |
|
||
| Technology | 1 | $245B |
|
||
| Telecommunications | 1 | $38B |
|
||
| Food / Beverage | 1 | $36B |
|
||
| Automotive / Trucks | 1 | $34B |
|
||
Price history
1 event — show timeline
- 2026-03-19 Listed $99,900 NWMLS as Distributed by MLS Grid
Cash-flow waterfall
monthlySold comps — $/sqft
last 12 mo · ≤1 miLoading sold comps…