1140 101st Ln NW · Coon Rapids, MN
Flood risk 8/10 · Major
- FEMA flood zone
- X (shaded)
- Chance of flooding over 30 yrs
- 0.99%
- Est. flood insurance / yr
- $507 – $1,088
Fire risk 1/10 · Minimal
- Est. fire insurance / yr
- $888 – $1,650
Heat risk 2/10 · Minimal
- Hot days now (above 99°F)
- 7 days/yr
- Hot days in 30 yrs
- 14 days/yr
Wind risk 2/10 · Minimal
- Chance of severe wind over 30 yrs
- —
Air-quality risk 2/10 · Minimal
- Unhealthy air days now
- 2 days/yr
- Unhealthy air days in 30 yrs
- 2 days/yr
Risk factors via First Street. Map © Google.
Why this score? — see what drove the B grade
The composite is a weighted blend of 9 inputs, each scored 0–100. Each bar is that input's sub-score; the figure is the points it added to the 100-point composite (weight × sub-score).
- Cash flow +30.0/30.0
- DSCR +10.0/10.0
- 1% rule +8.2/10.0
- ARV discount +7.5/15.0
- Schools +4.7/10.0
- Livability +4.3/5.0
- Condition / age +4.0/5.0
- Rent growth +3.9/5.0
- Appreciation +0.0/10.0
$125,000
🖨 Deal sheet (PDF) 📄 Offer letter ✓ Due diligence
Listing remarks
Visit link for official listing and Inquiry details! https://www. mhvillage.com/homes/3459855 Beautiful Mid Country Westlake Sapphire 2024 located in Creekside Estates Mhp! One owner bought Brand New from Matts Homes 2024 Manufacturer date! Premium Luxury Model home with many upgrades! Home is Owner Occupied! All Ages Community Creekside Estates, Coon Rapids, MN 55433 Recently Listed Serial #: WW13476A Buy: $125,000 Lot Rent: $595 per month 3 Bed / 2 Bath 1,216 Sq. Ft. (16 & Atilde; & mdash; 76) Email Seller / Call Seller
Key facts
- Built 2024
- Listed 23 days
Neighborhood map
What this means for you Summary
Snapshot
- This is a 3-bed/2.0-bath manufactured listed at $125k. Condition is rated good.
Deal economics
- At list price, monthly cash flow is $433 ($5k/yr) — positive.
- The deal already cash-flows at list — no discount required.
- Meets the 1% rule at list price ($2k rent vs $125k).
- Recommended offer: $123k (1.5% below list) — sets the bar for market timing.
- Cap rate 11.1% vs local median 3.8% in Coon Rapids — top-decile yield for the area; either an underpriced asset or a hidden risk that comps aren't pricing in. Stress-test before assuming the spread holds.
Location & tenants
- Location reads 86/100 on livability (#12 in MN, #390 nationally) — a professional / high-income tenant draw. Strengths: commute A+, employment A+, housing A+; Watch: amenities D.
- Anoka-Hennepin Public School District (suburban): math 49% / reading 55% proficiency, ranked #71 of 301 in MN (top 24%) — acceptable for families but not a draw, mixed tenant base, ~2y average lease.
- Market conditions: Rents rising fast (+5.4%/yr); 119 active listings in the ZIP; 12 comparable units currently listed for rent nearby; rentals leasing fast (median 13d on market — plan ~1-2 weeks tenant-placement turnaround); solid renter incomes; 1,083 units permitted in Anoka County in 2024 (134 in 5+ unit buildings).
Forward outlook
- Local home prices are declining (-3.0%/yr); year-one equity from $864 of loan paydown is wiped out by about $4k of value loss. Plan a longer hold.
- Anoka County population projected at +11% by 2050 — modest demand growth; plan on rents tracking national, not racing it.
- At projected returns (-3.0% appreciation + 5.4% rent growth), your $35k cash investment doubles in ~7 years — after that, you're playing with house money.
Negotiation context
- It's been on market 23 days — a 2% lower offer ($123k) is reasonable based on typical stale-listing flexibility.
Risks & watch-outs
- Watch-outs: flood insurance adds $66/mo.
- Climate carrying-cost: severe flood risk — expect insurance premiums to compound above CPI over the hold.
Questions for the listing agent
- What's the actual annual flood-insurance premium (NFIP or private), and is the property in a SFHA with mandatory coverage?
- Is there a deadline driving the sale (1031 exchange, divorce, estate, relocation)? That informs how much negotiation room exists.
- Schools are B-rated — typically a magnet for longer-tenancy family renters. What's the average tenant stay here, and is there a school-zone premium baked into asking?
- What's the average days-on-market for RENTAL listings here right now (not sales)? A rising rental-DOM trend means longer vacancies and softer asking-rent achievability than the comps imply.
- What's the recent tenant-quality profile in this submarket — average credit score on applications, eviction rate, late-payment / NSF rate, and stable-employment percentage? A property-management company in the area should have these aggregated.
- How much new for-sale + rental construction is in the pipeline within 1–3 miles? Heavy new supply typically softens prices + rents 12–24 months out; constrained supply supports both.
Investment metrics
- 1% rule
- 1.32% ✓
- Cap rate
- 11.08%
- Cash-on-cash
- 17.11%
- DSCR
- 1.76
- GRM
- 6.3
CMA / ARV
No comps found within radius.
Projected returns pro-forma
-3.0% appreciation · 5.43% rent growth · sell at horizon
- IRR
- 8.1%
- Equity multiple
- 1.33×
- Total profit
- $11,458
- Equity at exit
- $18,638
- IRR
- 19.4%
- Equity multiple
- 2.81×
- Total profit
- $63,403
- Equity at exit
- $10,808
Cash invested: $35,000 (down + closing). Projections, not guarantees.
Landlord ↔ Tenant lean methodology
- Overall (STATE)
- 46 Balanced
- State Minnesota
- 46 Balanced · D+2
- County
- — inherits STATE
- City
- — inherits STATE
ZIP-level market 55433
- Rents YoY
- 5.4%
- Active inventory
- 119
- Price-to-rent
- 6.3×
Monthly cashflow live
- Estimated rent
- $1,651 high interval (Pro) →
- Mortgage (P&I)
- −$656
- Tax from tax record
- −$97 /mo · $1,170/yr
- Insurance
- −$52
- Flood insurance flood zone
- −$66 /mo · $798/yr
- HOA
- −$0
- Vacancy / Maint / Mgmt
- −$347
- Net cashflow
- $433
Break-even live
Sensitivity live
| Price | -10% $503 | -5% $468 | +0% $433 | +5% $397 | +10% $362 |
|---|---|---|---|---|---|
| Rent | -10% $302 | -5% $367 | +0% $433 | +5% $498 | +10% $563 |
| Rate | -1.0pp $496 | -0.5pp $464 | base $433 | +0.5pp $400 | +1.0pp $367 |
UW: 25.0% down · 7.5% · 30yr · 1.5% tax · 5.0% vac · 8.0% maint · 8.0% mgmt
Financing live
Cash to close
- Down payment
- $31,250
- Closing costs
- $3,750
- Reserves months
- —
- Total cash needed
- —
Loan-product check · same deal, 3 products live
Conventional
25% down · 7.5% · 30yr
- Down + closing
- —
- Monthly P&I
- —
- Monthly cashflow
- —
- DSCR
- —
- Eligible?
- —
Personal DTI + credit; lowest rate.
DSCR
20% down · 8.5% · 30yr
- Down + closing
- —
- Monthly P&I
- —
- Monthly cashflow
- —
- DSCR
- —
- Eligible?
- —
No personal income docs; deal must DSCR.
Hard money
10% down · 12.0% · 12mo
- Down + closing
- —
- Monthly P&I
- —
- Monthly cashflow
- —
- DSCR
- —
- Eligible?
- —
Short-term bridge; refi at stabilization.
Rent comps 12 comps
| Address | Beds | Baths | Sqft | Rent | $/sqft | DOM | Units | Dist |
|---|---|---|---|---|---|---|---|---|
| 9950 Redwood St NW Minneapolis, MN | 1.0–2.0 | 1.0 | 859 | $1,300 | $1.51 | 44d | 1 | 0.35mi |
| 1410 100th Ave NW Minneapolis, MN | 1.0–2.0 | 1.0 | 932 | $1,550 | $1.66 | 3d | 11 | 0.46mi |
| 9900 Bluebird St NW Minneapolis, MN | 2.0 | 1.0 | 850 | $1,358 | $1.60 | 3d | 3 | 0.49mi |
| 10630 Tamarack St NW Minneapolis, MN | 3.0 | 1.0 | 900 | $1,424 | $1.58 | 24d | 1 | 0.58mi |
| 9787 Palm St NW Minneapolis, MN | 2.0 | 1.0 | 903 | $1,500 | $1.66 | 5d | 6 | 0.60mi |
| 750 99th Ave NW Minneapolis, MN | 2.0–3.0 | 1.5–2.0 | 1195 | $1,725 | $1.44 | 13d | 4 | 0.65mi |
| 862 Coon Rapids Blvd NW Unit NA Coon Rapids, MN | 2.0 | 2.5 | 1495 | $2,200 | $1.47 | 44d | 1 | 0.74mi |
| 10590 Kumquat St NW Minneapolis, MN | 2.0 | 1.0 | 1313 | $1,650 | $1.26 | 11d | 1 | 0.80mi |
| 10400 Jay St NW Minneapolis, MN | 1.0–3.0 | 1.0–2.0 | 962 | $1,775 | $1.85 | 3d | 1 | 0.92mi |
| 1921 103rd Ave NW Apt 4 Minneapolis, MN | 2.0 | 1.0 | 750 | $1,425 | $1.90 | 18d | 1 | 1.00mi |
| 10701 Hanson Blvd NW Coon Rapids, MN | 1.0–2.0 | 1.0–2.0 | 824 | $1,330 | $1.61 | 5d | 1 | 1.14mi |
| 10060 Dogwood St NW Minneapolis, MN | 2.0–3.0 | 2.0 | 1240 | $1,895 | $1.53 | 24d | 2 | 1.15mi |
Listing history 15 events
-
2026-06-18days on market $125,000 Active 23 DOM
-
2026-06-17days on market $125,000 Active 22 DOM
-
2026-06-16days on market $125,000 Active 21 DOM
-
2026-06-15days on market $125,000 Active 20 DOM
-
2026-06-13days on market $125,000 Active 18 DOM
-
2026-06-13days on market $125,000 Active 17 DOM
-
2026-06-09days on market $125,000 Active 14 DOM
-
2026-06-08days on market $125,000 Active 13 DOM
-
2026-06-07days on market $125,000 Active 12 DOM
-
2026-06-04days on market $125,000 Active 9 DOM
-
2026-06-03days on market $125,000 Active 8 DOM
-
2026-06-02days on market $125,000 Active 7 DOM
-
2026-06-01days on market $125,000 Active 6 DOM
-
2026-05-31days on market $125,000 Active 5 DOM
-
2026-05-26$125,000 Active
ⓘ Source: listings_history table (triggers on properties + properties_extension) + one-shot
backfill from property_details.listing_events for pre-trigger history.
Tax reassessment forecast MN · Partial reset (capped growth)
- Current annual tax
- $1,170 · $97/mo
- Projected year-2 tax
- $1,285 · $107/mo
- Expected delta
- +$115/yr (+$10/mo · 9.8%)
ⓘ Screening estimate from a state-policy table — verify with the county assessor before closing.
Climate risk First Street
- Flood 8/10 Severe FEMA zone X (shaded) · 99% chance over 30 yrs
- Wildfire 1/10 Low
- Heat 2/10 Low 7 d/yr ≥99°F today · 14 d/yr by 30 yrs out
- Wind 2/10 Low
- Air quality 2/10 Low 2 unhealthy d/yr today · 2 by 30 yrs out
Nearby sold comps map
Loading sold comps map…
Walkable amenities ~0.75 mi
Loading nearby amenities…
Taxation est. · year 1
- Rental income
- $19,809
- − Mortgage interest
- −$7,002
- − Property taxes
- −$1,170
- − Insurance
- −$1,422
- − Repairs & maintenance
- −$1,585
- − Management
- −$1,585
- − Depreciation
- −$3,636
- Taxable income
- $3,409
- Est. tax owed @ 24.0%
- −$818
- After-tax cash flow
- $4,373/yr
For passive investors: Depreciation is non-cash, so a rental often shows a tax loss while cash-flowing — sheltering income. Rental losses are passive: they offset passive income freely, and up to $25,000/yr can offset ordinary (W-2) income if you actively participate and your MAGI is under $100k (phasing out to $0 by $150k); unused losses carry forward. On sale, claimed depreciation is recaptured at up to 25%, and gains may owe capital-gains tax (a 1031 exchange can defer both). Figures are a year-1 estimate at your 24.0% rate — not tax advice; consult a CPA.
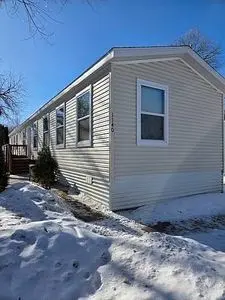
Condition & rehab AI · 1 photo
This manufactured home is in good condition with minimal repairs needed. Upgrades in appearance and functionality can significantly increase its value for resale or rental.
Value-add opportunities
- Both Painting the exterior and interior — Fresh paint can enhance curb appeal and interior aesthetics.
- Both Landscaping improvements — Enhanced landscaping can improve curb appeal and attract potential buyers/tenants.
- Both New flooring in high-traffic areas — New flooring can improve the home's appearance and reduce maintenance costs.
- Both Upgrading the HVAC system — A new HVAC system can improve comfort and energy efficiency, attracting more buyers/tenants.
- Both Upgrading the kitchen appliances — Modern appliances can make the kitchen more appealing and functional for potential buyers/tenants.
Renovation cost estimate screening
Value-add ROI direction
- Both Painting the exterior and interior — Fresh paint can enhance curb appeal and interior aesthetics. ↑
- Both Landscaping improvements — Enhanced landscaping can improve curb appeal and attract potential buyers/tenants. ↑
- Both New flooring in high-traffic areas — New flooring can improve the home's appearance and reduce maintenance costs. ↑
- Both Upgrading the HVAC system — A new HVAC system can improve comfort and energy efficiency, attracting more buyers/tenants. ↑
- Both Upgrading the kitchen appliances — Modern appliances can make the kitchen more appealing and functional for potential buyers/tenants. ↑
ⓘ Cost ranges are severity-bucket heuristics (US national rule-of-thumb). Get contractor quotes + a written scope before underwriting a rehab budget.
Schools (NCES district)
- District
- Anoka-Hennepin Public School District
- NCES district ID
- 2703180
- Math proficiency
- 49% ▼ -14.00%
- Reading proficiency
- 55% ▼ -10.00%
- Median HH income
- $73,837
- Composite
- 46.7/100
- National rank
- #2400
- State rank
- #71 of 301 in MN
Livability — Coon Rapids
- Score
- 86/100
- State rank
- #12
- US rank
- #390
Category grades
Schools grade is shown separately in the Schools card above.
Census & demographics
- Census place
- Coon Rapids, MN
- County
- Anoka County · 277,116 people
- City population
- 63,468
- Metro
- Minneapolis-St. Paul-Bloomington, MN-WI
- Population (ZIP)
- 34,463
- Household income
- $78,054
- Rent vs Own
- Severe rent burden
- 1129.0
Population outlook (Anoka County) Hauer SSP2
- Today (2025)
- 375,223 people
- By 2030
- 387,850 · +3.4%
- By 2040
- 407,239 · +8.5%
- By 2050
- 417,541 · +11.3%
- By 2075
- 448,447 · +19.5%
- By 2100
- 464,954 · +23.9%
Race, ethnicity, and origin ACS 2023
- Neighborhood character
- Predominantly White (70%)
- Race & ethnicity
- White 70% Black 9% Asian 9% Two or more races 9% Hispanic / Latino 5%
- Common ancestry
- Portuguese 12% Romanian 5% Italian 3%
- Foreign-born
- 9% · Canada, Vietnam
- Languages at home
- 90% English-only · Other Asian/Pacific 3% Spanish 2% Other Indo-European 1%
Political lean MEDSL · Anoka
- 2024 margin
- Toss-up / Even · D 46.6% · R 51.0% · Other 2.4%
- 2008→2024 swing
- -2.0pp toward R · 2008: -2.4pp · 2024: -4.4pp
- All cycles
- 2024: R+4.4 2020: R+1.9 2016: R+9.7 2012: R+2.6 2008: R+2.4
Not yet ingested
- Civics
- —
Market trends
- HPI YoY
- ▼ -243.93%
- Current HPI
- 260.1237
- Rent YoY
- ▲ 5.43%
- Metro
- Minneapolis-St. Paul-Bloomington, MN-WI
- State GDP YoY
- ▲ 2.41%
- F500 in state
- 34
Industry mix (Fortune 500 HQ in MN)
| Industry | F500 HQs | Revenue |
|---|---|---|
| Healthcare | 2 | $407B |
|
||
| Retail | 2 | $150B |
|
||
| Consumer Goods | 2 | $32B |
|
||
| Industrial Machinery | 2 | $6B |
|
||
| Agriculture | 1 | $40B |
|
||
| Healthcare / Medical Devices | 1 | $32B |
|
||
Price history
1 event — show timeline
- 2026-05-26 Listed $125,000 FSBO.com
Property tax history
+25.9%/yrLatest (2026): $1,170 · +25.9% YoY. Source: county tax records.
Cash-flow waterfall
monthlySold comps — $/sqft
last 12 mo · ≤1 miLoading sold comps…