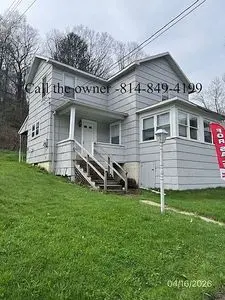
3462 Kearney Rd · Brockway, PA
Flood risk 7/10 · Major
- FEMA flood zone
- X (unshaded)
- Chance of flooding over 30 yrs
- 0.77%
- Est. flood insurance / yr
- $507 – $1,088
Fire risk 1/10 · Minimal
- Est. fire insurance / yr
- $511 – $949
Heat risk 2/10 · Minimal
- Hot days now (above 90°F)
- 7 days/yr
- Hot days in 30 yrs
- 18 days/yr
Wind risk 2/10 · Minimal
- Chance of severe wind over 30 yrs
- —
Air-quality risk 2/10 · Minimal
- Unhealthy air days now
- 1 days/yr
- Unhealthy air days in 30 yrs
- 2 days/yr
Risk factors via First Street. Map © Google.
Why this score? — see what drove the B+ grade
The composite is a weighted blend of 9 inputs, each scored 0–100. Each bar is that input's sub-score; the figure is the points it added to the 100-point composite (weight × sub-score).
- Cash flow +30.0/30.0
- 1% rule +10.0/10.0
- DSCR +10.0/10.0
- ARV discount +7.5/15.0
- Appreciation +5.4/10.0
- Schools +4.8/10.0
- Livability +3.8/5.0
- Rent growth +2.5/5.0
- Condition / age +2.5/5.0
$59,700
🖨 Deal sheet 📄 Offer letter ✓ Due diligence
Listing remarks
This three bedroom home offers comfortable living at an affordable price. It has a large yard and is located close to town. The interior of the house is in good shape and the home was painted last year. In the kitchen there is a built in oven and a built in range top. There& apos; s a front porch to talk to the neighbors and a back porch for quiet morning coffee or tea. There& apos; s a sun porch that is perfect for plants or a study/office.
Key facts
- Sun porch
- Built in range top
- Front porch
Tags
Neighborhood map
What this means for you Summary
Snapshot
- This is a 3-bed/1.0-bath other listed at $60k.
Deal economics
- At list price, monthly cash flow is $225 ($3k/yr) — positive.
- The deal already cash-flows at list — no discount required.
- Meets the 1% rule at list price ($925 rent vs $60k).
- Recommended offer: $58k (3.0% below list) — sets the bar for market timing.
Location & tenants
- Location reads 75/100 on livability (#450 in PA, #4,128 nationally) — a middle-class / working-renter tenant base. Strengths: crime A+, cost of living A+, housing A; Watch: health & safety D+, amenities F, commute F.
- Brockway Area SD (rural): math 50% / reading 64% proficiency, ranked #100 of 539 in PA (top 19%) — acceptable for families but not a draw, mixed tenant base, ~2y average lease.
- Market conditions: 2 active listings in the ZIP; 41 units permitted in Jefferson County in 2024 (0 in 5+ unit buildings).
Forward outlook
- In year one you build about $862 of equity ($413 loan paydown + $449 appreciation (0.8% local appreciation)).
- Jefferson County population projected at -22% by 2050 — secular population decline; favor cash flow + early exit over multi-decade hold.
- At projected returns (0.8% appreciation + 3.0% rent growth), your $17k cash investment doubles in ~5 years — after that, you're playing with house money.
Negotiation context
- It's been on market 37 days — a 3% lower offer ($58k) is reasonable based on typical stale-listing flexibility.
- Current owner paid $34k; list at $60k implies a 76% gain — meaningful room to come down on a strong offer.
Risks & watch-outs
- Watch-outs: flood insurance adds $66/mo; built in 1898 — expect roof / HVAC / electrical / plumbing capex.
- Climate carrying-cost: major flood risk — expect insurance premiums to compound above CPI over the hold.
Questions for the listing agent
- It's been on market 37 days. Have you received any prior offers? Is the seller open to a 3% concession, seller financing, or rate buy-down credit?
- Built in 1898 — when were the roof, HVAC, electrical panel, plumbing, and water heater last replaced?
- What's the actual annual flood-insurance premium (NFIP or private), and is the property in a SFHA with mandatory coverage?
- Is there a deadline driving the sale (1031 exchange, divorce, estate, relocation)? That informs how much negotiation room exists.
- Schools are B-rated — typically a magnet for longer-tenancy family renters. What's the average tenant stay here, and is there a school-zone premium baked into asking?
- What's the average days-on-market for RENTAL listings here right now (not sales)? A rising rental-DOM trend means longer vacancies and softer asking-rent achievability than the comps imply.
- What's the recent tenant-quality profile in this submarket — average credit score on applications, eviction rate, late-payment / NSF rate, and stable-employment percentage? A property-management company in the area should have these aggregated.
- How much new for-sale + rental construction is in the pipeline within 1–3 miles? Heavy new supply typically softens prices + rents 12–24 months out; constrained supply supports both.
Investment metrics
- 1% rule
- 1.55% ✓
- Cap rate
- 12.16%
- Cash-on-cash
- 20.94%
- DSCR
- 1.93
- GRM
- 5.4
CMA / ARV
No comps found within radius.
Projected returns pro-forma
0.75% appreciation · 3.0% rent growth · sell at horizon
- IRR
- 17.6%
- Equity multiple
- 1.89×
- Total profit
- $14,814
- Equity at exit
- $19,615
- IRR
- 21.2%
- Equity multiple
- 3.51×
- Total profit
- $41,996
- Equity at exit
- $25,484
Cash invested: $16,716 (down + closing). Projections, not guarantees.
Landlord ↔ Tenant lean methodology
- Overall (STATE)
- 62 Landlord-Friendly
- State Pennsylvania
- 62 Landlord-Friendly · EVEN
- County
- — inherits STATE
- City
- — inherits STATE
ZIP-level market 15824
- Home prices YoY
- 0.4%
- Active inventory
- 2
- Price-to-rent
- 5.4×
Monthly cashflow live
- Estimated rent
- $925 medium interval (Pro) →
- Mortgage (P&I)
- −$313
- Tax from tax record
- −$101 /mo · $1,217/yr
- Insurance
- −$25
- Flood insurance flood zone
- −$66 /mo · $798/yr
- HOA
- −$0
- Vacancy / Maint / Mgmt
- −$194
- Net cashflow
- $225
Break-even live
UW: 25.0% down · 7.5% · 30yr · 1.5% tax · 5.0% vac · 8.0% maint · 8.0% mgmt
Financing live
Cash to close
- Down payment
- $14,925
- Closing costs
- $1,791
- Reserves months
- —
- Total cash needed
- —
Loan-product check · same deal, 3 products live
Conventional
25% down · 7.5% · 30yr
- Down + closing
- —
- Monthly P&I
- —
- Monthly cashflow
- —
- DSCR
- —
- Eligible?
- —
Personal DTI + credit; lowest rate.
DSCR
20% down · 8.5% · 30yr
- Down + closing
- —
- Monthly P&I
- —
- Monthly cashflow
- —
- DSCR
- —
- Eligible?
- —
No personal income docs; deal must DSCR.
Hard money
10% down · 12.0% · 12mo
- Down + closing
- —
- Monthly P&I
- —
- Monthly cashflow
- —
- DSCR
- —
- Eligible?
- —
Short-term bridge; refi at stabilization.
Listing history 16 events
-
2026-06-18days on market $59,700 Active 37 DOM
-
2026-06-17days on market $59,700 Active 36 DOM
-
2026-06-16days on market $59,700 Active 35 DOM
-
2026-06-15days on market $59,700 Active 34 DOM
-
2026-06-13days on market $59,700 Active 32 DOM
-
2026-06-12days on market $59,700 Active 31 DOM
-
2026-06-09days on market $59,700 Active 28 DOM
-
2026-06-08days on market $59,700 Active 27 DOM
-
2026-06-08days on market $59,700 Active 26 DOM
-
2026-06-07days on market $59,700 Active 25 DOM
-
2026-06-04days on market $59,700 Active 22 DOM
-
2026-06-02days on market $59,700 Active 21 DOM
-
2026-06-01days on market $59,700 Active 20 DOM
-
2026-05-31days on market $59,700 Active 19 DOM
-
2026-05-12$59,700 Active 431-char remark
-
2006-08-25soldstatus $34,000
ⓘ Source: listings_history table (triggers on properties + properties_extension) + one-shot
backfill from property_details.listing_events for pre-trigger history.
Tax reassessment forecast PA · Partial reset (capped growth)
- Current annual tax
- $1,217 · $101/mo
- Projected year-2 tax
- $1,217 · $101/mo
- Expected delta
- $0/yr ($0/mo · 0.0%)
ⓘ Screening estimate from a state-policy table — verify with the county assessor before closing.
Climate risk First Street
- Flood 7/10 Severe FEMA zone X (unshaded) · 77% chance over 30 yrs
- Wildfire 1/10 Low
- Heat 2/10 Low 7 d/yr ≥90°F today · 18 d/yr by 30 yrs out
- Wind 2/10 Low
- Air quality 2/10 Low 1 unhealthy d/yr today · 2 by 30 yrs out
Nearby sold comps map
Loading sold comps map…
Walkable amenities ~0.75 mi
Loading nearby amenities…
Taxation est. · year 1
- Rental income
- $11,105
- − Mortgage interest
- −$3,344
- − Property taxes
- −$1,217
- − Insurance
- −$1,096
- − Repairs & maintenance
- −$888
- − Management
- −$888
- − Depreciation
- −$1,737
- Taxable income
- $1,934
- Est. tax owed @ 24.0%
- −$464
- After-tax cash flow
- $2,239/yr
For passive investors: Depreciation is non-cash, so a rental often shows a tax loss while cash-flowing — sheltering income. Rental losses are passive: they offset passive income freely, and up to $25,000/yr can offset ordinary (W-2) income if you actively participate and your MAGI is under $100k (phasing out to $0 by $150k); unused losses carry forward. On sale, claimed depreciation is recaptured at up to 25%, and gains may owe capital-gains tax (a 1031 exchange can defer both). Figures are a year-1 estimate at your 24.0% rate — not tax advice; consult a CPA.
Schools (NCES district)
- District
- Brockway Area SD
- NCES district ID
- 4204260
- Math proficiency
- 50% ▼ -6.00%
- Reading proficiency
- 64% ▼ -7.00%
- Median HH income
- $45,538
- Composite
- 48.11/100
- National rank
- #2185
- State rank
- #100 of 539 in PA
Livability — Brockway
- Score
- 75/100
- State rank
- #450
- US rank
- #4128
Category grades
Schools grade is shown separately in the Schools card above.
Census & demographics
- Census place
- Brockway, PA
- Population (ZIP)
- 4,954
Population outlook (Jefferson County) Hauer SSP2
- Today (2025)
- 42,134 people
- By 2030
- 40,512 · -3.8%
- By 2040
- 36,747 · -12.8%
- By 2050
- 32,755 · -22.3%
- By 2075
- 24,402 · -42.1%
- By 2100
- 16,398 · -61.1%
Race, ethnicity, and origin ACS 2023
- Neighborhood character
- Predominantly White (97%)
- Race & ethnicity
- White 97% Two or more races 1%
- Common ancestry
- Romanian 6% Serbian 2% Italian 2%
- Languages at home
- 97% English-only · German/W. Germanic 3%
Political lean MEDSL · Jefferson
- 2024 margin
- Solid R (+58.5) · D 20.4% · R 78.8%
- 2008→2024 swing
- -28.7pp toward R · 2008: -29.8pp · 2024: -58.5pp
- All cycles
- 2024: R+58.5 2020: R+58.9 2016: R+59.8 2012: R+45.4 2008: R+29.8
Not yet ingested
- Civics
- —
Market trends
- HPI YoY
- ▲ 0.75%
- Current HPI
- 187.4562
- Rent YoY
- —
- Metro
- —
- State GDP YoY
- ▲ 1.68%
- F500 in state
- 34
Industry mix (Fortune 500 HQ in PA)
| Industry | F500 HQs | Revenue |
|---|---|---|
| Healthcare | 2 | $309B |
|
||
| Insurance | 2 | $27B |
|
||
| Telecommunications / Media | 1 | $124B |
|
||
| Industrial Distribution | 1 | $22B |
|
||
| Financial Services | 1 | $20B |
|
||
| Chemicals / Materials | 1 | $18B |
|
||
Price history
+75.6% since first listed2 events — show timeline
- 2026-05-12 Listed $59,700 FSBO.com
- 2006-08-25 Sold (Public Records) $34,000 Public Records
Property tax history
+2.1%/yrLatest (2026): $1,217 · +2.7% YoY. Source: county tax records.
Cash-flow waterfall
monthlySold comps — $/sqft
last 12 mo · ≤1 miLoading sold comps…