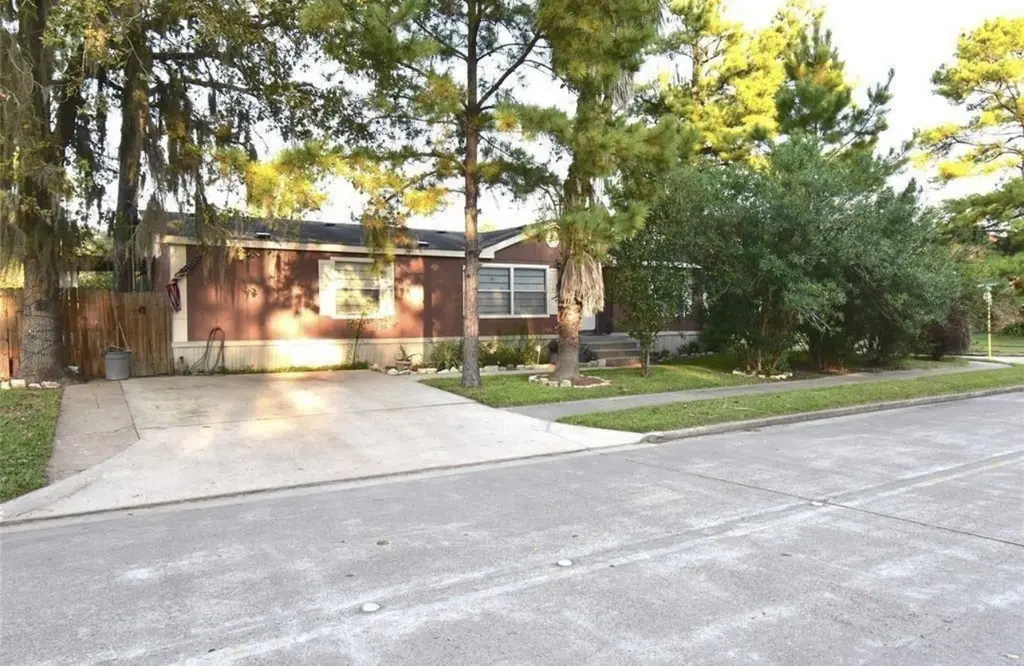
11703 Greenmesa Dr · Houston, TX
Flood risk 5/10 · Moderate
- FEMA flood zone
- X (shaded)
- Chance of flooding over 30 yrs
- 0.24%
- Est. flood insurance / yr
- $507 – $1,088
Fire risk 5/10 · Moderate
- Est. fire insurance / yr
- $1,222 – $2,270
Heat risk 9/10 · Severe
- Hot days now (above 110°F)
- 7 days/yr
- Hot days in 30 yrs
- 25 days/yr
Wind risk 9/10 · Severe
- Chance of severe wind over 30 yrs
- 99.0%
Air-quality risk 3/10 · Minor
- Unhealthy air days now
- 2 days/yr
- Unhealthy air days in 30 yrs
- 3 days/yr
Risk factors via First Street. Map © Google.
Why this score? — see what drove the B+ grade
The composite is a weighted blend of 9 inputs, each scored 0–100. Each bar is that input's sub-score; the figure is the points it added to the 100-point composite (weight × sub-score).
- Cash flow +30.0/30.0
- ARV discount +10.6/15.0
- DSCR +10.0/10.0
- 1% rule +9.8/10.0
- Appreciation +4.2/10.0
- Livability +3.7/5.0
- Rent growth +2.7/5.0
- Condition / age +2.5/5.0
- Schools +2.0/10.0
$149,000
🖨 Deal sheet (PDF) 📄 Offer letter ✓ Due diligence
Listing remarks MLS
Beautiful 4 Bedroom property close nearby freeways with plenty of upgrades and nestled in a great community. Open floor plan, upgraded flooring, nice back patio & backyard. Great location. Unit available 02/22/2023
Key facts
- Upgraded flooring
- Open floorplan
- Back patio
Tags
Property features AI
Finance
- Financial info: Leases considered
Exterior
- Security: Security gate
- Utilities: Public water; Public sewer
- Home design: Residential property; Built in 2000
- Construction: Aluminum siding, brick, and wood siding construction; Metal roof
- Exterior features: Corner lot; Security gate
Interior
- Bedrooms: Primary bedroom on the first floor (13 x 13); Bedroom on the first floor (13 x 11); Bedroom on the first floor (12 x 9); Bedroom on the first floor (10 x 9)
- Bathrooms: 2 full bathrooms
- Heating & cooling: Central heating (electric); Central air conditioning (electric)
- Interior features: Total of 4 rooms
Neighborhood map
What this means for you Summary
Snapshot
- This is a 4-bed/2.0-bath manufactured listed at $149k.
Deal economics
- At list price, monthly cash flow is $718 ($9k/yr) — positive.
- The deal already cash-flows at list — no discount required.
- Meets the 1% rule at list price ($2k rent vs $149k).
- Cap rate 12.1% vs local median 3.2% in Houston — top-decile yield for the area; either an underpriced asset or a hidden risk that comps aren't pricing in. Stress-test before assuming the spread holds.
Location & tenants
- Location reads 74/100 on livability (#184 in TX, #4,771 nationally) — a middle-class / working-renter tenant base. Strengths: amenities A+, cost of living A+, housing A+; Watch: crime F.
- Sheldon ISD (suburban): math 19% / reading 25% proficiency, ranked #746 of 826 in TX (top 90%) — low school quality limits family demand, transient renter base, plan for 1-2y turnover; 72% free/reduced lunch — lower-income household profile, screen leases tightly.
- Zoned schools: Garrett El (math 17% / reading 19%, grade F, #3,785 of 4,322 statewide, top 88%, 672 students, 92% FRL); Michael R Null Middle (math 15% / reading 23%, grade F, #1,466 of 1,662 statewide, top 89%, 1,164 students, 89% FRL); C E King H S (math 19% / reading 30%, grade F, #1,264 of 1,632 statewide, top 82%, 3,473 students, 82% FRL) — zoned schools average 87% FRL vs 72% district-wide (16 pts higher); higher-poverty schools than district average — tighter screening recommended.
- Market conditions: Rents flat; 340 active listings in the ZIP; 2 comparable units currently listed for rent nearby; solid renter incomes; 29,883 units permitted in Harris County in 2024 (8,621 in 5+ unit buildings).
Forward outlook
- Local home prices are declining (-1.6%/yr); year-one equity from $1k of loan paydown is wiped out by about $2k of value loss. Plan a longer hold.
- Harris County population projected at +47% by 2050 — long-run rental-demand tailwind backs the buy-and-hold thesis.
- At projected returns (-1.6% appreciation + 0.9% rent growth), your $42k cash investment doubles in ~6 years — after that, you're playing with house money.
Negotiation context
- Only 2 days on market — expect competitive offers; lowballing is unlikely to land.
- 14 sale attempts since 15y ago; this cycle's ask is 8930% above the opening price — seller raised mid-cycle; expect resistance to lowballs.
Risks & watch-outs
- Climate carrying-cost: moderate flood risk; severe wind risk, 99% chance of damaging wind over 30y; moderate wildfire risk; extreme-heat days projected 7→25/yr by 2055 (HVAC capex compounding) — expect insurance premiums to compound above CPI over the hold.
Questions for the listing agent
- Is there a deadline driving the sale (1031 exchange, divorce, estate, relocation)? That informs how much negotiation room exists.
- Schools are D-rated, which usually means shorter tenancies and higher turnover. Who's the typical renter profile here, and what's been the actual vacancy rate?
- Crime grade is F in this area — have there been break-ins, vandalism, or insurance claims at this property in the last 3 years? What carrier currently insures it and at what premium?
- What's the average days-on-market for RENTAL listings here right now (not sales)? A rising rental-DOM trend means longer vacancies and softer asking-rent achievability than the comps imply.
- What's the recent tenant-quality profile in this submarket — average credit score on applications, eviction rate, late-payment / NSF rate, and stable-employment percentage? A property-management company in the area should have these aggregated.
- How much new for-sale + rental construction is in the pipeline within 1–3 miles? Heavy new supply typically softens prices + rents 12–24 months out; constrained supply supports both.
Investment metrics
- 1% rule
- 1.48% ✓
- Cap rate
- 12.08%
- Cash-on-cash
- 20.65%
- DSCR
- 1.92
- GRM
- 5.6
CMA / ARV
- ARV (median comp)
- $159,978
- List price
- $149,000
- Delta
- 6.26%
- Verdict
- FAIR
- Comps
- 1 within 2.0 mi
Projected returns pro-forma
-1.59% appreciation · 0.92% rent growth · sell at horizon
- IRR
- 14.6%
- Equity multiple
- 1.63×
- Total profit
- $26,120
- Equity at exit
- $31,822
- IRR
- 19.7%
- Equity multiple
- 2.73×
- Total profit
- $72,180
- Equity at exit
- $29,999
Cash invested: $41,720 (down + closing). Projections, not guarantees.
Landlord ↔ Tenant lean methodology
- Overall (STATE)
- 87 Strongly Landlord-Friendly
- State Texas
- 87 Strongly Landlord-Friendly · R+5
- County
- — inherits STATE
- City
- — inherits STATE
ZIP-level market 77044
- Home prices YoY
- -0.7%
- Rents YoY
- 0.9%
- Active inventory
- 340
- Price-to-rent
- 5.6×
Monthly cashflow live
- Estimated rent
- $2,205 medium interval (Pro) →
- Mortgage (P&I)
- −$781
- Tax from tax record
- −$181 /mo · $2,167/yr
- Insurance
- −$62
- HOA
- −$0
- Vacancy / Maint / Mgmt
- −$463
- Net cashflow
- $718
Break-even live
Sensitivity live
| Price | -10% $802 | -5% $760 | +0% $718 | +5% $676 | +10% $634 |
|---|---|---|---|---|---|
| Rent | -10% $544 | -5% $631 | +0% $718 | +5% $805 | +10% $892 |
| Rate | -1.0pp $793 | -0.5pp $756 | base $718 | +0.5pp $679 | +1.0pp $640 |
UW: 25.0% down · 7.5% · 30yr · 1.5% tax · 5.0% vac · 8.0% maint · 8.0% mgmt
Financing live
Cash to close
- Down payment
- $37,250
- Closing costs
- $4,470
- Reserves months
- —
- Total cash needed
- —
Loan-product check · same deal, 3 products live
Conventional
25% down · 7.5% · 30yr
- Down + closing
- —
- Monthly P&I
- —
- Monthly cashflow
- —
- DSCR
- —
- Eligible?
- —
Personal DTI + credit; lowest rate.
DSCR
20% down · 8.5% · 30yr
- Down + closing
- —
- Monthly P&I
- —
- Monthly cashflow
- —
- DSCR
- —
- Eligible?
- —
No personal income docs; deal must DSCR.
Hard money
10% down · 12.0% · 12mo
- Down + closing
- —
- Monthly P&I
- —
- Monthly cashflow
- —
- DSCR
- —
- Eligible?
- —
Short-term bridge; refi at stabilization.
Rent comps 2 comps
| Address | Beds | Baths | Sqft | Rent | $/sqft | DOM | Units | Dist |
|---|---|---|---|---|---|---|---|---|
| 11711 Greenglen Dr Houston, TX | 3.0 | 2.0 | 1080 | $1,603 | $1.48 | 3d | 1 | 0.05mi |
| 11950 Greensbrook Forest Dr Houston, TX | 3.0 | 2.0 | 1080 | $1,500 | $1.39 | 20d | 1 | 0.27mi |
Listing history 39 events
-
2026-06-07pricedays on market $149,000 Active 2 DOM
-
2026-06-04days on market $169,999 Active 128 DOM
-
2026-06-03days on market $169,999 Active 127 DOM
-
2026-06-02days on market $169,999 Active 126 DOM
-
2026-06-01days on market $169,999 Active 125 DOM
-
2026-05-31days on market $169,999 Active 124 DOM
-
2026-05-12$1,650
-
2026-05-11historical $1,700
-
2026-03-03$1,700
-
2026-03-03historical $1,850
-
2026-01-29soldstatus
-
2026-01-28$1,850
-
2026-01-27$169,999 Active 217-char remark
-
2023-03-22soldstatus
-
2023-03-20soldstatus Sold 220-char remark
Show marketing remark (220 chars)
Beautiful 4 Bedroom property close nearby freeways with plenty of upgrades and nestled in a great community. Open floor plan, upgraded flooring, nice back patio & backyard. Great location. Unit available 02/22/2023
-
2023-03-17status Pending 220-char remark
Show marketing remark (220 chars)
Beautiful 4 Bedroom property close nearby freeways with plenty of upgrades and nestled in a great community. Open floor plan, upgraded flooring, nice back patio & backyard. Great location. Unit available 02/22/2023
-
2023-03-15status Active 220-char remark
Show marketing remark (220 chars)
Beautiful 4 Bedroom property close nearby freeways with plenty of upgrades and nestled in a great community. Open floor plan, upgraded flooring, nice back patio & backyard. Great location. Unit available 02/22/2023
-
2023-03-03status Pending 220-char remark
Show marketing remark (220 chars)
Beautiful 4 Bedroom property close nearby freeways with plenty of upgrades and nestled in a great community. Open floor plan, upgraded flooring, nice back patio & backyard. Great location. Unit available 02/22/2023
-
2023-02-24status Option Pending 220-char remark
Show marketing remark (220 chars)
Beautiful 4 Bedroom property close nearby freeways with plenty of upgrades and nestled in a great community. Open floor plan, upgraded flooring, nice back patio & backyard. Great location. Unit available 02/22/2023
-
2023-02-18$160,000 Active 220-char remark
Show marketing remark (220 chars)
Beautiful 4 Bedroom property close nearby freeways with plenty of upgrades and nestled in a great community. Open floor plan, upgraded flooring, nice back patio & backyard. Great location. Unit available 02/22/2023
-
2021-12-21soldstatus Sold
-
2021-12-21soldstatus
-
2021-11-28status Pending
-
2021-11-20status Option Pending
-
2021-11-01status Active
-
2021-10-28status Option Pending
-
2021-10-26$139,900 Active
-
2021-09-20historical
-
2021-06-07status Active
-
2021-06-02status Option Pending
-
2020-11-29status Active
-
2020-11-14status Pending
-
2020-11-02status Option Pending
-
2020-10-04$139,900 Active
-
2012-04-27soldstatus
-
2012-01-13soldstatus
-
2011-12-31historical
-
2011-11-15$30,000
-
1999-11-22soldstatus
ⓘ Source: listings_history table (triggers on properties + properties_extension) + one-shot
backfill from property_details.listing_events for pre-trigger history.
Tax reassessment forecast TX · Resets to sale price
- Current annual tax
- $2,167 · $181/mo
- Projected year-2 tax
- $2,727 · $227/mo
- Expected delta
- +$560/yr (+$47/mo · 25.8%)
ⓘ Screening estimate from a state-policy table — verify with the county assessor before closing.
Climate risk First Street
- Flood 5/10 Major FEMA zone X (shaded) · 24% chance over 30 yrs
- Wildfire 5/10 Major
- Heat 9/10 Extreme 7 d/yr ≥110°F today · 25 d/yr by 30 yrs out
- Wind 9/10 Extreme 99% chance of damaging wind over 30 yrs
- Air quality 3/10 Moderate 2 unhealthy d/yr today · 3 by 30 yrs out
Nearby sold comps map
Loading sold comps map…
Walkable amenities ~0.75 mi
Loading nearby amenities…
Taxation est. · year 1
- Rental income
- $26,460
- − Mortgage interest
- −$8,346
- − Property taxes
- −$2,167
- − Insurance
- −$745
- − Repairs & maintenance
- −$2,117
- − Management
- −$2,117
- − Depreciation
- −$4,335
- Taxable income
- $6,634
- Est. tax owed @ 24.0%
- −$1,592
- After-tax cash flow
- $7,023/yr
For passive investors: Depreciation is non-cash, so a rental often shows a tax loss while cash-flowing — sheltering income. Rental losses are passive: they offset passive income freely, and up to $25,000/yr can offset ordinary (W-2) income if you actively participate and your MAGI is under $100k (phasing out to $0 by $150k); unused losses carry forward. On sale, claimed depreciation is recaptured at up to 25%, and gains may owe capital-gains tax (a 1031 exchange can defer both). Figures are a year-1 estimate at your 24.0% rate — not tax advice; consult a CPA.
Schools (NCES district)
- District
- Sheldon ISD
- NCES district ID
- 4839990
- Math proficiency
- 19% ▼ -18.00%
- Reading proficiency
- 25% ▼ -10.00%
- Median HH income
- $49,443
- Composite
- 19.5/100
- National rank
- #8772
- State rank
- #746 of 826 in TX
Livability — Houston
- Score
- 74/100
- State rank
- #184
- US rank
- #4771
Category grades
Schools grade is shown separately in the Schools card above.
Census & demographics
- County
- Harris County · 4,702,590 people
- City population
- 3,226,434
- Metro
- Houston-The Woodlands-Sugar Land, TX
- Population (ZIP)
- 58,347
- Household income
- $95,000
- Rent vs Own
- Severe rent burden
- 1332.0
Population outlook (Harris County) Hauer SSP2
- Today (2025)
- 5,571,493 people
- By 2030
- 6,089,821 · +9.3%
- By 2040
- 7,142,806 · +28.2%
- By 2050
- 8,185,864 · +46.9%
- By 2075
- 10,574,329 · +89.8%
- By 2100
- 12,109,958 · +117.4%
Race, ethnicity, and origin ACS 2023
- Neighborhood character
- Diverse neighborhood (Simpson 0.66)
- Race & ethnicity
- Hispanic / Latino 44% Black 32% White 19% Two or more races 18% Native American 2% Asian 1%
- Hispanic origin (detail)
- Mexican 36%
- Common ancestry
- Lithuanian 1% Romanian 1% Iranian 1%
- Foreign-born
- 18% · Canada
- Languages at home
- 61% English-only · Spanish 35% French/Haitian/Cajun 1% Other Indo-European 1%
Political lean MEDSL · Harris
- 2024 margin
- Lean D (+5.5) · D 52.0% · R 46.4% · Other 1.6%
- 2008→2024 swing
- +3.9pp toward D · 2008: 1.6pp · 2024: 5.5pp
- All cycles
- 2024: D+5.5 2020: D+13.3 2016: D+12.4 2012: D+0.1 2008: D+1.6
Not yet ingested
- Civics
- —
Market trends
- HPI YoY
- ▼ -1.59%
- Current HPI
- 215.5736
- Rent YoY
- ▲ 0.92%
- Metro
- Houston-The Woodlands-Sugar Land, TX
- State GDP YoY
- ▲ 3.95%
- F500 in state
- 110
Industry mix (Fortune 500 HQ in TX)
| Industry | F500 HQs | Revenue |
|---|---|---|
| Energy | 16 | $1,198B |
|
||
| Technology | 5 | $198B |
|
||
| Engineering / Construction | 4 | $72B |
|
||
| Energy Services | 3 | $60B |
|
||
| Utilities | 3 | $41B |
|
||
| Healthcare | 2 | $330B |
|
||
Price history
-94.5% since first listed39 events — show timeline
- 2026-06-08 Rental Removed $1,650 HARMLS
- 2026-06-08 Listing Removed — HARMLS
- 2026-06-06 Listed for Rent $1,650 HARMLS
- 2026-06-05 Rental Removed $1,650 HARMLS
- 2026-06-05 Listing Removed — HARMLS
- 2026-06-05 Listed $149,000 HARMLS
- 2026-05-12 Listed for Rent $1,650 HARMLS
- 2026-05-11 Rental Removed $1,700 HARMLS
- 2026-03-03 Listed for Rent $1,700 HARMLS
- 2026-03-03 Rental Removed $1,850 HARMLS
- 2026-01-29 Sold (Public Records) — Public Records
- 2026-01-28 Listed for Rent $1,850 HARMLS
- 2026-01-27 Listed $169,999 HARMLS
- 2023-03-22 Sold (Public Records) — Public Records
- 2023-03-20 Sold (MLS) — HARMLS
- 2023-03-17 Pending — HARMLS
- 2023-03-15 Relisted — HARMLS
- 2023-03-03 Pending — HARMLS
- 2023-02-24 Pending — HARMLS
- 2023-02-18 Listed $160,000 HARMLS
- 2021-12-21 Sold (Public Records) — Public Records
- 2021-12-21 Sold (MLS) — HARMLS
- 2021-11-28 Pending — HARMLS
- 2021-11-20 Pending — HARMLS
- 2021-11-01 Relisted — HARMLS
- 2021-10-28 Pending — HARMLS
- 2021-10-26 Listed $139,900 HARMLS
- 2021-09-20 Listing Removed — HARMLS
- 2021-06-07 Relisted — HARMLS
- 2021-06-02 Pending — HARMLS
- 2020-11-29 Relisted — HARMLS
- 2020-11-14 Pending — HARMLS
- 2020-11-02 Pending — HARMLS
- 2020-10-04 Listed $139,900 HARMLS
- 2012-04-27 Sold (Public Records) — Public Records
- 2012-01-13 Sold (MLS) — HARMLS
- 2011-12-31 Listing Removed — HARMLS
- 2011-11-15 Listed $30,000 HARMLS
- 1999-11-22 Sold (Public Records) — Public Records
Property tax history
+4.0%/yrLatest (2025): $2,167 · -2.0% YoY. Source: county tax records.
Cash-flow waterfall
monthlySold comps — $/sqft
last 12 mo · ≤1 miLoading sold comps…