209 Stonebridge Cv · Madisonville, LA
Flood risk 1/10 · Minimal
- FEMA flood zone
- X
- Chance of flooding over 30 yrs
- 0.0%
- Est. flood insurance / yr
- $507 – $1,088
Fire risk 4/10 · Minor
- Est. fire insurance / yr
- $1,269 – $2,357
Heat risk 9/10 · Severe
- Hot days now (above 109°F)
- 7 days/yr
- Hot days in 30 yrs
- 21 days/yr
Wind risk 9/10 · Severe
- Chance of severe wind over 30 yrs
- 99.0%
Air-quality risk 2/10 · Minimal
- Unhealthy air days now
- 0 days/yr
- Unhealthy air days in 30 yrs
- 1 days/yr
Risk factors via First Street. Map © Google.
Why this score? — see what drove the C- grade
The composite is a weighted blend of 9 inputs, each scored 0–100. Each bar is that input's sub-score; the figure is the points it added to the 100-point composite (weight × sub-score).
- Cash flow +16.2/30.0
- ARV discount +14.2/15.0
- DSCR +5.0/10.0
- Schools +4.3/10.0
- Livability +4.0/5.0
- 1% rule +3.7/10.0
- Rent growth +2.5/5.0
- Condition / age +2.5/5.0
- Appreciation +0.0/10.0
$283,000
🖨 Deal sheet 📄 Offer letter ✓ Due diligence
Listing remarks MLS
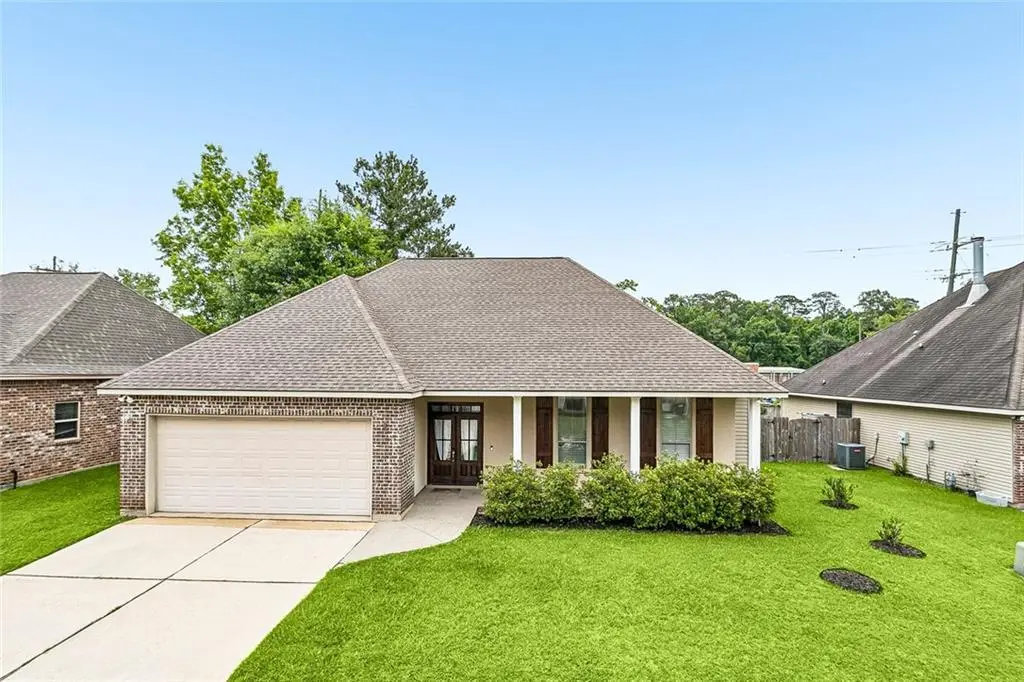
Charming 3-bedroom, 2-bathroom home located in a desirable neighborhood in Madisonville. This inviting property offers a comfortable layout, a spacious two-car garage, and a fenced-in backyard perfect for relaxing or entertaining. Conveniently situated near shopping, restaurants, everyday amenities, and the Madisonville schools, this home also offers easy access to I-12 and is just a short drive to Covington and Mandeville, making commuting and travel a breeze while still enjoying the charm and convenience of this sought-after community.
Key facts
- Easy access to i-12
- Fenced-in backyard
- 5,235 sq ft lot
Tags
Property features AI
Finance
- HOA & community: Homeowners association with an annual fee of $350
Exterior
- Parking: Garage with two spaces and garage door opener
- Security: Smoke detector(s); Carbon monoxide detector
- Utilities: Public water; Public sewer; Central heating; Central air conditioning
- Home design: Single-story home; Brick and vinyl siding exterior; Asphalt roof; Slab foundation; Very good condition; Rectangular city lot (approx. 70 x 72)
- Construction: Built with brick and vinyl siding; Asphalt roof; Slab foundation
- Exterior features: Fenced yard; Porch
Interior
- Kitchen: Dishwasher; Disposal; Microwave; Oven; Range; Refrigerator; Granite counters; Pantry; Stainless steel appliances
- Bedrooms: Total rooms: 7
- Bathrooms: 2 full bathrooms
- Interior features: Attic access with pull-down stairs; Carbon monoxide detector; Granite countertops; Pantry; Stainless steel appliances; Smoke detectors
- Laundry & utility: Washer; Dryer
Neighborhood map
What this means for you Summary
Snapshot
- This is a 3-bed/2.0-bath single-family listed at $283k.
Deal economics
- At list price, monthly cash flow is $152 ($2k/yr) — positive.
- The deal already cash-flows at list — no discount required.
- To meet the 1% rule (rent ≥ 1% of price), the offer needs to be $246k (12.9% below list).
- Recommended offer: $246k (12.9% below list) — sets the bar for 1% rule.
- Cap rate 6.9% vs local median 4.6% in Madisonville — top-decile yield for the area; either an underpriced asset or a hidden risk that comps aren't pricing in. Stress-test before assuming the spread holds.
Location & tenants
- Location reads 79/100 on livability (#5 in LA, #2,302 nationally) — a middle-class / working-renter tenant base. Strengths: schools A+, crime A+, employment A+; Watch: amenities F, commute F.
- St. Tammany Parish (suburban): math 43% / reading 55% proficiency, ranked #11 of 98 in LA (top 11%) — families likely to look elsewhere, expect single-tenant / working-renter base with shorter leases.
- Market conditions: 252 active listings in the ZIP; 8 comparable units currently listed for rent nearby; rentals lingering (median 44d on market — plan ~5-8 weeks vacancy on turnover, expect pricing pressure); 50% of comp listings sitting > 30 days — soft ceiling on asking rent; high-income renter base; 1,064 units permitted in St. Tammany Parish in 2024 (0 in 5+ unit buildings).
Forward outlook
- Local home prices are declining (-3.0%/yr); year-one equity from $2k of loan paydown is wiped out by about $8k of value loss. Plan a longer hold.
- St. Tammany County population projected at +27% by 2050 — long-run rental-demand tailwind backs the buy-and-hold thesis.
Negotiation context
- It's been on market 40 days — a 3% lower offer ($275k) is reasonable based on typical stale-listing flexibility.
- 24 sale attempts since 19y ago with the ask held roughly flat each time — persistent listings suggest the price (not the market) is what's stuck; bring a comps-based counter.
Risks & watch-outs
- Climate carrying-cost: severe wind risk, 99% chance of damaging wind over 30y; extreme-heat days projected 7→21/yr by 2055 (HVAC capex compounding) — expect insurance premiums to compound above CPI over the hold.
Questions for the listing agent
- It's been on market 40 days. Have you received any prior offers? Is the seller open to a 13% concession, seller financing, or rate buy-down credit?
- What does the HOA fee cover, when was the last increase, and are there any pending special assessments or reserve-fund shortfalls?
- Is there a deadline driving the sale (1031 exchange, divorce, estate, relocation)? That informs how much negotiation room exists.
- Schools are A-rated — typically a magnet for longer-tenancy family renters. What's the average tenant stay here, and is there a school-zone premium baked into asking?
- What's the average days-on-market for RENTAL listings here right now (not sales)? A rising rental-DOM trend means longer vacancies and softer asking-rent achievability than the comps imply.
- What's the recent tenant-quality profile in this submarket — average credit score on applications, eviction rate, late-payment / NSF rate, and stable-employment percentage? A property-management company in the area should have these aggregated.
- How much new for-sale + rental construction is in the pipeline within 1–3 miles? Heavy new supply typically softens prices + rents 12–24 months out; constrained supply supports both.
Investment metrics
- 1% rule
- 0.87% ✗
- Cap rate
- 6.94%
- Cash-on-cash
- 2.30%
- DSCR
- 1.10
- GRM
- 9.6
CMA / ARV
- ARV (median comp)
- $332,699
- List price
- $283,000
- Delta
- -14.94%
- Verdict
- UNDERPRICED
- Comps
- 20 within 1.0 mi
Show comp detail 9 sales within ~0.75 mi
| Address | Dist | Beds/Ba | Sqft | Sold | Price | $/sf | Match |
|---|---|---|---|---|---|---|---|
| 317 Chicot Ln | 0.31mi | 3/2.0 | 1,830 (+6%) | 14mo | $325,000 | $178 | 64 |
| 217 Coushatta Cir | 0.39mi | 3/2.0 | 1,489 (-14%) | 0mo | $246,000 | $165 | 59 |
| 2034 White Myrtle Dr | 0.54mi | 3/2.0 | 1,821 (+6%) | 14mo | $307,000 | $169 | 53 |
| 233 Coushatta Cir | 0.39mi | 3/2.0 | 1,500 (-13%) | 11mo | $285,000 | $190 | 51 |
| 109 Coushatta Cir | 0.37mi | 4/2.5 (+1) | 1,950 (+13%) | 9mo | $318,000 | $163 | 46 |
| 4012 Willow Ln | 0.48mi | 4/2.5 (+1) | 1,884 (+9%) | 12mo | $335,000 | $178 | 45 |
| 159 White Heron Dr | 0.53mi | 2/2.5 (-1) | 1,653 (-4%) | 24mo | $225,000 | $136 | 41 |
| 420 Claymont Ct | 0.71mi | 3/2.0 | 1,956 (+14%) | 23mo | $435,000 | $222 | 26 |
| 408 Claymont Ct | 0.74mi | 3/2.0 | 1,949 (+13%) | 23mo | $420,000 | $215 | 25 |
Match score weights: distance 35% · size 25% · config 20% · recency 20%. Top-matched comps best support the ARV.
Projected returns pro-forma
-3.0% appreciation · 3.0% rent growth · sell at horizon
- IRR
- -12.7%
- Equity multiple
- 0.54×
- Total profit
- $-36,267
- Equity at exit
- $42,196
- IRR
- -3.7%
- Equity multiple
- 0.76×
- Total profit
- $-19,402
- Equity at exit
- $24,469
Cash invested: $79,240 (down + closing). Projections, not guarantees.
Landlord ↔ Tenant lean methodology
- Overall (STATE)
- 90 Strongly Landlord-Friendly
- State Louisiana
- 90 Strongly Landlord-Friendly · R+12
- County
- — inherits STATE
- City
- — inherits STATE
ZIP-level market 70447
- Home prices YoY
- -28.1%
- Active inventory
- 252
- Price-to-rent
- 9.6×
Monthly cashflow live
- Estimated rent
- $2,464 high interval (Pro) →
- Mortgage (P&I)
- −$1,484
- Tax from tax record
- −$164 /mo · $1,968/yr
- Insurance
- −$118
- HOA
- −$29
- Vacancy / Maint / Mgmt
- −$517
- Net cashflow
- $152
Break-even live
UW: 25.0% down · 7.5% · 30yr · 1.5% tax · 5.0% vac · 8.0% maint · 8.0% mgmt
Financing live
Cash to close
- Down payment
- $70,750
- Closing costs
- $8,490
- Reserves months
- —
- Total cash needed
- —
Loan-product check · same deal, 3 products live
Conventional
25% down · 7.5% · 30yr
- Down + closing
- —
- Monthly P&I
- —
- Monthly cashflow
- —
- DSCR
- —
- Eligible?
- —
Personal DTI + credit; lowest rate.
DSCR
20% down · 8.5% · 30yr
- Down + closing
- —
- Monthly P&I
- —
- Monthly cashflow
- —
- DSCR
- —
- Eligible?
- —
No personal income docs; deal must DSCR.
Hard money
10% down · 12.0% · 12mo
- Down + closing
- —
- Monthly P&I
- —
- Monthly cashflow
- —
- DSCR
- —
- Eligible?
- —
Short-term bridge; refi at stabilization.
Rent comps 8 comps
| Address | Beds | Baths | Sqft | Rent | $/sqft | DOM | Units | Dist |
|---|---|---|---|---|---|---|---|---|
| 2050 White Myrtle Dr Madisonville, LA | 4.0 | 2.0 | 2061 | $2,400 | $1.16 | 17d | 1 | 0.57mi |
| 103 Woods Dr Madisonville, LA | 3.0 | 2.0 | 2009 | $2,400 | $1.19 | 43d | 1 | 0.90mi |
| 102 Woods Dr Madisonville, LA | 3.0 | 2.0 | 1400 | $2,000 | $1.43 | 23d | 1 | 0.93mi |
| 519 Garden Ln Madisonville, LA | 4.0 | 2.0 | 2062 | $2,650 | $1.29 | 43d | 1 | 1.07mi |
| 42 Deforest Dr Madisonville, LA | 3.0 | 2.0 | 1670 | $2,400 | $1.44 | 23d | 1 | 1.29mi |
| 31 Wickfield Dr Covington, LA | 4.0 | 2.0 | 1615 | $1,900 | $1.18 | 43d | 1 | 1.31mi |
| 409 Gainesway Dr Madisonville, LA | 3.0 | 2.0 | 1695 | $2,300 | $1.36 | 43d | 1 | 1.44mi |
| 138 Poe St Madisonville, LA | 3.0 | 2.0 | 1109 | $1,700 | $1.53 | 23d | 1 | 1.48mi |
HOA detail
- Monthly dues
- $29 · $348/yr
Listing history 50 events
-
2026-06-18days on market $283,000 Active 40 DOM
-
2026-06-17days on market $283,000 Active 39 DOM
-
2026-06-16days on market $283,000 Active 38 DOM
-
2026-06-15days on market $283,000 Active 37 DOM
-
2026-06-13days on market $283,000 Active 35 DOM
-
2026-06-10days on market $283,000 Active 32 DOM
-
2026-06-09days on market $283,000 Active 31 DOM
-
2026-06-08days on market $283,000 Active 30 DOM
-
2026-06-07days on market $283,000 Active 29 DOM
-
2026-06-03days on market $283,000 Active 25 DOM
-
2026-06-02days on market $283,000 Active 24 DOM
-
2026-06-01days on market $283,000 Active 23 DOM
-
2026-05-31days on market $283,000 Active 22 DOM
-
2026-05-09$290,000 Active 543-char remark
Show marketing remark (543 chars)
Charming 3-bedroom, 2-bathroom home located in a desirable neighborhood in Madisonville. This inviting property offers a comfortable layout, a spacious two-car garage, and a fenced-in backyard perfect for relaxing or entertaining. Conveniently situated near shopping, restaurants, everyday amenities, and the Madisonville schools, this home also offers easy access to I-12 and is just a short drive to Covington and Mandeville, making commuting and travel a breeze while still enjoying the charm and convenience of this sought-after community.
-
2023-04-05soldstatus $270,000 Closed
-
2023-04-05soldstatus $270,000
-
2023-03-11historical Active Under Contract
-
2023-02-28$275,000
-
2023-02-28$275,000 Active
-
2021-06-04soldstatus $240,000
-
2021-02-12price $225,000
-
2021-01-26$225,000
-
2019-07-30price $190,000
-
2019-06-24price $195,000
-
2019-06-10price $199,900
-
2019-06-03price $204,900
-
2019-05-23price $205,000
-
2019-05-21price $215,000
-
2019-05-12price $218,500
-
2019-05-04$190,000
-
2019-02-21price $220,000
-
2019-02-07price $224,500
-
2018-12-18$220,000
-
2015-04-10soldstatus
-
2015-02-03$1,700
-
2014-12-01$182,500
-
2014-12-01$182,500
-
2014-12-01$182,500
-
2014-12-01$182,500
-
2014-10-01$195,000
-
2014-10-01$195,000
-
2013-07-02$199,900
-
2013-07-02$199,900
-
2012-01-30soldstatus $176,500
-
2011-05-10$177,000
-
2011-05-10$177,000
-
2011-01-19soldstatus $250,334
-
2009-01-09$219,900
-
2009-01-09$219,900
ⓘ Source: listings_history table (triggers on properties + properties_extension) + one-shot
backfill from property_details.listing_events for pre-trigger history.
Tax reassessment forecast LA · Resets to sale price
- Current annual tax
- $1,968 · $164/mo
- Projected year-2 tax
- $1,968 · $164/mo
- Expected delta
- $0/yr ($0/mo · 0.0%)
ⓘ Screening estimate from a state-policy table — verify with the county assessor before closing.
Climate risk First Street
- Flood 1/10 Low FEMA zone X · 0% chance over 30 yrs
- Wildfire 4/10 Moderate
- Heat 9/10 Extreme 7 d/yr ≥109°F today · 21 d/yr by 30 yrs out
- Wind 9/10 Extreme 99% chance of damaging wind over 30 yrs
- Air quality 2/10 Low 0 unhealthy d/yr today · 1 by 30 yrs out
Nearby sold comps map
Loading sold comps map…
Walkable amenities ~0.75 mi
Loading nearby amenities…
Taxation est. · year 1
- Rental income
- $29,567
- − Mortgage interest
- −$15,852
- − Property taxes
- −$1,968
- − Insurance
- −$1,415
- − Repairs & maintenance
- −$2,365
- − Management
- −$2,365
- − HOA
- −$348
- − Depreciation
- −$8,233
- Taxable loss
- −$2,979
- Est. tax savings @ 24.0%
- +$715
- After-tax cash flow
- $2,534/yr
For passive investors: Depreciation is non-cash, so a rental often shows a tax loss while cash-flowing — sheltering income. Rental losses are passive: they offset passive income freely, and up to $25,000/yr can offset ordinary (W-2) income if you actively participate and your MAGI is under $100k (phasing out to $0 by $150k); unused losses carry forward. On sale, claimed depreciation is recaptured at up to 25%, and gains may owe capital-gains tax (a 1031 exchange can defer both). Figures are a year-1 estimate at your 24.0% rate — not tax advice; consult a CPA.
Schools (NCES district)
- District
- St. Tammany Parish
- NCES district ID
- 2201650
- Math proficiency
- 43% ▼ -32.00%
- Reading proficiency
- 55% ▼ -26.00%
- Median HH income
- $61,752
- Composite
- 43.04/100
- National rank
- #3098
- State rank
- #11 of 98 in LA
Livability — Madisonville
- Score
- 79/100
- State rank
- #5
- US rank
- #2302
Category grades
Schools grade is shown separately in the Schools card above.
Census & demographics
- County
- Saint Tammany Parish · 228,296 people
- City population
- 17,897
- Metro
- New Orleans-Metairie, LA
- Population (ZIP)
- 17,897
- Household income
- $122,574
- Rent vs Own
- Severe rent burden
- 47.0
Population outlook (St. Tammany County) Hauer SSP2
- Today (2025)
- 286,725 people
- By 2030
- 304,175 · +6.1%
- By 2040
- 336,203 · +17.3%
- By 2050
- 364,590 · +27.2%
- By 2075
- 433,362 · +51.1%
- By 2100
- 470,333 · +64.0%
Race, ethnicity, and origin ACS 2023
- Neighborhood character
- Predominantly White (84%)
- Race & ethnicity
- White 84% Two or more races 7% Hispanic / Latino 6% Black 2%
- Hispanic origin (detail)
- Mexican 1%
- Common ancestry
- Lithuanian 19% Slovak 3% Romanian 2%
- Foreign-born
- 5% · Canada
- Languages at home
- 97% English-only · Spanish 1% Other Asian/Pacific 1% Russian/Polish/Slavic 1%
Political lean MEDSL · St. Tammany
- 2024 margin
- Solid R (+43.8) · D 27.3% · R 71.1% · Other 1.6%
- 2008→2024 swing
- +9.6pp toward D · 2008: -53.4pp · 2024: -43.8pp
- All cycles
- 2024: R+43.8 2020: R+44.2 2016: R+50.8 2012: R+52.2 2008: R+53.4
Not yet ingested
- Civics
- —
Market trends
- HPI YoY
- ▼ -68.07%
- Current HPI
- 174.0804
- Rent YoY
- —
- Metro
- New Orleans-Metairie, LA
- State GDP YoY
- ▲ 3.29%
- F500 in state
- 10
Industry mix (Fortune 500 HQ in LA)
| Industry | F500 HQs | Revenue |
|---|---|---|
| Telecommunications | 2 | $23B |
|
||
| Utilities | 1 | $12B |
|
||
| Wholesale / Distribution | 1 | $5B |
|
||
| Advertising | 1 | $2B |
|
||
Price history
+25.8% since first listed43 events — show timeline
- 2026-05-24 Price Changed $283,000 AcadianaMLS
- 2026-05-24 Price Changed $283,000 GSREIN
- 2026-05-09 Listed $290,000 GSREIN
- 2026-05-09 Listed $290,000 AcadianaMLS
- 2023-04-05 Sold (Public Records) $270,000 Public Records
- 2023-04-05 Sold (MLS) $270,000 GSREIN
- 2023-03-11 Contingent — GSREIN
- 2023-02-28 Listed $275,000 GSREIN
- 2023-02-28 Listed $275,000 AcadianaMLS
- 2021-06-04 Sold (Public Records) $240,000 Public Records
- 2021-02-12 Price Changed $225,000 GSREIN
- 2021-01-26 Listed $225,000 AcadianaMLS
- 2019-07-30 Price Changed $190,000 GSREIN
- 2019-06-24 Price Changed $195,000 GSREIN
- 2019-06-10 Price Changed $199,900 GSREIN
- 2019-06-03 Price Changed $204,900 GSREIN
- 2019-05-23 Price Changed $205,000 GSREIN
- 2019-05-21 Price Changed $215,000 GSREIN
- 2019-05-12 Price Changed $218,500 GSREIN
- 2019-05-04 Listed $190,000 AcadianaMLS
- 2019-02-21 Price Changed $220,000 GSREIN
- 2019-02-07 Price Changed $224,500 GSREIN
- 2018-12-18 Listed $220,000 AcadianaMLS
- 2015-04-10 Sold (MLS) — GBRMLS
- 2015-02-03 Listed $1,700 GBRMLS
- 2014-12-01 Listed $182,500 GSREIN
- 2014-12-01 Listed $182,500 AcadianaMLS
- 2014-12-01 Listed $182,500 AcadianaMLS
- 2014-12-01 Listed $182,500 GBRMLS
- 2014-10-01 Listed $195,000 GSREIN
- 2014-10-01 Listed $195,000 AcadianaMLS
- 2013-07-02 Listed $199,900 GSREIN
- 2013-07-02 Listed $199,900 AcadianaMLS
- 2012-01-30 Sold (MLS) $176,500 GSREIN
- 2011-05-10 Listed $177,000 AcadianaMLS
- 2011-05-10 Listed $177,000 GSREIN
- 2011-01-19 Sold (Public Records) $250,334 Public Records
- 2009-01-09 Listed $219,900 GSREIN
- 2009-01-09 Listed $219,900 AcadianaMLS
- 2008-06-16 Listed $219,500 GSREIN
- 2008-06-16 Listed $219,500 AcadianaMLS
- 2007-12-06 Listed $224,900 GSREIN
- 2007-12-06 Listed $224,900 AcadianaMLS
Property tax history
-2.3%/yrLatest (2025): $1,968 · -2.4% YoY. Source: county tax records.
Cash-flow waterfall
monthlySold comps — $/sqft
last 12 mo · ≤1 miLoading sold comps…