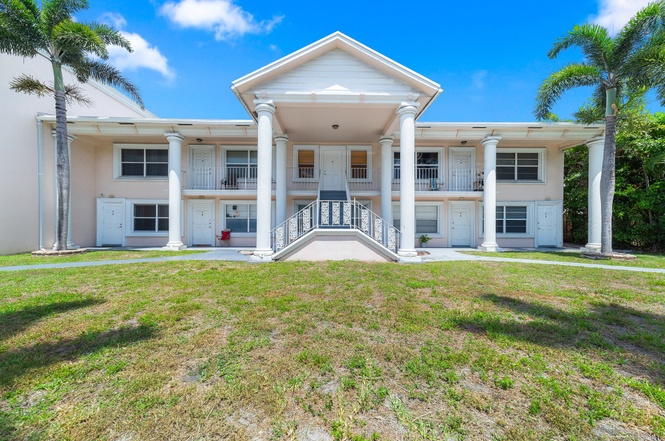
4521 NE 21st Ave #1 · Fort Lauderdale, FL
Flood risk 1/10 · Minimal
- FEMA flood zone
- X (shaded)
- Chance of flooding over 30 yrs
- 0.0%
- Est. flood insurance / yr
- $507 – $1,088
Fire risk 1/10 · Minimal
- Est. fire insurance / yr
- $947 – $1,759
Heat risk 10/10 · Severe
- Hot days now (above 105°F)
- 7 days/yr
- Hot days in 30 yrs
- 27 days/yr
Wind risk 10/10 · Severe
- Chance of severe wind over 30 yrs
- 99.0%
Air-quality risk 2/10 · Minimal
- Unhealthy air days now
- 1 days/yr
- Unhealthy air days in 30 yrs
- 2 days/yr
Risk factors via First Street. Map © Google.
Why this score? — see what drove the C+ grade
The composite is a weighted blend of 9 inputs, each scored 0–100. Each bar is that input's sub-score; the figure is the points it added to the 100-point composite (weight × sub-score).
- Cash flow +25.5/30.0
- DSCR +8.5/10.0
- 1% rule +7.6/10.0
- ARV discount +7.5/15.0
- Schools +4.1/10.0
- Livability +4.1/5.0
- Rent growth +3.4/5.0
- Condition / age +2.5/5.0
- Appreciation +0.0/10.0
$299,900
🖨 Deal sheet (PDF) 📄 Offer letter ✓ Due diligence
Listing remarks
Welcome to this charming 2-bedroom, 1.1-bath condo offering 1,080 sq. ft. of comfortable living space in a well-maintained community. Enjoy new appliances including a refrigerator, washing machine, dishwasher, and garbage disposal. The home includes two convenient parking spots—one in front and one in the rear. Relax at the community pool with BBQs, perfect for outdoor gatherings. Ideally situated just moments from the beach, restaurants, and shops, and directly across from Holy Cross Hospital. With low maintenance and strong rental potential, this property is a smart opportunity for buyers seeking value and location. Don't miss out on this coastal gem! Insurance is part of the HOA fe
Key facts
- Community pool
- New appliances
- $448 HOA
Tags
Property features AI
Finance
- Financial info: Pets allowed
- HOA & community: Monthly association fee of $448; HOA covers insurance, grounds maintenance, trash, and water; Association has no listed amenities
Exterior
- Parking: Assigned parking
- Utilities: No utilities information listed
- Home design: Condominium; Resale property; Northeast-facing; 2 stories
- Construction: CBS construction
- Exterior features: Not waterfront; No waterfront features listed
Interior
- Kitchen: Dishwasher; Microwave; Refrigerator
- Bedrooms: No main-level bedrooms
- Flooring: Laminate flooring
- Bathrooms: One full bathroom and one half bathroom (2 total)
- Heating & cooling: Central electric heating; Central electric cooling (central air)
- Interior features: No interior special features listed
- Laundry & utility: Laundry located inside; Unfurnished
Neighborhood map
What this means for you Summary
Snapshot
- This is a 2-bed/2.0-bath condo listed at $300k.
Deal economics
- At list price, monthly cash flow is $701 ($8k/yr) — positive.
- The deal already cash-flows at list — no discount required.
- Meets the 1% rule at list price ($4k rent vs $300k).
- Recommended offer: $264k (12.0% below list) — sets the bar for market timing.
- Cap rate 9.1% vs local median 2.2% in Fort Lauderdale — top-decile yield for the area; either an underpriced asset or a hidden risk that comps aren't pricing in. Stress-test before assuming the spread holds.
Location & tenants
- Location reads 82/100 on livability (#78 in FL, #1,293 nationally) — a professional / high-income tenant draw. Strengths: crime A+, amenities A+, health & safety A+; Watch: cost of living D-.
- Broward (suburban): math 42% / reading 53% proficiency, ranked #46 of 73 in FL (top 63%) — families likely to look elsewhere, expect single-tenant / working-renter base with shorter leases.
- Zoned schools: Bennett Elementary School (math 32% / reading 42%, grade F, #1,609 of 2,144 statewide, top 77%, 329 students, 80% FRL); Sunrise Middle School (math 50% / reading 52%, grade C, #237 of 571 statewide, top 43%, 1,242 students, 64% FRL); Fort Lauderdale High School (math 38% / reading 67%, grade C-, #154 of 667 statewide, top 24%, 2,228 students, 57% FRL) — zoned schools average 67% FRL vs 51% district-wide (16 pts higher); higher-poverty schools than district average — tighter screening recommended.
- Market conditions: Rents rising (+3.6%/yr); 746 active listings in the ZIP; 40 comparable units currently listed for rent nearby; rentals at typical pace (median 23d on market — plan ~3-4 weeks tenant-placement turnaround); solid renter incomes; 2,111 units permitted in Broward County in 2024 (1,265 in 5+ unit buildings).
- At $3,775/mo this rent would consume 48% of the median local household income ($94k/yr) (locally 912% of renters already pay >50% of income on rent) — very limited rent-growth headroom before tenants either downsize or default.
Forward outlook
- Local home prices are declining (-3.0%/yr); year-one equity from $2k of loan paydown is wiped out by about $9k of value loss. Plan a longer hold.
- Broward County population projected at +34% by 2050 — long-run rental-demand tailwind backs the buy-and-hold thesis.
- At projected returns (-3.0% appreciation + 3.6% rent growth), your $84k cash investment doubles in ~10 years — after that, you're playing with house money.
Negotiation context
- It's been on market 370 days — a 12% lower offer ($264k) is reasonable based on typical stale-listing flexibility.
- 3 sale attempts; this cycle's ask has dropped $20k (6%) from the opening price — seller is motivated, your offer sets the floor, not the list.
- Current owner paid $255k; 18% above their basis — modest negotiation headroom, anchor on the comps not their cost.
Risks & watch-outs
- Climate carrying-cost: severe wind risk, 99% chance of damaging wind over 30y; extreme-heat days projected 7→27/yr by 2055 (HVAC capex compounding) — expect insurance premiums to compound above CPI over the hold.
Questions for the listing agent
- It's been on market 370 days. Have you received any prior offers? Is the seller open to a 12% concession, seller financing, or rate buy-down credit?
- Built in 1962 — when were the roof, HVAC, electrical panel, plumbing, and water heater last replaced?
- What does the HOA fee cover, when was the last increase, and are there any pending special assessments or reserve-fund shortfalls?
- Any open or pending special assessments — roof, HVAC, plumbing, elevator, façade? What's the per-unit balance and payoff schedule, and is the seller paying it off at close or rolling it to the buyer?
- Why hasn't it sold? Are there any deal-killer items the seller is aware of (foundation, flood, title, zoning, code violations)?
- Is there a deadline driving the sale (1031 exchange, divorce, estate, relocation)? That informs how much negotiation room exists.
- Schools are B-rated — typically a magnet for longer-tenancy family renters. What's the average tenant stay here, and is there a school-zone premium baked into asking?
- What's the average days-on-market for RENTAL listings here right now (not sales)? A rising rental-DOM trend means longer vacancies and softer asking-rent achievability than the comps imply.
- What's the recent tenant-quality profile in this submarket — average credit score on applications, eviction rate, late-payment / NSF rate, and stable-employment percentage? A property-management company in the area should have these aggregated.
- How much new apartment / multifamily construction is in the pipeline within 1–3 miles? Heavy new supply (>2% of stock underway) typically softens rents 12–24 months out; light construction supports rent growth.
Investment metrics
- 1% rule
- 1.26% ✓
- Cap rate
- 9.10%
- Cash-on-cash
- 10.01%
- DSCR
- 1.45
- GRM
- 6.6
CMA / ARV
No comps found within radius.
Projected returns pro-forma
-3.0% appreciation · 3.63% rent growth · sell at horizon
- IRR
- -0.4%
- Equity multiple
- 0.98×
- Total profit
- $-1,373
- Equity at exit
- $44,716
- IRR
- 10.0%
- Equity multiple
- 1.80×
- Total profit
- $67,035
- Equity at exit
- $25,930
Cash invested: $83,972 (down + closing). Projections, not guarantees.
Landlord ↔ Tenant lean methodology
- Overall (STATE)
- 87 Strongly Landlord-Friendly
- State Florida
- 87 Strongly Landlord-Friendly · R+3
- County
- — inherits STATE
- City
- — inherits STATE
ZIP-level market 33308
- Rents YoY
- 3.6%
- Active inventory
- 746
- Price-to-rent
- 6.6×
Monthly cashflow live
- Estimated rent
- $3,775 high interval (Pro) →
- Mortgage (P&I)
- −$1,573
- Tax from tax record
- −$136 /mo · $1,632/yr
- Insurance
- −$125
- HOA
- −$448
- Vacancy / Maint / Mgmt
- −$793
- Net cashflow
- $701
Break-even live
Sensitivity live
| Price | -10% $871 | -5% $786 | +0% $701 | +5% $616 | +10% $531 |
|---|---|---|---|---|---|
| Rent | -10% $403 | -5% $552 | +0% $701 | +5% $850 | +10% $999 |
| Rate | -1.0pp $852 | -0.5pp $777 | base $701 | +0.5pp $623 | +1.0pp $544 |
UW: 25.0% down · 7.5% · 30yr · 1.5% tax · 5.0% vac · 8.0% maint · 8.0% mgmt
Financing live
Cash to close
- Down payment
- $74,975
- Closing costs
- $8,997
- Reserves months
- —
- Total cash needed
- —
Loan-product check · same deal, 3 products live
Conventional
25% down · 7.5% · 30yr
- Down + closing
- —
- Monthly P&I
- —
- Monthly cashflow
- —
- DSCR
- —
- Eligible?
- —
Personal DTI + credit; lowest rate.
DSCR
20% down · 8.5% · 30yr
- Down + closing
- —
- Monthly P&I
- —
- Monthly cashflow
- —
- DSCR
- —
- Eligible?
- —
No personal income docs; deal must DSCR.
Hard money
10% down · 12.0% · 12mo
- Down + closing
- —
- Monthly P&I
- —
- Monthly cashflow
- —
- DSCR
- —
- Eligible?
- —
Short-term bridge; refi at stabilization.
Rent comps 40 comps
| Address | Beds | Baths | Sqft | Rent | $/sqft | DOM | Units | Dist |
|---|---|---|---|---|---|---|---|---|
| 2100 NE 45th St #1 Fort Lauderdale, FL | 3.0 | 3.5 | 1340 | $9,500 | $7.09 | 25d | 1 | 0.09mi |
| 4804 NE 21st Ave #4804 Fort Lauderdale, FL | 2.0 | 2.0 | 1400 | $4,500 | $3.21 | 25d | 1 | 0.14mi |
| 1575 NE 47th St Oakland Park, FL | 3.0 | 2.0 | 1358 | $3,700 | $2.72 | 25d | 1 | 0.54mi |
| 4764 NE 15th Way Oakland Park, FL | 3.0 | 2.0 | 1218 | $3,500 | $2.87 | 25d | 1 | 0.55mi |
| 4800 Bayview Dr #303 Fort Lauderdale, FL | 2.0 | 2.0 | 1032 | $3,500 | $3.39 | 25d | 1 | 0.68mi |
| 3100 NE 48th St #908 Fort Lauderdale, FL | 2.0 | 2.0 | 1181 | $3,100 | $2.62 | 19d | 1 | 0.82mi |
| 3100 NE 48th St #908 Fort Lauderdale, FL | 2.0 | 2.0 | 1181 | $3,100 | $2.62 | 23d | 1 | 0.82mi |
| 4511 NE 13th Ave Oakland Park, FL | 2.0 | 2.0 | 1400 | $3,200 | $2.29 | 8d | 1 | 0.83mi |
| 4511 NE 13th Ave Oakland Park, FL | 3.0 | 3.0 | 1416 | $4,300 | $3.04 | 5d | 1 | 0.83mi |
| 4511 NE 13th Ave Oakland Park, FL | 3.0 | 3.0 | 1416 | $4,300 | $3.04 | 25d | 1 | 0.83mi |
| 4360 NE 13th Ave Unit Main Oakland Park, FL | 3.0 | 2.0 | 1269 | $4,500 | $3.55 | 23d | 1 | 0.84mi |
| 4360 NE 13th Ave Oakland Park, FL | 3.0 | 2.0 | 1269 | $3,700 | $2.92 | 25d | 1 | 0.84mi |
| 4360 NE 13th Ave Oakland Park, FL | 3.0 | 2.0 | 1459 | $3,700 | $2.54 | 6d | 1 | 0.84mi |
| 1421 NE 41st St Oakland Park, FL | 2.0 | 2.0 | 1366 | $4,000 | $2.93 | 25d | 1 | 0.85mi |
| 3111 NE 51st St Unit 301 Fort Lauderdale, FL | 2.0 | 2.0 | 1300 | $3,800 | $2.92 | 25d | 1 | 0.86mi |
| 2155 NE 56th Ct Fort Lauderdale, FL | 3.0 | 2.0 | 1500 | $3,500 | $2.33 | 25d | 1 | 0.87mi |
| 3411 N Federal Hwy Fort Lauderdale, FL | 2.0 | 1.0–2.0 | 754 | $3,545 | $4.70 | 3d | 59 | 1.03mi |
| 3781 NE 13th Ave Oakland Park, FL | 2.0 | 1.0 | 869 | $3,900 | $4.49 | 25d | 1 | 1.10mi |
| 233 Commercial Blvd Unit 1541802P Lauderdale-By-The-Sea, FL | 2.0 | 2.0 | 1291 | $3,876 | $3.00 | 4d | 1 | 1.15mi |
| 3333 N Federal Hwy Fort Lauderdale, FL | 2.0 | 1.0–2.0 | 736 | $3,228 | $4.38 | 3d | 13 | 1.18mi |
| 4780 NE 8th Ter Oakland Park, FL | 3.0 | 2.0 | 1130 | $4,200 | $3.72 | 25d | 1 | 1.18mi |
| 3605 NE 32nd Ave Unit 209A Fort Lauderdale, FL | 2.0 | 2.0 | 1000 | $3,300 | $3.30 | 2d | 1 | 1.19mi |
| 3605 NE 32nd Ave Unit 209A Fort Lauderdale, FL | 2.0 | 2.0 | 1000 | $3,300 | $3.30 | 21d | 1 | 1.19mi |
| 1680 NE 34th Ln Unit B Oakland Park, FL | 2.0 | 2.0 | 1084 | $3,100 | $2.86 | 20d | 1 | 1.19mi |
| 3801 Dixie Hwy Oakland Park, FL | 2.0 | 1.0–2.0 | 944 | $3,584 | $3.80 | 15d | 45 | 1.20mi |
| 4013 N Ocean Dr #102 Fort Lauderdale, FL | 1.0 | 1.5 | 790 | $3,500 | $4.43 | 25d | 1 | 1.21mi |
| 4511 Seagrape Dr Lauderdale by the Sea, FL | 2.0 | 2.0 | 1218 | $3,500 | $2.87 | 25d | 1 | 1.24mi |
| 2169 Imperial Point Dr Fort Lauderdale, FL | 2.0 | 2.0 | 1300 | $4,200 | $3.23 | 25d | 1 | 1.25mi |
| 4280 Galt Ocean Dr Fort Lauderdale, FL | 1.0–3.0 | 2.0–2.5 | 2025 | $6,000 | $2.96 | 23d | 5 | 1.26mi |
| 4280 Galt Ocean Dr Fort Lauderdale, FL | 1.0–3.0 | 1.5–2.5 | 2025 | $6,250 | $3.09 | 5d | 5 | 1.26mi |
| 4280 Galt Ocean Dr Fort Lauderdale, FL | 1.0–3.0 | 2.0–2.5 | 2025 | $6,000 | $2.96 | 18d | 5 | 1.26mi |
| 4280 Galt Ocean Dr Fort Lauderdale, FL | 1.0–3.0 | 1.5–2.5 | 2025 | $6,250 | $3.09 | 3d | 5 | 1.26mi |
| 4512 Sea Grape Dr Unit 1 Lauderdale-By-The-Sea, FL | 1.0 | 1.0 | 853 | $3,500 | $4.10 | 25d | 1 | 1.28mi |
| 4250 Galt Ocean Dr Fort Lauderdale, FL | 2.0 | 2.0 | 1350 | $3,650 | $2.70 | 3d | 2 | 1.29mi |
| 4144 El Mar Dr Unit 1 Lauderdale-By-The-Sea, FL | 2.0 | 2.0 | 1116 | $3,250 | $2.91 | 25d | 1 | 1.32mi |
| 4020 Galt Ocean Dr Fort Lauderdale, FL | 1.0–2.0 | 1.0–2.0 | 1536 | $8,750 | $5.69 | 5d | 7 | 1.33mi |
| 4020 Galt Ocean Dr Fort Lauderdale, FL | 1.0–2.0 | 1.0–2.0 | 1553 | $8,750 | $5.63 | 5d | 6 | 1.33mi |
| 4010 Galt Ocean Dr Fort Lauderdale, FL | 2.0–3.0 | 2.0 | 810 | $5,000 | $6.17 | 6d | 2 | 1.34mi |
| 4010 Galt Ocean Dr Fort Lauderdale, FL | 2.0–3.0 | 2.0 | 810 | $3,200 | $3.95 | 5d | 3 | 1.34mi |
| 4010 Galt Ocean Dr Fort Lauderdale, FL | 2.0–3.0 | 2.0 | 1355 | $5,000 | $3.69 | 14d | 2 | 1.34mi |
HOA detail condo
- Monthly dues
- $448 · $5,376/yr
- Likely covers
- trashpool
- Assessments
- None detected in remarks — confirm with the listing agent.
Listing history 21 events
-
2026-06-21days on market $299,900 Active 370 DOM
-
2026-06-18days on market $299,900 Active 367 DOM
-
2026-06-17days on market $299,900 Active 366 DOM
-
2026-06-16days on market $299,900 Active 365 DOM
-
2026-06-15days on market $299,900 Active 364 DOM
-
2026-06-13days on market $299,900 Active 362 DOM
-
2026-06-09days on market $299,900 Active 358 DOM
-
2026-06-08days on market $299,900 Active 357 DOM
-
2026-06-07days on market $299,900 Active 356 DOM
-
2026-06-04days on market $299,900 Active 353 DOM
-
2026-06-03days on market $299,900 Active 352 DOM
-
2026-06-02days on market $299,900 Active 351 DOM
-
2026-06-01days on market $299,900 Active 350 DOM
-
2026-05-31days on market $299,900 Active 349 DOM
-
2026-03-31price $299,900
-
2026-01-15status Active
-
2025-12-08historical
-
2025-11-10status Active
-
2025-11-10historical
-
2025-05-09$319,900 Active
-
2005-08-30soldstatus $255,000
ⓘ Source: listings_history table (triggers on properties + properties_extension) + one-shot
backfill from property_details.listing_events for pre-trigger history.
Tax reassessment forecast FL · Resets to sale price
- Current annual tax
- $1,632 · $136/mo
- Projected year-2 tax
- $2,489 · $207/mo
- Expected delta
- +$857/yr (+$71/mo · 52.5%)
ⓘ Screening estimate from a state-policy table — verify with the county assessor before closing.
Climate risk First Street
- Flood 1/10 Low FEMA zone X (shaded) · 0% chance over 30 yrs
- Wildfire 1/10 Low
- Heat 10/10 Extreme 7 d/yr ≥105°F today · 27 d/yr by 30 yrs out
- Wind 10/10 Extreme 99% chance of damaging wind over 30 yrs
- Air quality 2/10 Low 1 unhealthy d/yr today · 2 by 30 yrs out
Nearby sold comps map
Loading sold comps map…
Walkable amenities ~0.75 mi
Loading nearby amenities…
Taxation est. · year 1
- Rental income
- $45,302
- − Mortgage interest
- −$16,799
- − Property taxes
- −$1,632
- − Insurance
- −$1,500
- − Repairs & maintenance
- −$3,624
- − Management
- −$3,624
- − HOA
- −$5,376
- − Depreciation
- −$8,724
- Taxable income
- $4,023
- Est. tax owed @ 24.0%
- −$966
- After-tax cash flow
- $7,443/yr
For passive investors: Depreciation is non-cash, so a rental often shows a tax loss while cash-flowing — sheltering income. Rental losses are passive: they offset passive income freely, and up to $25,000/yr can offset ordinary (W-2) income if you actively participate and your MAGI is under $100k (phasing out to $0 by $150k); unused losses carry forward. On sale, claimed depreciation is recaptured at up to 25%, and gains may owe capital-gains tax (a 1031 exchange can defer both). Figures are a year-1 estimate at your 24.0% rate — not tax advice; consult a CPA.
Schools (NCES district)
- District
- Broward
- NCES district ID
- 1200180
- Math proficiency
- 42% ▼ -18.00%
- Reading proficiency
- 53% ▼ -5.00%
- Median HH income
- $52,139
- Composite
- 40.88/100
- National rank
- #3621
- State rank
- #46 of 73 in FL
Livability — Fort Lauderdale
- Score
- 82/100
- State rank
- #78
- US rank
- #1293
Category grades
Schools grade is shown separately in the Schools card above.
Census & demographics
- Census place
- Fort Lauderdale, FL
- County
- Broward County · 1,963,430 people
- City population
- 235,769
- Metro
- Miami-Fort Lauderdale-Pompano Beach, FL
- Population (ZIP)
- 27,935
- Household income
- $93,879
- Rent vs Own
- Severe rent burden
- 912.0
Population outlook (Broward County) Hauer SSP2
- Today (2025)
- 2,207,033 people
- By 2030
- 2,360,704 · +7.0%
- By 2040
- 2,661,208 · +20.6%
- By 2050
- 2,946,698 · +33.5%
- By 2075
- 3,602,273 · +63.2%
- By 2100
- 3,970,984 · +79.9%
Race, ethnicity, and origin ACS 2023
- Neighborhood character
- Predominantly White (75%)
- Race & ethnicity
- White 75% Hispanic / Latino 16% Two or more races 14% Asian 3% Black 2%
- Hispanic origin (detail)
- Puerto Rican 2% Cuban 3%
- Common ancestry
- Romanian 4% Lithuanian 3% Scotch-Irish 3%
- Foreign-born
- 24% · Canada, Jamaica, Dominican Republic
- Languages at home
- 75% English-only · Spanish 14% Other Indo-European 5% Russian/Polish/Slavic 2%
Political lean MEDSL · Broward
- 2024 margin
- D (+17.0) · D 58.0% · R 41.0%
- 2008→2024 swing
- -17.8pp toward R · 2008: 34.7pp · 2024: 17.0pp
- All cycles
- 2024: D+17.0 2020: D+29.8 2016: D+35.0 2012: D+34.9 2008: D+34.7
Not yet ingested
- Civics
- —
Market trends
- HPI YoY
- ▼ -417.95%
- Current HPI
- 325.3902
- Rent YoY
- ▲ 3.63%
- Metro
- Miami-Fort Lauderdale-Pompano Beach, FL
- State GDP YoY
- ▲ 3.28%
- F500 in state
- 36
Industry mix (Fortune 500 HQ in FL)
| Industry | F500 HQs | Revenue |
|---|---|---|
| Industrial Technology | 2 | $29B |
|
||
| Insurance | 2 | $17B |
|
||
| Retail | 1 | $60B |
|
||
| Technology Distribution | 1 | $58B |
|
||
| Homebuilding | 1 | $35B |
|
||
| Technology Manufacturing | 1 | $35B |
|
||
Price history
+17.6% since first listed7 events — show timeline
- 2026-03-31 Price Changed $299,900 Beaches MLS
- 2026-01-15 Relisted — Beaches MLS
- 2025-12-08 Listing Removed — Beaches MLS
- 2025-11-10 Relisted — Beaches MLS
- 2025-11-10 Listing Removed — Beaches MLS
- 2025-05-09 Listed $319,900 Beaches MLS
- 2005-08-30 Sold (Public Records) $255,000 Public Records
Property tax history
+5.3%/yrLatest (2025): $1,632 · +9.3% YoY. Source: county tax records.
Cash-flow waterfall
monthlySold comps — $/sqft
last 12 mo · ≤1 miLoading sold comps…