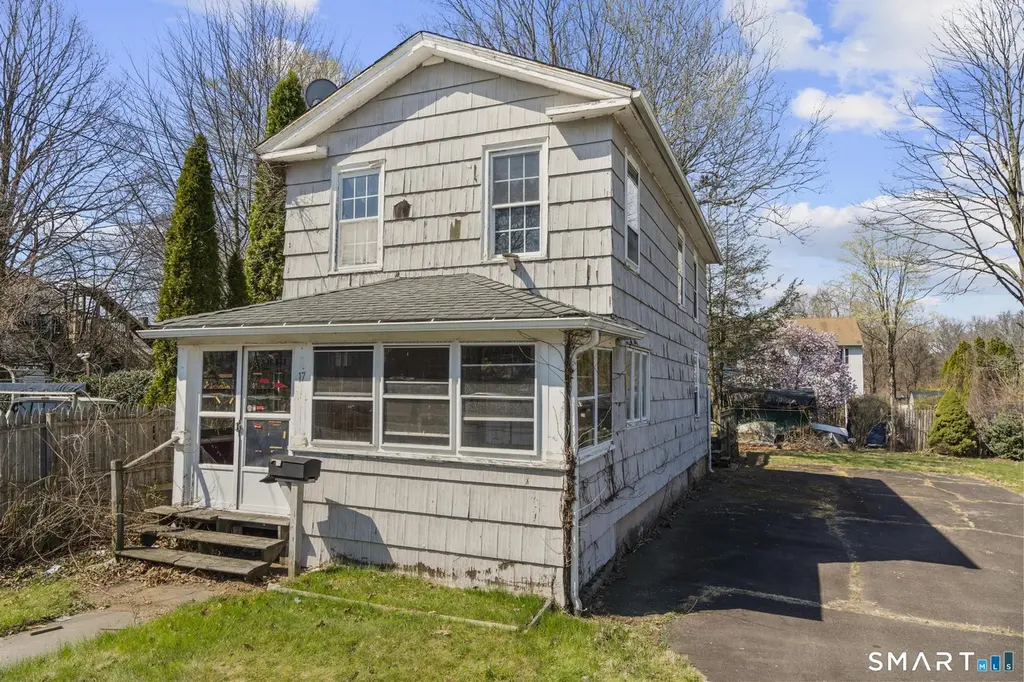
17 Stafford Ave · Bristol, CT
Flood risk 1/10 · Minimal
- FEMA flood zone
- X (unshaded)
- Chance of flooding over 30 yrs
- 0.0%
- Est. flood insurance / yr
- $473 – $860
Fire risk 1/10 · Minimal
- Est. fire insurance / yr
- $829 – $1,539
Heat risk 5/10 · Moderate
- Hot days now (above 98°F)
- 7 days/yr
- Hot days in 30 yrs
- 15 days/yr
Wind risk 6/10 · Moderate
- Chance of severe wind over 30 yrs
- 27.0%
Air-quality risk 3/10 · Minor
- Unhealthy air days now
- 2 days/yr
- Unhealthy air days in 30 yrs
- 3 days/yr
Risk factors via First Street. Map © Google.
Why this score? — see what drove the C+ grade
The composite is a weighted blend of 9 inputs, each scored 0–100. Each bar is that input's sub-score; the figure is the points it added to the 100-point composite (weight × sub-score).
- Cash flow +22.8/30.0
- ARV discount +15.0/15.0
- DSCR +7.3/10.0
- 1% rule +6.0/10.0
- Livability +4.0/5.0
- Rent growth +3.9/5.0
- Schools +3.2/10.0
- Condition / age +2.5/5.0
- Appreciation +0.0/10.0
$174,900
🖨 Deal sheet 📄 Offer letter ✓ Due diligence
Listing remarks
MULTIPLE OFFERS - Best & Highest requested by Monday April 20th by 12pm. Investor opportunity. Value add potential with this 1,208 square foot Colonial features 3 bedrooms, 1 full bathroom, and 1 half bathroom on a level . 22-acre lot. The interior presents a mix of partial updates and areas requiring renovation. Notable features include hardwood flooring in main living areas and a modernized full bathroom with tile surround on the upper level. Beyond the interior, the home boasts functional assets including a enclosed front porch, a paved driveway, and a level side yard with great landscaping potential. Its central location offers immediate proximity to retail stores, restaurants, an
Key facts
- Hardwood flooring
- Level side yard
- Central location
Tags
Neighborhood map
What this means for you Summary
Snapshot
- This is a 3-bed/1.5-bath single-family listed at $175k.
Deal economics
- At list price, monthly cash flow is $304 ($4k/yr) — positive.
- The deal already cash-flows at list — no discount required.
- Meets the 1% rule at list price ($2k rent vs $175k).
- Cap rate 8.4% vs local median 3.3% in Bristol — top-decile yield for the area; either an underpriced asset or a hidden risk that comps aren't pricing in. Stress-test before assuming the spread holds.
Location & tenants
- Location reads 81/100 on livability (#21 in CT, #1,585 nationally) — a professional / high-income tenant draw. Strengths: crime A+, housing A+, health & safety A+; Watch: schools C-, commute F.
- Bristol School District (suburban): math 28% / reading 44% proficiency, ranked #109 of 153 in CT (top 71%) — families likely to look elsewhere, expect single-tenant / working-renter base with shorter leases.
- Market conditions: Rents rising fast (+5.4%/yr); 220 active listings in the ZIP; 17 comparable units currently listed for rent nearby; rentals at typical pace (median 20d on market — plan ~3-4 weeks tenant-placement turnaround); solid renter incomes; 502 units permitted in Naugatuck Valley Planning Region in 2024 (171 in 5+ unit buildings).
Forward outlook
- Local home prices are declining (-3.0%/yr); year-one equity from $1k of loan paydown is wiped out by about $5k of value loss. Plan a longer hold.
- At projected returns (-3.0% appreciation + 5.4% rent growth), your $49k cash investment doubles in ~10 years — after that, you're playing with house money.
Negotiation context
- Only 5 days on market — expect competitive offers; lowballing is unlikely to land.
- 5 sale attempts since 26y ago with the ask held roughly flat each time — persistent listings suggest the price (not the market) is what's stuck; bring a comps-based counter.
Risks & watch-outs
- Watch-outs: built in 1900 — expect roof / HVAC / electrical / plumbing capex.
- Climate carrying-cost: major wind risk, 27% chance of damaging wind over 30y; extreme-heat days projected 7→15/yr by 2055 (HVAC capex compounding) — expect insurance premiums to compound above CPI over the hold.
Questions for the listing agent
- Built in 1900 — when were the roof, HVAC, electrical panel, plumbing, and water heater last replaced?
- Is there a deadline driving the sale (1031 exchange, divorce, estate, relocation)? That informs how much negotiation room exists.
- What's the average days-on-market for RENTAL listings here right now (not sales)? A rising rental-DOM trend means longer vacancies and softer asking-rent achievability than the comps imply.
- What's the recent tenant-quality profile in this submarket — average credit score on applications, eviction rate, late-payment / NSF rate, and stable-employment percentage? A property-management company in the area should have these aggregated.
- How much new for-sale + rental construction is in the pipeline within 1–3 miles? Heavy new supply typically softens prices + rents 12–24 months out; constrained supply supports both.
Investment metrics
- 1% rule
- 1.10% ✓
- Cap rate
- 8.38%
- Cash-on-cash
- 7.45%
- DSCR
- 1.33
- GRM
- 7.6
CMA / ARV
- ARV (on-the-fly)
- $334,616
- Comps found
- 12
Show comp detail 12 sales within ~0.75 mi
| Address | Dist | Beds/Ba | Sqft | Sold | Price | $/sf | Match |
|---|---|---|---|---|---|---|---|
| 17 Stafford Ave | 0.00mi | 3/1.5 | 1,208 (0%) | 1mo | $195,000 | $161 | 99 |
| 46 Pleasant Ave | 0.19mi | 3/1.5 | 1,144 (-5%) | 7mo | $286,500 | $250 | 76 |
| 47 Meiklem St | 0.42mi | 3/1.5 | 1,196 (-1%) | 7mo | $200,000 | $167 | 73 |
| 19 Bingham St | 0.42mi | 3/1.5 | 1,079 (-11%) | 3mo | $230,000 | $213 | 60 |
| 54 W Washington St | 0.23mi | 3/1.0 | 1,379 (+14%) | 7mo | $550,000 | $399 | 58 |
| 189 Mechanic St | 0.50mi | 2/2.0 (-1) | 1,095 (-9%) | 1mo | $303,000 | $277 | 54 |
| 28 Rowe Pl | 0.24mi | 4/1.0 (+1) | 1,044 (-14%) | 9mo | $325,000 | $311 | 52 |
| 3 Topview Ter | 0.69mi | 3/2.5 | 1,148 (-5%) | 6mo | $330,000 | $287 | 50 |
| 41 E New St | 0.44mi | 3/1.0 | 1,044 (-14%) | 8mo | $310,000 | $297 | 48 |
| 201 Westwoods Ter | 0.74mi | 3/1.0 | 1,086 (-10%) | 2mo | $342,500 | $315 | 45 |
| 115 Garfield Rd | 0.65mi | 3/1.0 | 1,076 (-11%) | 6mo | $270,000 | $251 | 44 |
| 38 Buckley Ave | 0.43mi | 4/2.0 (+1) | 1,382 (+14%) | 6mo | $360,000 | $260 | 44 |
Match score weights: distance 35% · size 25% · config 20% · recency 20%. Top-matched comps best support the ARV.
Projected returns pro-forma
-3.0% appreciation · 5.41% rent growth · sell at horizon
- IRR
- -2.2%
- Equity multiple
- 0.91×
- Total profit
- $-4,180
- Equity at exit
- $26,078
- IRR
- 10.0%
- Equity multiple
- 1.86×
- Total profit
- $41,962
- Equity at exit
- $15,122
Cash invested: $48,972 (down + closing). Projections, not guarantees.
Landlord ↔ Tenant lean methodology
- Overall (STATE)
- 27 Tenant-Leaning
- State Connecticut
- 27 Tenant-Leaning · D+7
- County
- — inherits STATE
- City
- — inherits STATE
ZIP-level market 06010
- Rents YoY
- 5.4%
- Active inventory
- 220
- Price-to-rent
- 7.6×
Monthly cashflow live
- Estimated rent
- $1,919 high interval (Pro) →
- Mortgage (P&I)
- −$917
- Tax from tax record
- −$222 /mo · $2,660/yr
- Insurance
- −$73
- HOA
- −$0
- Vacancy / Maint / Mgmt
- −$403
- Net cashflow
- $304
Break-even live
UW: 25.0% down · 7.5% · 30yr · 1.5% tax · 5.0% vac · 8.0% maint · 8.0% mgmt
Financing live
Cash to close
- Down payment
- $43,725
- Closing costs
- $5,247
- Reserves months
- —
- Total cash needed
- —
Loan-product check · same deal, 3 products live
Conventional
25% down · 7.5% · 30yr
- Down + closing
- —
- Monthly P&I
- —
- Monthly cashflow
- —
- DSCR
- —
- Eligible?
- —
Personal DTI + credit; lowest rate.
DSCR
20% down · 8.5% · 30yr
- Down + closing
- —
- Monthly P&I
- —
- Monthly cashflow
- —
- DSCR
- —
- Eligible?
- —
No personal income docs; deal must DSCR.
Hard money
10% down · 12.0% · 12mo
- Down + closing
- —
- Monthly P&I
- —
- Monthly cashflow
- —
- DSCR
- —
- Eligible?
- —
Short-term bridge; refi at stabilization.
Rent comps 17 comps
| Address | Beds | Baths | Sqft | Rent | $/sqft | DOM | Units | Dist |
|---|---|---|---|---|---|---|---|---|
| 91 Holden St Unit 3rd Bristol, CT | 2.0 | 1.0 | 700 | $1,400 | $2.00 | 43d | 1 | 0.76mi |
| 164 Sycamore St Unit 2R Bristol, CT | 2.0 | 1.0 | 862 | $1,650 | $1.91 | 43d | 1 | 0.85mi |
| 380 King St #5 Bristol, CT | 3.0 | 2.5 | 1440 | $2,750 | $1.91 | 19d | 1 | 0.87mi |
| 322 Emmett St Bristol, CT | 2.0 | 1.0 | 825 | $1,750 | $2.12 | 19d | 1 | 1.00mi |
| 371 Emmett St #62 Bristol, CT | 2.0 | 1.0 | 900 | $1,800 | $2.00 | 1d | 1 | 1.03mi |
| 556 King St Bristol, CT | 1.0–2.0 | 1.0 | 712 | $1,400 | $1.96 | 1d | 1 | 1.07mi |
| 9B Daniel Rd Unit 9B Bristol, CT | 3.0 | 1.0 | 786 | $2,150 | $2.74 | 23d | 1 | 1.09mi |
| 115 Beths Ave #3 Bristol, CT | 2.0 | 1.5 | 1232 | $1,850 | $1.50 | 23d | 1 | 1.16mi |
| 410 Emmett St #21 Bristol, CT | 2.0 | 1.5 | 1092 | $1,750 | $1.60 | 23d | 1 | 1.18mi |
| 515 Emmett St Unit B11 Bristol, CT | 2.0 | 1.0 | 936 | $1,650 | $1.76 | 21d | 1 | 1.20mi |
| 43 Hiltbrand Rd Unit 2-9 Bristol, CT | 2.0 | 1.5 | 990 | $1,875 | $1.89 | 3d | 1 | 1.20mi |
| 513 Emmett St Unit B11 Bristol, CT | 3.0 | 1.0 | 936 | $2,000 | $2.14 | 19d | 1 | 1.22mi |
| 513 Emmett St Bristol, CT | 3.0 | 1.0 | 936 | $2,000 | $2.14 | 1d | 1 | 1.22mi |
| 422 Emmett St Unit J Bristol, CT | 2.0 | 1.0 | 710 | $1,850 | $2.61 | 2d | 1 | 1.24mi |
| 252 Blakeslee St #4 Bristol, CT | 2.0 | 1.5 | 800 | $1,800 | $2.25 | 43d | 1 | 1.31mi |
| 155 Redstone Hill Rd #176 Bristol, CT | 2.0 | 1.5 | 1104 | $2,100 | $1.90 | 43d | 1 | 1.32mi |
| 1175 Farmington Ave Bristol, CT | 2.0 | 1.0–1.5 | 875 | $2,039 | $2.33 | 1d | 12 | 1.39mi |
Listing history 13 events
-
2026-04-21status Under Contract
-
2026-04-16$174,900 Active
-
2008-04-08soldstatus $165,000
-
2008-03-19historical
-
2008-02-19$185,000
-
2007-07-06historical
-
2007-01-11$169,900
-
2006-06-09soldstatus $135,000
-
2006-06-09soldstatus $135,000
-
2005-10-28$135,000
-
2000-05-30soldstatus $93,000
-
2000-02-18$95,000
-
1988-12-02soldstatus $129,000
ⓘ Source: listings_history table (triggers on properties + properties_extension) + one-shot
backfill from property_details.listing_events for pre-trigger history.
Tax reassessment forecast CT · Partial reset (capped growth)
- Current annual tax
- $2,660 · $222/mo
- Projected year-2 tax
- $3,201 · $267/mo
- Expected delta
- +$541/yr (+$45/mo · 20.4%)
ⓘ Screening estimate from a state-policy table — verify with the county assessor before closing.
Climate risk First Street
- Flood 1/10 Low FEMA zone X (unshaded) · 0% chance over 30 yrs
- Wildfire 1/10 Low
- Heat 5/10 Major 7 d/yr ≥98°F today · 15 d/yr by 30 yrs out
- Wind 6/10 Major 27% chance of damaging wind over 30 yrs
- Air quality 3/10 Moderate 2 unhealthy d/yr today · 3 by 30 yrs out
Nearby sold comps map
Loading sold comps map…
Walkable amenities ~0.75 mi
Loading nearby amenities…
Taxation est. · year 1
- Rental income
- $23,025
- − Mortgage interest
- −$9,797
- − Property taxes
- −$2,660
- − Insurance
- −$874
- − Repairs & maintenance
- −$1,842
- − Management
- −$1,842
- − Depreciation
- −$5,088
- Taxable income
- $921
- Est. tax owed @ 24.0%
- −$221
- After-tax cash flow
- $3,428/yr
For passive investors: Depreciation is non-cash, so a rental often shows a tax loss while cash-flowing — sheltering income. Rental losses are passive: they offset passive income freely, and up to $25,000/yr can offset ordinary (W-2) income if you actively participate and your MAGI is under $100k (phasing out to $0 by $150k); unused losses carry forward. On sale, claimed depreciation is recaptured at up to 25%, and gains may owe capital-gains tax (a 1031 exchange can defer both). Figures are a year-1 estimate at your 24.0% rate — not tax advice; consult a CPA.
Schools (NCES district)
- District
- Bristol School District
- NCES district ID
- 0900510
- Math proficiency
- 28% ▼ -10.00%
- Reading proficiency
- 44% ▼ -5.00%
- Median HH income
- $59,953
- Composite
- 32.07/100
- National rank
- #5814
- State rank
- #109 of 153 in CT
Livability — Bristol
- Score
- 81/100
- State rank
- #21
- US rank
- #1585
Category grades
Schools grade is shown separately in the Schools card above.
Census & demographics
- Census place
- Bristol, CT
- County
- Hartford County · 754,208 people
- City population
- 61,684
- Metro
- Hartford-East Hartford-Middletown, CT
- Population (ZIP)
- 61,684
- Household income
- $79,314
- Rent vs Own
- Severe rent burden
- 2172.0
Population outlook (Naugatuck Valley County) Hauer SSP2
- By 2040
- 496,846
Race, ethnicity, and origin ACS 2023
- Neighborhood character
- Majority White (65%)
- Race & ethnicity
- White 65% Hispanic / Latino 19% Two or more races 13% Black 7% Asian 5%
- Hispanic origin (detail)
- Mexican 2% Puerto Rican 13%
- Common ancestry
- Lithuanian 11% Romanian 10% Slovak 1%
- Foreign-born
- 10% · Canada
- Languages at home
- 79% English-only · Spanish 11% Other Indo-European 3% Russian/Polish/Slavic 2%
Political lean MEDSL · Naugatuck Valley
- 2024 margin
- Lean R (+7.4) · D 45.6% · R 53.0% · Other 1.4%
- All cycles
- 2024: R+7.4
Not yet ingested
- Civics
- —
Market trends
- HPI YoY
- ▼ -293.55%
- Current HPI
- 255.5419
- Rent YoY
- ▲ 5.41%
- Metro
- Hartford-East Hartford-Middletown, CT
- State GDP YoY
- ▲ 1.06%
- F500 in state
- 38
Industry mix (Fortune 500 HQ in CT)
| Industry | F500 HQs | Revenue |
|---|---|---|
| Industrial Machinery | 4 | $38B |
|
||
| Insurance | 3 | $71B |
|
||
| Financial Services | 2 | $25B |
|
||
| Transportation / Logistics | 2 | $18B |
|
||
| Healthcare | 1 | $247B |
|
||
| Telecommunications | 1 | $55B |
|
||
Price history
+35.6% since first listed13 events — show timeline
- 2026-04-21 Pending — Smart MLS
- 2026-04-16 Listed $174,900 Smart MLS
- 2008-04-08 Sold (Public Records) $165,000 Public Records
- 2008-03-19 Listing Removed — Smart MLS
- 2008-02-19 Listed $185,000 Smart MLS
- 2007-07-06 Listing Removed — Smart MLS
- 2007-01-11 Listed $169,900 Smart MLS
- 2006-06-09 Sold (Public Records) $135,000 Public Records
- 2006-06-09 Sold (MLS) $135,000 Smart MLS
- 2005-10-28 Listed $135,000 Smart MLS
- 2000-05-30 Sold (MLS) $93,000 Smart MLS
- 2000-02-18 Listed $95,000 Smart MLS
- 1988-12-02 Sold (Public Records) $129,000 Public Records
Property tax history
-1.3%/yrLatest (2025): $2,660 · +6.0% YoY. Source: county tax records.
Cash-flow waterfall
monthlySold comps — $/sqft
last 12 mo · ≤1 miLoading sold comps…