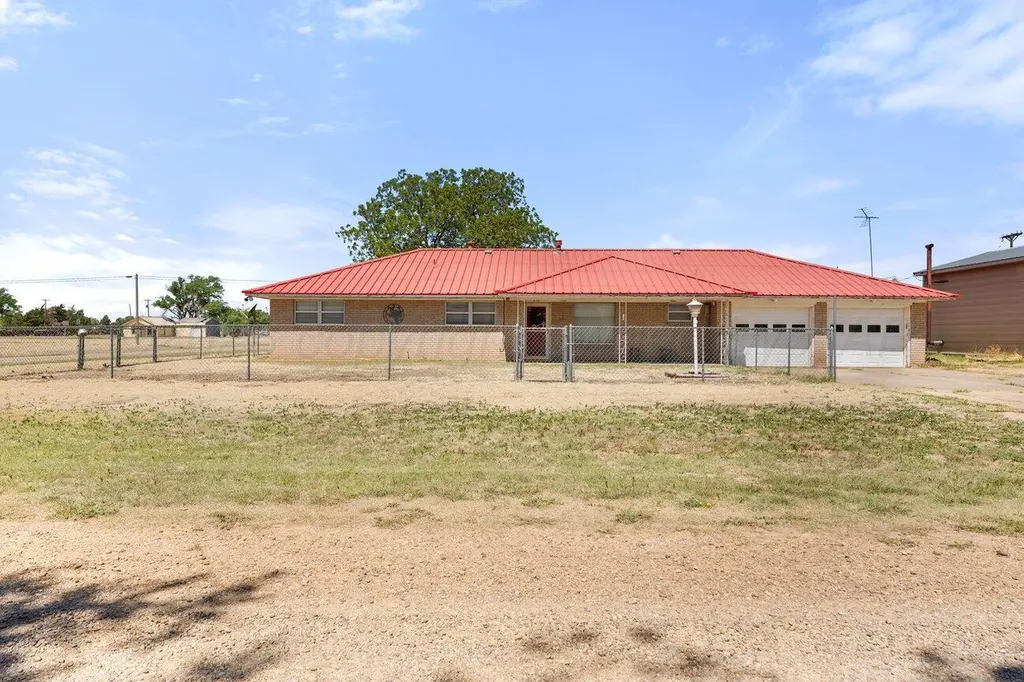
516 Tascosa Ave · Channing, TX
Flood risk 1/10 · Minimal
- FEMA flood zone
- —
- Chance of flooding over 30 yrs
- 0.0%
- Est. flood insurance / yr
- —
Fire risk 8/10 · Major
- Est. fire insurance / yr
- $1,222 – $2,270
Heat risk 5/10 · Moderate
- Hot days now (above 98°F)
- 7 days/yr
- Hot days in 30 yrs
- 18 days/yr
Wind risk 2/10 · Minimal
- Chance of severe wind over 30 yrs
- —
Air-quality risk 2/10 · Minimal
- Unhealthy air days now
- 2 days/yr
- Unhealthy air days in 30 yrs
- 2 days/yr
Risk factors via First Street. Map © Google.
Why this score? — see what drove the D grade
The composite is a weighted blend of 9 inputs, each scored 0–100. Each bar is that input's sub-score; the figure is the points it added to the 100-point composite (weight × sub-score).
- Cash flow +9.8/30.0
- ARV discount +7.5/15.0
- Appreciation +7.5/10.0
- Schools +3.7/10.0
- Livability +3.1/5.0
- 1% rule +2.9/10.0
- DSCR +2.8/10.0
- Rent growth +2.5/5.0
- Condition / age +2.5/5.0
$150,000
🖨 Deal sheet (PDF) 📄 Offer letter ✓ Due diligence
Listing remarks
Charming 3 bed, 2 bath home on a large lot with old-time charm and plenty of space! This property features a 2-car garage, TWO shops/workspaces, and a storm shelter. Inside, you'll love the spacious kitchen with a double oven and tons of cabinet space, perfect for cooking and entertaining. The primary bathroom includes his-and-her sinks, and the home offers comfortable living with character throughout. A rare find with room to work, store, and enjoy both inside and out
Key facts
- Spacious kitchen
- Large lot
- Storm shelter
Tags
Property features AI
Exterior
- Parking: Attached garage with space for 2 vehicles
- Home design: Single-family residential property
- Exterior features: Zoning in the 5000 series (5000 - All areas in the 5000's); RV access/parking available
Interior
- Bathrooms: 2 full bathrooms
- Interior features: Directions provided from center of Channing: head east on Tascosa Ave for about 0.3 miles; 516 Tascosa will be on the left
Neighborhood map
What this means for you Summary
Snapshot
- This is a 3-bed/2.0-bath single-family listed at $150k.
Deal economics
- At list price, monthly cash flow is $-97 ($-1k/yr) — negative.
- To cash-flow at today's rent, offer at most $136k (9.4% below list).
- To meet the 1% rule (rent ≥ 1% of price), the offer needs to be $119k (20.7% below list).
- Recommended offer: $119k (20.7% below list) — sets the bar for 1% rule.
Location & tenants
- Location reads 62/100 on livability (#927 in TX) — a middle-class / working-renter tenant base. Strengths: cost of living A+, housing A+; Watch: schools C-, crime D-, amenities F.
- Channing ISD (rural): math 40% / reading 40% proficiency, ranked #705 of 1,141 in TX (top 62%) — families likely to look elsewhere, expect single-tenant / working-renter base with shorter leases.
- Market conditions: 2 active listings in the ZIP.
Forward outlook
- In year one you build about $9k of equity ($1k loan paydown + $8k appreciation (5.0% local appreciation)).
- Hartley County population projected at +9% by 2050 — modest demand growth; plan on rents tracking national, not racing it.
- By year 5, paydown + projected appreciation supports a ~$37k cash-out refi (75% LTV) — recoverable capital for the next deal without selling this one.
Negotiation context
- It's been on market 21 days — a 2% lower offer ($148k) is reasonable based on typical stale-listing flexibility.
Risks & watch-outs
- Climate carrying-cost: severe wildfire risk; extreme-heat days projected 7→18/yr by 2055 (HVAC capex compounding) — expect insurance premiums to compound above CPI over the hold.
Questions for the listing agent
- What do current leases actually rent for vs. the listed asking? Can we see a recent rent roll and the last 12 months of T-12 income?
- Built in 1977 — when were the roof, HVAC, electrical panel, plumbing, and water heater last replaced?
- Is there a deadline driving the sale (1031 exchange, divorce, estate, relocation)? That informs how much negotiation room exists.
- Crime grade is D in this area — have there been break-ins, vandalism, or insurance claims at this property in the last 3 years? What carrier currently insures it and at what premium?
- The area grade is low — what's the realistic commute time and amenity access for the typical tenant pool here? Any planned neighborhood developments (good or bad) we should know about?
- What's the average days-on-market for RENTAL listings here right now (not sales)? A rising rental-DOM trend means longer vacancies and softer asking-rent achievability than the comps imply.
- What's the recent tenant-quality profile in this submarket — average credit score on applications, eviction rate, late-payment / NSF rate, and stable-employment percentage? A property-management company in the area should have these aggregated.
- How much new for-sale + rental construction is in the pipeline within 1–3 miles? Heavy new supply typically softens prices + rents 12–24 months out; constrained supply supports both.
Investment metrics
- 1% rule
- 0.79% ✗
- Cap rate
- 5.52%
- Cash-on-cash
- -2.77%
- DSCR
- 0.88
- GRM
- 10.5
CMA / ARV
No comps found within radius.
Projected returns pro-forma
5.0% appreciation · 3.0% rent growth · sell at horizon
- IRR
- 10.6%
- Equity multiple
- 1.68×
- Total profit
- $28,425
- Equity at exit
- $85,011
- IRR
- 11.9%
- Equity multiple
- 3.17×
- Total profit
- $91,328
- Equity at exit
- $146,725
Cash invested: $42,000 (down + closing). Projections, not guarantees.
Landlord ↔ Tenant lean methodology
- Overall (STATE)
- 87 Strongly Landlord-Friendly
- State Texas
- 87 Strongly Landlord-Friendly · R+5
- County
- — inherits STATE
- City
- — inherits STATE
ZIP-level market 79018
- Home prices YoY
- 5.1%
- Active inventory
- 2
- Price-to-rent
- 10.5×
Monthly cashflow live
- Estimated rent
- $1,189 medium interval (Pro) →
- Mortgage (P&I)
- −$787
- Tax est. 1.5%
- −$188 /mo · $2,250/yr
- Insurance
- −$62
- HOA
- −$0
- Vacancy / Maint / Mgmt
- −$250
- Net cashflow
- $-97
Break-even live
Sensitivity live
| Price | -10% $7 | -5% $-45 | +0% $-97 | +5% $-149 | +10% $-201 |
|---|---|---|---|---|---|
| Rent | -10% $-191 | -5% $-144 | +0% $-97 | +5% $-50 | +10% $-3 |
| Rate | -1.0pp $-21 | -0.5pp $-59 | base $-97 | +0.5pp $-136 | +1.0pp $-175 |
UW: 25.0% down · 7.5% · 30yr · 1.5% tax · 5.0% vac · 8.0% maint · 8.0% mgmt
Financing live
Cash to close
- Down payment
- $37,500
- Closing costs
- $4,500
- Reserves months
- —
- Total cash needed
- —
Loan-product check · same deal, 3 products live
Conventional
25% down · 7.5% · 30yr
- Down + closing
- —
- Monthly P&I
- —
- Monthly cashflow
- —
- DSCR
- —
- Eligible?
- —
Personal DTI + credit; lowest rate.
DSCR
20% down · 8.5% · 30yr
- Down + closing
- —
- Monthly P&I
- —
- Monthly cashflow
- —
- DSCR
- —
- Eligible?
- —
No personal income docs; deal must DSCR.
Hard money
10% down · 12.0% · 12mo
- Down + closing
- —
- Monthly P&I
- —
- Monthly cashflow
- —
- DSCR
- —
- Eligible?
- —
Short-term bridge; refi at stabilization.
Listing history 11 events
-
2026-06-12statusdays on market $150,000 Pending 21 DOM
-
2026-06-09days on market $150,000 Active Under Contract 19 DOM
-
2026-06-08days on market $150,000 Active Under Contract 18 DOM
-
2026-06-08days on market $150,000 Active Under Contract 17 DOM
-
2026-06-05days on market $150,000 Active Under Contract 15 DOM
-
2026-06-03days on market $150,000 Active Under Contract 13 DOM
-
2026-06-02days on market $150,000 Active Under Contract 12 DOM
-
2026-06-02status $150,000 Active Under Contract 11 DOM
-
2026-06-01days on market $150,000 Active 11 DOM
-
2026-05-31days on market $150,000 Active 10 DOM
-
2026-05-21$150,000 Active
ⓘ Source: listings_history table (triggers on properties + properties_extension) + one-shot
backfill from property_details.listing_events for pre-trigger history.
Climate risk First Street
- Flood 1/10 Low 0% chance over 30 yrs
- Wildfire 8/10 Severe
- Heat 5/10 Major 7 d/yr ≥98°F today · 18 d/yr by 30 yrs out
- Wind 2/10 Low
- Air quality 2/10 Low 2 unhealthy d/yr today · 2 by 30 yrs out
Nearby sold comps map
Loading sold comps map…
Walkable amenities ~0.75 mi
Loading nearby amenities…
Taxation est. · year 1
- Rental income
- $14,274
- − Mortgage interest
- −$8,402
- − Property taxes
- −$2,250
- − Insurance
- −$750
- − Repairs & maintenance
- −$1,142
- − Management
- −$1,142
- − Depreciation
- −$4,364
- Taxable loss
- −$3,776
- Est. tax savings @ 24.0%
- +$906
- After-tax cash flow
- $-257/yr
For passive investors: Depreciation is non-cash, so a rental often shows a tax loss while cash-flowing — sheltering income. Rental losses are passive: they offset passive income freely, and up to $25,000/yr can offset ordinary (W-2) income if you actively participate and your MAGI is under $100k (phasing out to $0 by $150k); unused losses carry forward. On sale, claimed depreciation is recaptured at up to 25%, and gains may owe capital-gains tax (a 1031 exchange can defer both). Figures are a year-1 estimate at your 24.0% rate — not tax advice; consult a CPA.
Schools (NCES district)
- District
- Channing ISD
- NCES district ID
- 4813620
- Math proficiency
- 40% ▼ -5.00%
- Reading proficiency
- 40% ▲ 5.00%
- Median HH income
- $48,716
- Composite
- 36.8/100
- National rank
- #9178
- State rank
- #705 of 1141 in TX
Livability — Channing
- Score
- 62/100
- State rank
- #927
- US rank
- #16476
Category grades
Schools grade is shown separately in the Schools card above.
Census & demographics
- Census place
- Channing, TX
- Population (ZIP)
- 405
Population outlook (Hartley County) Hauer SSP2
- Today (2025)
- 5,822 people
- By 2030
- 5,933 · +1.9%
- By 2040
- 6,234 · +7.1%
- By 2050
- 6,356 · +9.2%
- By 2075
- 6,709 · +15.2%
- By 2100
- 6,729 · +15.6%
Race, ethnicity, and origin ACS 2023
- Neighborhood character
- Predominantly White (80%)
- Race & ethnicity
- White 80% Hispanic / Latino 18% Two or more races 5%
- Hispanic origin (detail)
- Mexican 16%
- Common ancestry
- Slovak 3% Lithuanian 3% Italian 1%
- Foreign-born
- 6% · Canada
- Languages at home
- 91% English-only · Spanish 5% Other Indo-European 4%
Political lean MEDSL · Hartley
- 2024 margin
- Solid R (+83.3) · D 8.1% · R 91.4%
- 2008→2024 swing
- -9.7pp toward R · 2008: -73.6pp · 2024: -83.3pp
- All cycles
- 2024: R+83.3 2020: R+80.5 2016: R+80.0 2012: R+79.7 2008: R+73.6
Not yet ingested
- Civics
- —
Market trends
- HPI YoY
- ▲ 5.00%
- Current HPI
- 103.1946
- Rent YoY
- —
- Metro
- —
- State GDP YoY
- ▲ 3.95%
- F500 in state
- 110
Industry mix (Fortune 500 HQ in TX)
| Industry | F500 HQs | Revenue |
|---|---|---|
| Energy | 16 | $1,198B |
|
||
| Technology | 5 | $198B |
|
||
| Engineering / Construction | 4 | $72B |
|
||
| Energy Services | 3 | $60B |
|
||
| Utilities | 3 | $41B |
|
||
| Healthcare | 2 | $330B |
|
||
Price history
1 event — show timeline
- 2026-05-21 Listed $150,000 AARMLS
Cash-flow waterfall
monthlySold comps — $/sqft
last 12 mo · ≤1 miLoading sold comps…