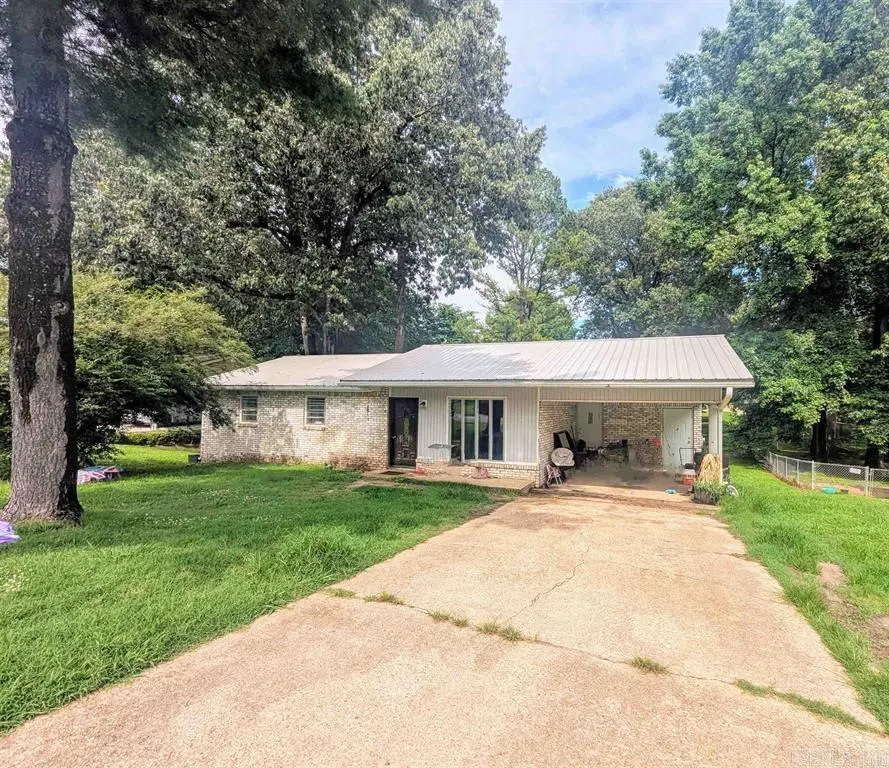
363 Lee Ave · Piggott, AR
Flood risk 5/10 · Moderate
- FEMA flood zone
- X (unshaded)
- Chance of flooding over 30 yrs
- 0.24%
- Est. flood insurance / yr
- $507 – $1,088
Fire risk 3/10 · Minor
- Est. fire insurance / yr
- $1,499 – $2,785
Heat risk 5/10 · Moderate
- Hot days now (above 109°F)
- 7 days/yr
- Hot days in 30 yrs
- 20 days/yr
Wind risk 3/10 · Minor
- Chance of severe wind over 30 yrs
- 6.0%
Air-quality risk 2/10 · Minimal
- Unhealthy air days now
- 0 days/yr
- Unhealthy air days in 30 yrs
- 1 days/yr
Risk factors via First Street. Map © Google.
Why this score? — see what drove the C+ grade
The composite is a weighted blend of 9 inputs, each scored 0–100. Each bar is that input's sub-score; the figure is the points it added to the 100-point composite (weight × sub-score).
- Cash flow +17.8/30.0
- ARV discount +11.5/15.0
- Appreciation +10.0/10.0
- DSCR +5.6/10.0
- 1% rule +4.2/10.0
- Livability +3.5/5.0
- Rent growth +2.5/5.0
- Schools +2.5/10.0
- Condition / age +2.5/5.0
$99,000
🖨 Deal sheet (PDF) 📄 Offer letter ✓ Due diligence
Listing remarks MLS
Take a look at this cozy brick home in a great location, just walking distance to the park! This home offers a low-maintenance metal roof, spacious yard and carport for covered parking. A cute home that needs a little TLC to make it your own.
Key facts
- Spacious yard
- Carport
- Brick home
Tags
Neighborhood map
What this means for you Summary
Snapshot
- This is a 3-bed/1.0-bath single-family listed at $99k.
Deal economics
- At list price, monthly cash flow is $82 ($986/yr) — positive.
- The deal already cash-flows at list — no discount required.
- To meet the 1% rule (rent ≥ 1% of price), the offer needs to be $91k (8.3% below list).
- Recommended offer: $90k (9.0% below list) — sets the bar for market timing.
- Cap rate 7.3% vs local median 4.3% in Piggott — top-decile yield for the area; either an underpriced asset or a hidden risk that comps aren't pricing in. Stress-test before assuming the spread holds.
Location & tenants
- Location reads 70/100 on livability (#50 in AR) — a middle-class / working-renter tenant base. Strengths: crime A+, cost of living A+, housing A+; Watch: amenities F, commute F, employment F.
- Piggott School District (town): math 32% / reading 28% proficiency, ranked #157 of 238 in AR (top 66%) — families likely to look elsewhere, expect single-tenant / working-renter base with shorter leases.
- Zoned schools: Piggott Elementary School (math 42% / reading 30%, grade F, #248 of 454 statewide, top 55%, 488 students, 65% FRL); Piggott High School (math 22% / reading 26%, grade F, #206 of 292 statewide, top 71%, 361 students, 49% FRL).
- Market conditions: 71 active listings in the ZIP; 4 units permitted in Clay County in 2024 (0 in 5+ unit buildings).
Forward outlook
- In year one you build about $11k of equity ($684 loan paydown + $10k appreciation (10.0% local appreciation)).
- Clay County population projected at -24% by 2050 — secular population decline; favor cash flow + early exit over multi-decade hold.
- At projected returns (10.0% appreciation + 3.0% rent growth), your $28k cash investment doubles in ~3 years — after that, you're playing with house money.
- By year 4, paydown + projected appreciation supports a ~$38k cash-out refi (75% LTV) — recoverable capital for the next deal without selling this one.
Negotiation context
- It's been on market 108 days — a 9% lower offer ($90k) is reasonable based on typical stale-listing flexibility.
- 2 sale attempts; this cycle's ask has dropped $21k (18%) from the opening price — seller is motivated, your offer sets the floor, not the list.
Risks & watch-outs
- Climate carrying-cost: moderate flood risk; extreme-heat days projected 7→20/yr by 2055 (HVAC capex compounding) — expect insurance premiums to compound above CPI over the hold.
Questions for the listing agent
- It's been on market 108 days. Have you received any prior offers? Is the seller open to a 9% concession, seller financing, or rate buy-down credit?
- Why hasn't it sold? Are there any deal-killer items the seller is aware of (foundation, flood, title, zoning, code violations)?
- Is there a deadline driving the sale (1031 exchange, divorce, estate, relocation)? That informs how much negotiation room exists.
- Schools are F-rated, which usually means shorter tenancies and higher turnover. Who's the typical renter profile here, and what's been the actual vacancy rate?
- What's the average days-on-market for RENTAL listings here right now (not sales)? A rising rental-DOM trend means longer vacancies and softer asking-rent achievability than the comps imply.
- What's the recent tenant-quality profile in this submarket — average credit score on applications, eviction rate, late-payment / NSF rate, and stable-employment percentage? A property-management company in the area should have these aggregated.
- How much new for-sale + rental construction is in the pipeline within 1–3 miles? Heavy new supply typically softens prices + rents 12–24 months out; constrained supply supports both.
Investment metrics
- 1% rule
- 0.92% ✗
- Cap rate
- 7.29%
- Cash-on-cash
- 3.56%
- DSCR
- 1.16
- GRM
- 9.1
CMA / ARV
- ARV (median comp)
- $108,727
- List price
- $99,000
- Delta
- -8.95%
- Verdict
- FAIR
- Comps
- 20 within 1.0 mi
Show comp detail 11 sales within ~0.75 mi
| Address | Dist | Beds/Ba | Sqft | Sold | Price | $/sf | Match |
|---|---|---|---|---|---|---|---|
| 435 Ann Ave | 0.08mi | 3/2.5 | 1,101 (+1%) | 10mo | $168,000 | $153 | 80 |
| 470 Lee Ave | 0.07mi | 3/1.0 | 1,136 (+4%) | 19mo | $110,000 | $97 | 74 |
| 530 Lee Ave | 0.10mi | 3/1.0 | 1,208 (+11%) | 12mo | $127,500 | $106 | 67 |
| 165 S 12th St | 0.46mi | 3/1.0 | 1,092 (+0%) | 16mo | $112,000 | $103 | 65 |
| 344 S 10th Ave | 0.62mi | 3/1.0 | 1,136 (+4%) | 2mo | $119,000 | $105 | 62 |
| 215 Mayo | 0.24mi | 3/2.0 | 1,168 (+7%) | 17mo | $32,500 | $28 | 58 |
| 2447 Heritage Park Rd | 0.35mi | 2/1.0 (-1) | 1,028 (-6%) | 19mo | $89,000 | $87 | 54 |
| 378 Lamb Dr | 0.72mi | 3/1.0 | 1,131 (+4%) | 8mo | $135,000 | $119 | 53 |
| 1344 Wallain Dr | 0.56mi | 3/1.0 | 1,232 (+13%) | 1mo | $75,000 | $61 | 51 |
| 763 W Court St | 0.73mi | 2/1.0 (-1) | 956 (-12%) | 7mo | $24,000 | $25 | 35 |
| 787 W Main St | 0.70mi | 2/2.0 (-1) | 1,236 (+14%) | 6mo | $95,000 | $77 | 31 |
Match score weights: distance 35% · size 25% · config 20% · recency 20%. Top-matched comps best support the ARV.
Projected returns pro-forma
10.0% appreciation · 3.0% rent growth · sell at horizon
- IRR
- 26.8%
- Equity multiple
- 3.13×
- Total profit
- $59,134
- Equity at exit
- $89,187
- IRR
- 23.5%
- Equity multiple
- 7.13×
- Total profit
- $169,992
- Equity at exit
- $192,335
Cash invested: $27,720 (down + closing). Projections, not guarantees.
Landlord ↔ Tenant lean methodology
- Overall (STATE)
- 92 Strongly Landlord-Friendly
- State Arkansas
- 92 Strongly Landlord-Friendly · R+14
- County
- — inherits STATE
- City
- — inherits STATE
ZIP-level market 72454
- Home prices YoY
- 3.4%
- Active inventory
- 71
- Price-to-rent
- 9.1×
Monthly cashflow live
- Estimated rent
- $908 medium interval (Pro) →
- Mortgage (P&I)
- −$519
- Tax from tax record
- −$75 /mo · $899/yr
- Insurance
- −$41
- HOA
- −$0
- Vacancy / Maint / Mgmt
- −$191
- Net cashflow
- $82
Break-even live
Sensitivity live
| Price | -10% $138 | -5% $110 | +0% $82 | +5% $54 | +10% $26 |
|---|---|---|---|---|---|
| Rent | -10% $10 | -5% $46 | +0% $82 | +5% $118 | +10% $154 |
| Rate | -1.0pp $132 | -0.5pp $107 | base $82 | +0.5pp $56 | +1.0pp $30 |
UW: 25.0% down · 7.5% · 30yr · 1.5% tax · 5.0% vac · 8.0% maint · 8.0% mgmt
Financing live
Cash to close
- Down payment
- $24,750
- Closing costs
- $2,970
- Reserves months
- —
- Total cash needed
- —
Loan-product check · same deal, 3 products live
Conventional
25% down · 7.5% · 30yr
- Down + closing
- —
- Monthly P&I
- —
- Monthly cashflow
- —
- DSCR
- —
- Eligible?
- —
Personal DTI + credit; lowest rate.
DSCR
20% down · 8.5% · 30yr
- Down + closing
- —
- Monthly P&I
- —
- Monthly cashflow
- —
- DSCR
- —
- Eligible?
- —
No personal income docs; deal must DSCR.
Hard money
10% down · 12.0% · 12mo
- Down + closing
- —
- Monthly P&I
- —
- Monthly cashflow
- —
- DSCR
- —
- Eligible?
- —
Short-term bridge; refi at stabilization.
Listing history 27 events
-
2026-06-22days on market $99,000 Active 108 DOM
-
2026-06-21days on market $99,000 Active 107 DOM
-
2026-06-19days on market $99,000 Active 105 DOM
-
2026-06-18days on market $99,000 Active 104 DOM
-
2026-06-17days on market $99,000 Active 103 DOM
-
2026-06-16days on market $99,000 Active 102 DOM
-
2026-06-15days on market $99,000 Active 101 DOM
-
2026-06-14days on market $99,000 Active 99 DOM
-
2026-06-12days on market $99,000 Active 98 DOM
-
2026-06-09days on market $99,000 Active 95 DOM
-
2026-06-08days on market $99,000 Active 94 DOM
-
2026-06-07days on market $99,000 Active 93 DOM
-
2026-06-05days on market $99,000 Active 91 DOM
-
2026-06-04days on market $99,000 Active 89 DOM
-
2026-06-02days on market $99,000 Active 88 DOM
-
2026-06-01days on market $99,000 Active 87 DOM
-
2026-05-31days on market $99,000 Active 86 DOM
-
2026-05-31days on market $99,000 Active 85 DOM
-
2026-04-27price $99,000 243-char remark
Show marketing remark (243 chars)
Take a look at this cozy brick home in a great location, just walking distance to the park! This home offers a low-maintenance metal roof, spacious yard and carport for covered parking. A cute home that needs a little TLC to make it your own.
-
2026-03-06$120,000 New Listing 243-char remark
Show marketing remark (243 chars)
Take a look at this cozy brick home in a great location, just walking distance to the park! This home offers a low-maintenance metal roof, spacious yard and carport for covered parking. A cute home that needs a little TLC to make it your own.
-
2026-02-13soldstatus $100,000 Sold 283-char remark
Show marketing remark (283 chars)
Take a look at this adorable brick home in a great location, just walking distance to the park! This home offers a low-maintenance metal roof, spacious yard and carport for covered parking. A cute home that's also affordable, you'll want to set up a time to come see this one today!
-
2025-11-17status Pending (FC, SS, REO) 283-char remark
Show marketing remark (283 chars)
Take a look at this adorable brick home in a great location, just walking distance to the park! This home offers a low-maintenance metal roof, spacious yard and carport for covered parking. A cute home that's also affordable, you'll want to set up a time to come see this one today!
-
2025-11-04price $129,900 283-char remark
Show marketing remark (283 chars)
Take a look at this adorable brick home in a great location, just walking distance to the park! This home offers a low-maintenance metal roof, spacious yard and carport for covered parking. A cute home that's also affordable, you'll want to set up a time to come see this one today!
-
2025-07-05$140,000 New Listing 283-char remark
Show marketing remark (283 chars)
Take a look at this adorable brick home in a great location, just walking distance to the park! This home offers a low-maintenance metal roof, spacious yard and carport for covered parking. A cute home that's also affordable, you'll want to set up a time to come see this one today!
-
2024-11-05soldstatus $208,000
-
2014-06-24soldstatus $22,000
-
1992-02-24soldstatus $30,500
ⓘ Source: listings_history table (triggers on properties + properties_extension) + one-shot
backfill from property_details.listing_events for pre-trigger history.
Tax reassessment forecast AR · Resets to sale price
- Current annual tax
- $899 · $75/mo
- Projected year-2 tax
- $899 · $75/mo
- Expected delta
- $0/yr ($0/mo · 0.0%)
ⓘ Screening estimate from a state-policy table — verify with the county assessor before closing.
Climate risk First Street
- Flood 5/10 Major FEMA zone X (unshaded) · 24% chance over 30 yrs
- Wildfire 3/10 Moderate
- Heat 5/10 Major 7 d/yr ≥109°F today · 20 d/yr by 30 yrs out
- Wind 3/10 Moderate 6% chance of damaging wind over 30 yrs
- Air quality 2/10 Low 0 unhealthy d/yr today · 1 by 30 yrs out
Nearby sold comps map
Loading sold comps map…
Walkable amenities ~0.75 mi
Loading nearby amenities…
Taxation est. · year 1
- Rental income
- $10,899
- − Mortgage interest
- −$5,546
- − Property taxes
- −$899
- − Insurance
- −$495
- − Repairs & maintenance
- −$872
- − Management
- −$872
- − Depreciation
- −$2,880
- Taxable loss
- −$665
- Est. tax savings @ 24.0%
- +$160
- After-tax cash flow
- $1,145/yr
For passive investors: Depreciation is non-cash, so a rental often shows a tax loss while cash-flowing — sheltering income. Rental losses are passive: they offset passive income freely, and up to $25,000/yr can offset ordinary (W-2) income if you actively participate and your MAGI is under $100k (phasing out to $0 by $150k); unused losses carry forward. On sale, claimed depreciation is recaptured at up to 25%, and gains may owe capital-gains tax (a 1031 exchange can defer both). Figures are a year-1 estimate at your 24.0% rate — not tax advice; consult a CPA.
Schools (NCES district)
- District
- Piggott School District
- NCES district ID
- 0511370
- Math proficiency
- 32% ▼ -15.00%
- Reading proficiency
- 28% ▼ -10.00%
- Median HH income
- $33,336
- Composite
- 24.63/100
- National rank
- #7628
- State rank
- #157 of 238 in AR
Livability — Piggott
- Score
- 70/100
- State rank
- #50
- US rank
- #7358
Category grades
Schools grade is shown separately in the Schools card above.
Census & demographics
- Census place
- Piggott, AR
- Population (ZIP)
- 4,699
Population outlook (Clay County) Hauer SSP2
- Today (2025)
- 13,564 people
- By 2030
- 12,834 · -5.4%
- By 2040
- 11,498 · -15.2%
- By 2050
- 10,325 · -23.9%
- By 2075
- 8,228 · -39.3%
- By 2100
- 6,675 · -50.8%
Race, ethnicity, and origin ACS 2023
- Neighborhood character
- Predominantly White (94%)
- Race & ethnicity
- White 94% Two or more races 5% Hispanic / Latino 2%
- Common ancestry
- Slovak 1% Serbian 1% Italian 1%
- Foreign-born
- 1%
- Languages at home
- 99% English-only · German/W. Germanic 1%
Political lean MEDSL · Clay
- 2024 margin
- Solid R (+61.6) · D 18.3% · R 79.9% · Other 1.9%
- 2008→2024 swing
- -47.3pp toward R · 2008: -14.3pp · 2024: -61.6pp
- All cycles
- 2024: R+61.6 2020: R+60.3 2016: R+29.8 2012: R+29.1 2008: R+14.3
Not yet ingested
- Civics
- —
Market trends
- HPI YoY
- ▲ 11.57%
- Current HPI
- 355.7877
- Rent YoY
- —
- Metro
- —
- State GDP YoY
- ▲ 3.80%
- F500 in state
- 10
Industry mix (Fortune 500 HQ in AR)
| Industry | F500 HQs | Revenue |
|---|---|---|
| Retail | 1 | $681B |
|
||
| Food / Agriculture | 1 | $53B |
|
||
| Retail / Energy | 1 | $22B |
|
||
| Transportation / Logistics | 1 | $12B |
|
||
| Energy | 1 | $4B |
|
||
Price history
+224.6% since first listed9 events — show timeline
- 2026-04-27 Price Changed $99,000 CARMLS
- 2026-03-06 Listed $120,000 CARMLS
- 2026-02-13 Sold (MLS) $100,000 CARMLS
- 2025-11-17 Pending — CARMLS
- 2025-11-04 Price Changed $129,900 CARMLS
- 2025-07-05 Listed $140,000 CARMLS
- 2024-11-05 Sold (Public Records) $208,000 Public Records
- 2014-06-24 Sold (Public Records) $22,000 Public Records
- 1992-02-24 Sold (Public Records) $30,500 Public Records
Property tax history
+4.7%/yrLatest (2025): $899 · +62.8% YoY. Source: county tax records.
Cash-flow waterfall
monthlySold comps — $/sqft
last 12 mo · ≤1 miLoading sold comps…