 🏷️ Likely Rental
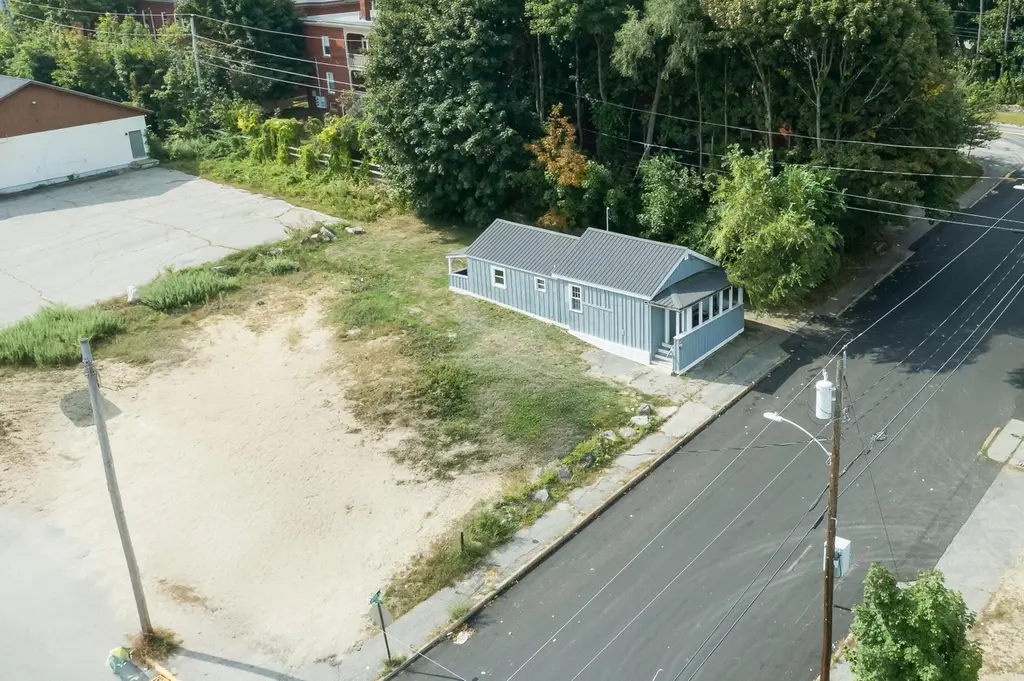
49 Oxford Ave · Rumford, ME
Flood risk 1/10 · Minimal
- FEMA flood zone
- X (unshaded)
- Chance of flooding over 30 yrs
- 0.0%
- Est. flood insurance / yr
- $507 – $1,088
Fire risk 1/10 · Minimal
- Est. fire insurance / yr
- $669 – $1,243
Heat risk 3/10 · Minor
- Hot days now (above 90°F)
- 8 days/yr
- Hot days in 30 yrs
- 19 days/yr
Wind risk 3/10 · Minor
- Chance of severe wind over 30 yrs
- 6.0%
Air-quality risk 2/10 · Minimal
- Unhealthy air days now
- 1 days/yr
- Unhealthy air days in 30 yrs
- 1 days/yr
Risk factors via First Street. Map © Google.
Why this score? — see what drove the A- grade
The composite is a weighted blend of 9 inputs, each scored 0–100. Each bar is that input's sub-score; the figure is the points it added to the 100-point composite (weight × sub-score).
- Cash flow +27.3/30.0
- ARV discount +15.0/15.0
- Appreciation +10.0/10.0
- DSCR +9.5/10.0
- 1% rule +6.6/10.0
- Schools +6.3/10.0
- Livability +3.8/5.0
- Rent growth +2.5/5.0
- Condition / age +2.2/5.0
$100,000
🖨 Deal sheet (PDF) 📄 Offer letter ✓ Due diligence
Listing remarks MLS
This two-bedroom, one-bath ranch offers an excellent opportunity for investors or first-time buyers looking for built-in cash flow. The property is currently tenant-occupied with reliable rental income, making it a hassle-free addition to any portfolio.
Key facts
- 3,484 sq ft lot
- Parking
- Built 1961
Neighborhood map
What this means for you Summary
Snapshot
- This is a 2-bed/1.0-bath single-family listed at $100k. Condition is rated fair.
Deal economics
- At list price, monthly cash flow is $288 ($3k/yr) — positive.
- The deal already cash-flows at list — no discount required.
- Meets the 1% rule at list price ($1k rent vs $100k).
- Recommended offer: $91k (9.0% below list) — sets the bar for market timing.
- Cap rate 9.8% vs local median 6.0% in Rumford — top-decile yield for the area; either an underpriced asset or a hidden risk that comps aren't pricing in. Stress-test before assuming the spread holds.
Location & tenants
- Location reads 75/100 on livability (#39 in ME, #4,030 nationally) — a middle-class / working-renter tenant base. Strengths: cost of living A+, housing A+, health & safety A+; Watch: commute D, amenities F, employment F.
- RSU 10 (rural): math 72% / reading 79% proficiency, ranked #107 of 112 in ME (top 96%) — strong family-tenant draw, lease renewals of 3-5y typical.
- Zoned schools: Rumford Elementary (math 62% / reading 67%, grade B, #279 of 294 statewide, top 95%, 261 students, 72% FRL); Mountain Valley Middle School (math 69% / reading 78%, grade A, #79 of 85 statewide, top 95%, 354 students, 76% FRL); Mountain Valley High School (math 74% / reading 84%, grade A-, #99 of 108 statewide, top 95%, 388 students, 71% FRL).
- Market conditions: 82 active listings in the ZIP; 2 comparable units currently listed for rent nearby; 329 units permitted in Oxford County in 2024 (0 in 5+ unit buildings).
Forward outlook
- In year one you build about $11k of equity ($691 loan paydown + $10k appreciation (10.0% local appreciation)).
- Oxford County population projected at -21% by 2050 — secular population decline; favor cash flow + early exit over multi-decade hold.
- At projected returns (10.0% appreciation + 3.0% rent growth), your $28k cash investment doubles in ~2 years — after that, you're playing with house money.
- By year 4, paydown + projected appreciation supports a ~$38k cash-out refi (75% LTV) — recoverable capital for the next deal without selling this one.
Negotiation context
- It's been on market 117 days — a 9% lower offer ($91k) is reasonable based on typical stale-listing flexibility.
Questions for the listing agent
- It's been on market 117 days. Have you received any prior offers? Is the seller open to a 9% concession, seller financing, or rate buy-down credit?
- Have any recent inspections been done? Can we get a copy of the seller's disclosures and any deferred-maintenance estimates?
- Built in 1961 — when were the roof, HVAC, electrical panel, plumbing, and water heater last replaced?
- Why hasn't it sold? Are there any deal-killer items the seller is aware of (foundation, flood, title, zoning, code violations)?
- Is there a deadline driving the sale (1031 exchange, divorce, estate, relocation)? That informs how much negotiation room exists.
- Schools are F-rated, which usually means shorter tenancies and higher turnover. Who's the typical renter profile here, and what's been the actual vacancy rate?
- What's the average days-on-market for RENTAL listings here right now (not sales)? A rising rental-DOM trend means longer vacancies and softer asking-rent achievability than the comps imply.
- What's the recent tenant-quality profile in this submarket — average credit score on applications, eviction rate, late-payment / NSF rate, and stable-employment percentage? A property-management company in the area should have these aggregated.
- How much new for-sale + rental construction is in the pipeline within 1–3 miles? Heavy new supply typically softens prices + rents 12–24 months out; constrained supply supports both.
Investment metrics
- 1% rule
- 1.16% ✓
- Cap rate
- 9.75%
- Cash-on-cash
- 12.36%
- DSCR
- 1.55
- GRM
- 7.2
CMA / ARV
- ARV (median comp)
- $129,974
- List price
- $100,000
- Delta
- -23.06%
- Verdict
- UNDERPRICED
- Comps
- 14 within 1.0 mi
Show comp detail 2 sales within ~0.75 mi
| Address | Dist | Beds/Ba | Sqft | Sold | Price | $/sf | Match |
|---|---|---|---|---|---|---|---|
| 229 Pine St | 0.38mi | 3/1.0 (+1) | 720 (+9%) | 4mo | $19,500 | $27 | 59 |
| 13 Holman Ave | 0.42mi | 3/1.0 (+1) | 625 (-6%) | 24mo | $10,000 | $16 | 46 |
Match score weights: distance 35% · size 25% · config 20% · recency 20%. Top-matched comps best support the ARV.
Projected returns pro-forma
10.0% appreciation · 3.0% rent growth · sell at horizon
- IRR
- 33.4%
- Equity multiple
- 3.60×
- Total profit
- $72,805
- Equity at exit
- $90,088
- IRR
- 28.8%
- Equity multiple
- 8.14×
- Total profit
- $199,909
- Equity at exit
- $194,278
Cash invested: $28,000 (down + closing). Projections, not guarantees.
Landlord ↔ Tenant lean methodology
- Overall (STATE)
- 41 Moderately Tenant-Leaning
- State Maine
- 41 Moderately Tenant-Leaning · D+2
- County
- — inherits STATE
- City
- — inherits STATE
ZIP-level market 04276
- Home prices YoY
- 4.4%
- Active inventory
- 82
- Price-to-rent
- 7.2×
Monthly cashflow live
- Estimated rent
- $1,156 medium interval (Pro) →
- Mortgage (P&I)
- −$524
- Tax from tax record
- −$59 /mo · $704/yr
- Insurance
- −$42
- HOA
- −$0
- Vacancy / Maint / Mgmt
- −$243
- Net cashflow
- $288
Break-even live
Sensitivity live
| Price | -10% $345 | -5% $317 | +0% $288 | +5% $260 | +10% $232 |
|---|---|---|---|---|---|
| Rent | -10% $197 | -5% $243 | +0% $288 | +5% $334 | +10% $380 |
| Rate | -1.0pp $339 | -0.5pp $314 | base $288 | +0.5pp $262 | +1.0pp $236 |
UW: 25.0% down · 7.5% · 30yr · 1.5% tax · 5.0% vac · 8.0% maint · 8.0% mgmt
Financing live
Cash to close
- Down payment
- $25,000
- Closing costs
- $3,000
- Reserves months
- —
- Total cash needed
- —
Loan-product check · same deal, 3 products live
Conventional
25% down · 7.5% · 30yr
- Down + closing
- —
- Monthly P&I
- —
- Monthly cashflow
- —
- DSCR
- —
- Eligible?
- —
Personal DTI + credit; lowest rate.
DSCR
20% down · 8.5% · 30yr
- Down + closing
- —
- Monthly P&I
- —
- Monthly cashflow
- —
- DSCR
- —
- Eligible?
- —
No personal income docs; deal must DSCR.
Hard money
10% down · 12.0% · 12mo
- Down + closing
- —
- Monthly P&I
- —
- Monthly cashflow
- —
- DSCR
- —
- Eligible?
- —
Short-term bridge; refi at stabilization.
Rent comps 2 comps
| Address | Beds | Baths | Sqft | Rent | $/sqft | DOM | Units | Dist |
|---|---|---|---|---|---|---|---|---|
| 25 Maine Ave Unit 3R Rumford, ME | 2.0 | 1.0 | 750 | $1,100 | $1.47 | 46d | 1 | 0.09mi |
| 119 Congress St Rumford, ME | 1.0 | 1.0 | 508 | $1,400 | $2.75 | 45d | 3 | 0.38mi |
Listing history 18 events
-
2026-06-21days on market $100,000 Active 117 DOM
-
2026-06-21days on market $100,000 Active 116 DOM
-
2026-06-18days on market $100,000 Active 114 DOM
-
2026-06-17days on market $100,000 Active 113 DOM
-
2026-06-16days on market $100,000 Active 112 DOM
-
2026-06-15days on market $100,000 Active 111 DOM
-
2026-06-13days on market $100,000 Active 109 DOM
-
2026-06-12days on market $100,000 Active 108 DOM
-
2026-06-09days on market $100,000 Active 105 DOM
-
2026-06-08days on market $100,000 Active 104 DOM
-
2026-06-07days on market $100,000 Active 103 DOM
-
2026-06-07days on market $100,000 Active 102 DOM
-
2026-06-04days on market $100,000 Active 99 DOM
-
2026-06-02days on market $100,000 Active 98 DOM
-
2026-06-01days on market $100,000 Active 97 DOM
-
2026-05-31days on market $100,000 Active 96 DOM
-
2026-05-31days on market $100,000 Active 95 DOM
-
2026-02-25$100,000 Active 253-char remark
Show marketing remark (253 chars)
This two-bedroom, one-bath ranch offers an excellent opportunity for investors or first-time buyers looking for built-in cash flow. The property is currently tenant-occupied with reliable rental income, making it a hassle-free addition to any portfolio.
ⓘ Source: listings_history table (triggers on properties + properties_extension) + one-shot
backfill from property_details.listing_events for pre-trigger history.
Tax reassessment forecast ME · Partial reset (capped growth)
- Current annual tax
- $704 · $59/mo
- Projected year-2 tax
- $1,032 · $86/mo
- Expected delta
- +$328/yr (+$27/mo · 46.6%)
ⓘ Screening estimate from a state-policy table — verify with the county assessor before closing.
Climate risk First Street
- Flood 1/10 Low FEMA zone X (unshaded) · 0% chance over 30 yrs
- Wildfire 1/10 Low
- Heat 3/10 Moderate 8 d/yr ≥90°F today · 19 d/yr by 30 yrs out
- Wind 3/10 Moderate 6% chance of damaging wind over 30 yrs
- Air quality 2/10 Low 1 unhealthy d/yr today · 1 by 30 yrs out
Nearby sold comps map
Loading sold comps map…
Walkable amenities ~0.75 mi
Loading nearby amenities…
Taxation est. · year 1
- Rental income
- $13,870
- − Mortgage interest
- −$5,602
- − Property taxes
- −$704
- − Insurance
- −$500
- − Repairs & maintenance
- −$1,110
- − Management
- −$1,110
- − Depreciation
- −$2,909
- Taxable income
- $1,936
- Est. tax owed @ 24.0%
- −$465
- After-tax cash flow
- $2,996/yr
For passive investors: Depreciation is non-cash, so a rental often shows a tax loss while cash-flowing — sheltering income. Rental losses are passive: they offset passive income freely, and up to $25,000/yr can offset ordinary (W-2) income if you actively participate and your MAGI is under $100k (phasing out to $0 by $150k); unused losses carry forward. On sale, claimed depreciation is recaptured at up to 25%, and gains may owe capital-gains tax (a 1031 exchange can defer both). Figures are a year-1 estimate at your 24.0% rate — not tax advice; consult a CPA.
Condition & rehab AI · 3 photos
This property requires moderate renovations, including exterior repairs and landscaping, to improve its resale and rental value.
Repairs flagged
- Major siding — Significant wear and tear
- Major landscaping — Overgrown vegetation
Value-add opportunities
- Both paint exterior — Enhances curb appeal and property value
- Both landscaping — Improves curb appeal and property value
- Both repair siding — Restores property value and enhances curb appeal
Renovation cost estimate screening
| Repair item | Severity | Est. cost |
|---|---|---|
| siding · Significant wear and tear | Major | $15,000–50,000 |
| landscaping · Overgrown vegetation | Major | $15,000–50,000 |
| Total estimated repair cost · 2 items | $30,000–100,000 |
Value-add ROI direction
- Both paint exterior — Enhances curb appeal and property value ↑
- Both landscaping — Improves curb appeal and property value ↑
- Both repair siding — Restores property value and enhances curb appeal ↑
ⓘ Cost ranges are severity-bucket heuristics (US national rule-of-thumb). Get contractor quotes + a written scope before underwriting a rehab budget.
Schools (NCES district)
- District
- RSU 10
- NCES district ID
- 2314795
- Math proficiency
- 72% ▲ 50.00%
- Reading proficiency
- 79% ▲ 34.00%
- Median HH income
- $37,647
- Composite
- 62.72/100
- National rank
- #671
- State rank
- #107 of 112 in ME
Livability — Rumford
- Score
- 75/100
- State rank
- #39
- US rank
- #4030
Category grades
Schools grade is shown separately in the Schools card above.
Census & demographics
- Census place
- Rumford, ME
- Population (ZIP)
- 5,918
Population outlook (Oxford County) Hauer SSP2
- Today (2025)
- 55,853 people
- By 2030
- 54,190 · -3.0%
- By 2040
- 49,484 · -11.4%
- By 2050
- 43,958 · -21.3%
- By 2075
- 32,308 · -42.2%
- By 2100
- 21,858 · -60.9%
Race, ethnicity, and origin ACS 2023
- Neighborhood character
- Predominantly White (94%)
- Race & ethnicity
- White 94% Two or more races 4%
- Common ancestry
- Lithuanian 27% Slovak 5% German 2%
- Foreign-born
- 1% · Canada
- Languages at home
- 98% English-only · French/Haitian/Cajun 1% Tagalog/Filipino 1%
Political lean MEDSL · Oxford
- 2024 margin
- R (+12.9) · D 42.7% · R 55.6% · Other 1.7%
- 2008→2024 swing
- -28.9pp toward R · 2008: 16.0pp · 2024: -12.9pp
- All cycles
- 2024: R+12.9 2020: R+8.8 2016: R+13.0 2012: D+14.9 2008: D+16.0
Not yet ingested
- Civics
- —
Market trends
- HPI YoY
- ▲ 12.73%
- Current HPI
- 301.2786
- Rent YoY
- —
- Metro
- —
- State GDP YoY
- —
- F500 in state
- 0
Price history
1 event — show timeline
- 2026-02-25 Listed $100,000 MREIS
Property tax history
+12.6%/yrLatest (2025): $704 · +12.6% YoY. Source: county tax records.
Cash-flow waterfall
monthlySold comps — $/sqft
last 12 mo · ≤1 miLoading sold comps…