 Multi-family
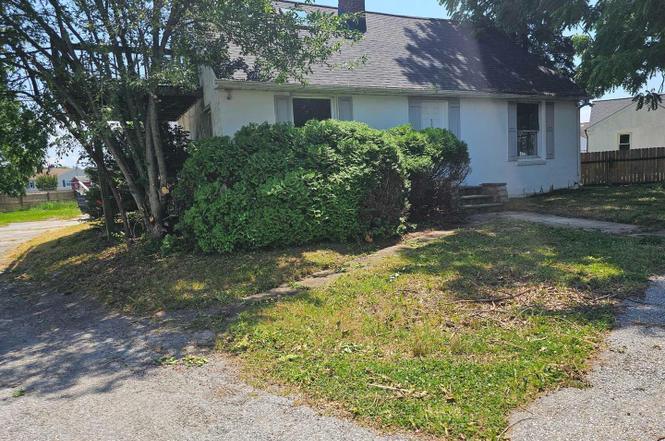
510 School Bell · Bear, DE
Flood risk 1/10 · Minimal
- FEMA flood zone
- X (unshaded)
- Chance of flooding over 30 yrs
- 0.0%
- Est. flood insurance / yr
- $507 – $1,088
Fire risk 1/10 · Minimal
- Est. fire insurance / yr
- $476 – $884
Heat risk 8/10 · Major
- Hot days now (above 102°F)
- 7 days/yr
- Hot days in 30 yrs
- 15 days/yr
Wind risk 6/10 · Moderate
- Chance of severe wind over 30 yrs
- 27.0%
Air-quality risk 3/10 · Minor
- Unhealthy air days now
- 2 days/yr
- Unhealthy air days in 30 yrs
- 3 days/yr
Risk factors via First Street. Map © Google.
Why this score? — see what drove the D grade
The composite is a weighted blend of 9 inputs, each scored 0–100. Each bar is that input's sub-score; the figure is the points it added to the 100-point composite (weight × sub-score).
- Cash flow +14.9/30.0
- ARV discount +7.5/15.0
- Rent growth +4.8/5.0
- DSCR +4.6/10.0
- Livability +3.7/5.0
- 1% rule +2.9/10.0
- Condition / age +2.5/5.0
- Schools +2.1/10.0
- Appreciation +0.0/10.0
$249,900
🖨 Deal sheet (PDF) 📄 Offer letter ✓ Due diligence
Multi-family units
County records classify this as Multi-Family (5+ Unit). Listing-text estimate: 1 unit. estimate disagrees with records
5+ unit building — per-unit beds/baths from public records are typically unavailable; the breakdown below (if shown) is an estimate from the listing text.
Listing remarks MLS
ATTENTION ALL INVESTORS OR OWNER OCCUPANT:Drastically Reduced!!! Commissions are subject to Bank Approval. Priced way below market value. So a qualified investor can do some creative financing and get into the property with very little cash. Some TLC needed to make this a great property. Great for possible Day Care or small in-home business. Being sold "As Is". Priced for quick sale.
Key facts
- 0.26 acre lot
- Built 1953
- Listed 5 days
Property features AI
Finance
- Other: Fee simple ownership; Not in a federal flood zone; Total finished above-grade area is estimated at 676; Below-grade area (unfinished) is estimated at 338
Exterior
- Parking: Paved driveway; Off-street parking
- Utilities: Public water; Public sewer
- Home design: Detached property; Estimated year built
- Construction: Slab foundation; Above-grade structure
- Exterior features: Stucco exterior; Other exterior features
Interior
- Kitchen: Single oven; Dishwasher
- Bedrooms: 2 bedrooms on the main level
- Bathrooms: 1 full bathroom on the main level
- Heating & cooling: 90% forced air heating (natural gas); Central air conditioning (natural gas)
- Interior features: Partial basement; Appliances include single oven and dishwasher
Neighborhood map
What this means for you Summary
Snapshot
- This is a 2-bed/1.0-bath multifamily listed at $250k.
Deal economics
- At list price, monthly cash flow is $73 ($876/yr) — positive.
- The deal already cash-flows at list — no discount required.
- To meet the 1% rule (rent ≥ 1% of price), the offer needs to be $197k (21.2% below list).
- Recommended offer: $197k (21.2% below list) — sets the bar for 1% rule.
- Cap rate 6.6% vs local median 4.7% in Bear — top-decile yield for the area; either an underpriced asset or a hidden risk that comps aren't pricing in. Stress-test before assuming the spread holds.
Location & tenants
- Location reads 73/100 on livability (#8 in DE) — a middle-class / working-renter tenant base. Strengths: housing A+, employment A-, cost of living A-; Watch: crime C-, amenities F, commute F.
- Colonial School District (suburban): math 15% / reading 30% proficiency, ranked #23 of 26 in DE (top 88%) — low school quality limits family demand, transient renter base, plan for 1-2y turnover.
- Zoned schools: Wilbur (Kathleen H.) Elementary (math 24% / reading 43%, grade F, #42 of 105 statewide, top 39%, 1,044 students, 0% FRL); Bedford (Gunning) Middle School (math 14% / reading 38%, grade F, #20 of 36 statewide, top 54%, 936 students, 0% FRL); Penn (William) High School (math 16% / reading 30%, grade F, #29 of 40 statewide, top 72%, 2,239 students, 0% FRL) — zoned schools average 0% FRL vs 53% district-wide (53 pts lower); this property's tenant base skews higher-income than the district average.
- Market conditions: Rents rising fast (+9.0%/yr); 112 active listings in the ZIP; 1 comparable units currently listed for rent nearby; high-income renter base; 1,367 units permitted in New Castle County in 2024 (201 in 5+ unit buildings).
Forward outlook
- Local home prices are declining (-3.0%/yr); year-one equity from $2k of loan paydown is wiped out by about $7k of value loss. Plan a longer hold.
- New Castle County population projected at +9% by 2050 — modest demand growth; plan on rents tracking national, not racing it.
Negotiation context
- Only 5 days on market — expect competitive offers; lowballing is unlikely to land.
- 7 sale attempts since 23y ago with the ask held roughly flat each time — persistent listings suggest the price (not the market) is what's stuck; bring a comps-based counter.
- Current owner paid $135k; list at $250k implies a 85% gain — meaningful room to come down on a strong offer.
Risks & watch-outs
- Watch-outs: built in 1953 — expect roof / HVAC / electrical / plumbing capex.
- Climate carrying-cost: major wind risk, 27% chance of damaging wind over 30y; extreme-heat days projected 7→15/yr by 2055 (HVAC capex compounding) — expect insurance premiums to compound above CPI over the hold.
Questions for the listing agent
- Built in 1953 — when were the roof, HVAC, electrical panel, plumbing, and water heater last replaced?
- Is there a deadline driving the sale (1031 exchange, divorce, estate, relocation)? That informs how much negotiation room exists.
- Schools are D-rated, which usually means shorter tenancies and higher turnover. Who's the typical renter profile here, and what's been the actual vacancy rate?
- The area grade is low — what's the realistic commute time and amenity access for the typical tenant pool here? Any planned neighborhood developments (good or bad) we should know about?
- What's the average days-on-market for RENTAL listings here right now (not sales)? A rising rental-DOM trend means longer vacancies and softer asking-rent achievability than the comps imply.
- What's the recent tenant-quality profile in this submarket — average credit score on applications, eviction rate, late-payment / NSF rate, and stable-employment percentage? A property-management company in the area should have these aggregated.
- How much new apartment / multifamily construction is in the pipeline within 1–3 miles? Heavy new supply (>2% of stock underway) typically softens rents 12–24 months out; light construction supports rent growth.
Investment metrics
- 1% rule
- 0.79% ✗
- Cap rate
- 6.64%
- Cash-on-cash
- 1.25%
- DSCR
- 1.06
- GRM
- 10.6
CMA / ARV
No comps found within radius.
Projected returns pro-forma
-3.0% appreciation · 8.0% rent growth · sell at horizon
- IRR
- -9.6%
- Equity multiple
- 0.63×
- Total profit
- $-25,561
- Equity at exit
- $37,261
- IRR
- 5.0%
- Equity multiple
- 1.44×
- Total profit
- $30,597
- Equity at exit
- $21,607
Cash invested: $69,972 (down + closing). Projections, not guarantees.
Landlord ↔ Tenant lean methodology
- Overall (STATE)
- 70 Landlord-Friendly
- State Delaware
- 70 Landlord-Friendly · D+7
- County
- — inherits STATE
- City
- — inherits STATE
ZIP-level market 19701
- Rents YoY
- 9.0%
- Active inventory
- 112
- Price-to-rent
- 10.6×
Monthly cashflow live
- Estimated rent
- $1,969 medium interval (Pro) →
- Mortgage (P&I)
- −$1,311
- Tax from tax record
- −$68 /mo · $814/yr
- Insurance
- −$104
- HOA
- −$0
- Vacancy / Maint / Mgmt
- −$413
- Net cashflow
- $73
Break-even live
Sensitivity live
| Price | -10% $214 | -5% $144 | +0% $73 | +5% $2 | +10% $-68 |
|---|---|---|---|---|---|
| Rent | -10% $-83 | -5% $-5 | +0% $73 | +5% $151 | +10% $229 |
| Rate | -1.0pp $199 | -0.5pp $137 | base $73 | +0.5pp $8 | +1.0pp $-58 |
UW: 25.0% down · 7.5% · 30yr · 1.5% tax · 5.0% vac · 8.0% maint · 8.0% mgmt
Financing live
Cash to close
- Down payment
- $62,475
- Closing costs
- $7,497
- Reserves months
- —
- Total cash needed
- —
Loan-product check · same deal, 3 products live
Conventional
25% down · 7.5% · 30yr
- Down + closing
- —
- Monthly P&I
- —
- Monthly cashflow
- —
- DSCR
- —
- Eligible?
- —
Personal DTI + credit; lowest rate.
DSCR
20% down · 8.5% · 30yr
- Down + closing
- —
- Monthly P&I
- —
- Monthly cashflow
- —
- DSCR
- —
- Eligible?
- —
No personal income docs; deal must DSCR.
Hard money
10% down · 12.0% · 12mo
- Down + closing
- —
- Monthly P&I
- —
- Monthly cashflow
- —
- DSCR
- —
- Eligible?
- —
Short-term bridge; refi at stabilization.
Rent comps 1 comps
| Address | Beds | Baths | Sqft | Rent | $/sqft | DOM | Units | Dist |
|---|---|---|---|---|---|---|---|---|
| 401 Bedford Ln New Castle, DE | 1.0–2.0 | 1.0–2.0 | 865 | $1,895 | $2.19 | 4d | 9 | 0.70mi |
Listing history 4 events
-
2026-06-21days on market $249,900 Active 5 DOM
-
2026-06-18days on market $249,900 Active 2 DOM
-
2026-06-16remarks 645-char remark
-
2026-06-16$249,900 Active 1 DOM
ⓘ Source: listings_history table (triggers on properties + properties_extension) + one-shot
backfill from property_details.listing_events for pre-trigger history.
Tax reassessment forecast DE · Partial reset (capped growth)
- Current annual tax
- $814 · $68/mo
- Projected year-2 tax
- $1,132 · $94/mo
- Expected delta
- +$318/yr (+$26/mo · 39.1%)
ⓘ Screening estimate from a state-policy table — verify with the county assessor before closing.
Climate risk First Street
- Flood 1/10 Low FEMA zone X (unshaded) · 0% chance over 30 yrs
- Wildfire 1/10 Low
- Heat 8/10 Severe 7 d/yr ≥102°F today · 15 d/yr by 30 yrs out
- Wind 6/10 Major 27% chance of damaging wind over 30 yrs
- Air quality 3/10 Moderate 2 unhealthy d/yr today · 3 by 30 yrs out
Nearby sold comps map
Loading sold comps map…
Walkable amenities ~0.75 mi
Loading nearby amenities…
Taxation est. · year 1
- Rental income
- $23,627
- − Mortgage interest
- −$13,998
- − Property taxes
- −$814
- − Insurance
- −$1,250
- − Repairs & maintenance
- −$1,890
- − Management
- −$1,890
- − Depreciation
- −$7,270
- Taxable loss
- −$3,485
- Est. tax savings @ 24.0%
- +$836
- After-tax cash flow
- $1,712/yr
For passive investors: Depreciation is non-cash, so a rental often shows a tax loss while cash-flowing — sheltering income. Rental losses are passive: they offset passive income freely, and up to $25,000/yr can offset ordinary (W-2) income if you actively participate and your MAGI is under $100k (phasing out to $0 by $150k); unused losses carry forward. On sale, claimed depreciation is recaptured at up to 25%, and gains may owe capital-gains tax (a 1031 exchange can defer both). Figures are a year-1 estimate at your 24.0% rate — not tax advice; consult a CPA.
Schools (NCES district)
- District
- Colonial School District
- NCES district ID
- 1000230
- Math proficiency
- 15% ▼ -10.00%
- Reading proficiency
- 30% ▼ -9.00%
- Median HH income
- $58,622
- Composite
- 20.75/100
- National rank
- #8517
- State rank
- #23 of 26 in DE
Livability — Bear
- Score
- 73/100
- State rank
- #8
- US rank
- #5158
Category grades
Schools grade is shown separately in the Schools card above.
Census & demographics
- County
- New Castle County · 483,412 people
- City population
- 42,984
- Metro
- Philadelphia-Camden-Wilmington, PA-NJ-DE-MD
- Population (ZIP)
- 42,984
- Household income
- $111,198
- Rent vs Own
- Severe rent burden
- 619.0
Population outlook (New Castle County) Hauer SSP2
- Today (2025)
- 594,686 people
- By 2030
- 609,164 · +2.4%
- By 2040
- 632,154 · +6.3%
- By 2050
- 649,068 · +9.1%
- By 2075
- 687,771 · +15.7%
- By 2100
- 694,961 · +16.9%
Race, ethnicity, and origin ACS 2023
- Neighborhood character
- Diverse neighborhood (Simpson 0.67)
- Race & ethnicity
- White 50% Black 26% Hispanic / Latino 11% Asian 10% Two or more races 7%
- Hispanic origin (detail)
- Mexican 4% Puerto Rican 4%
- Common ancestry
- Romanian 4% Lithuanian 2% Slovak 1%
- Foreign-born
- 17% · Canada, China, Vietnam
- Languages at home
- 78% English-only · Spanish 8% Other Asian/Pacific 3% Other Indo-European 3%
Political lean MEDSL · New Castle
- 2024 margin
- Solid D (+32.6) · D 65.5% · R 32.9% · Other 1.6%
- 2008→2024 swing
- -8.1pp toward R · 2008: 40.6pp · 2024: 32.6pp
- All cycles
- 2024: D+32.6 2020: D+37.1 2016: D+29.6 2012: D+34.1 2008: D+40.6
Not yet ingested
- Civics
- —
Market trends
- HPI YoY
- ▼ -159.00%
- Current HPI
- 261.2988
- Rent YoY
- ▲ 9.03%
- Metro
- Philadelphia-Camden-Wilmington, PA-NJ-DE-MD
- State GDP YoY
- —
- F500 in state
- 0
Price history
+233.2% since first listed17 events — show timeline
- 2026-06-16 Listed $249,900 BRIGHT MLS
- 2009-11-13 Sold (Public Records) $135,000 Public Records
- 2009-11-12 Sold (MLS) $135,000 BRIGHT MLS
- 2009-08-28 Listing Removed — BRIGHT MLS
- 2008-03-27 Listed $149,000 BRIGHT MLS
- 2008-03-21 Listing Removed — BRIGHT MLS
- 2007-03-21 Listed $179,900 BRIGHT MLS
- 2007-03-19 Listing Removed — BRIGHT MLS
- 2007-02-12 Listing Removed — BRIGHT MLS
- 2007-02-12 Listed $239,900 BRIGHT MLS
- 2006-03-19 Listed $239,900 BRIGHT MLS
- 2005-12-19 Listing Removed — BRIGHT MLS
- 2005-10-11 Listed $230,000 BRIGHT MLS
- 2004-09-11 Listing Removed — BRIGHT MLS
- 2003-09-12 Listed $245,000 BRIGHT MLS
- 2002-03-13 Sold (Public Records) $130,000 Public Records
- 1994-12-06 Sold (Public Records) $75,000 Public Records
Property tax history
+3.5%/yrLatest (2024): $814 · +10.3% YoY. Source: county tax records.
Cash-flow waterfall
monthlySold comps — $/sqft
last 12 mo · ≤1 miLoading sold comps…