 🔨 Auction
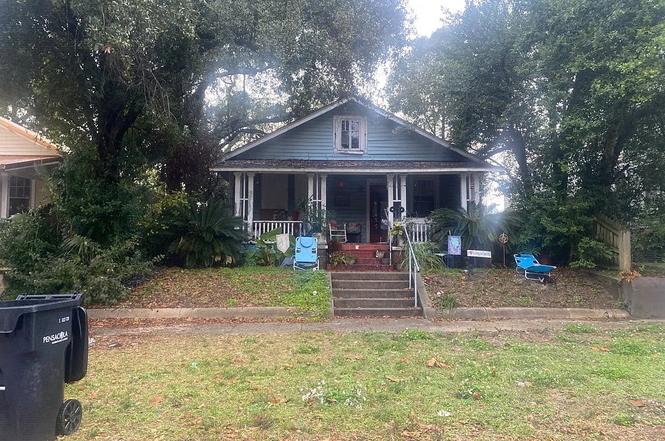
1004 E Jackson St · Pensacola, FL
Flood risk 1/10 · Minimal
- FEMA flood zone
- X (unshaded)
- Chance of flooding over 30 yrs
- 0.0%
- Est. flood insurance / yr
- $507 – $1,088
Fire risk 1/10 · Minimal
- Est. fire insurance / yr
- $947 – $1,759
Heat risk 10/10 · Severe
- Hot days now (above 105°F)
- 7 days/yr
- Hot days in 30 yrs
- 21 days/yr
Wind risk 9/10 · Severe
- Chance of severe wind over 30 yrs
- 99.0%
Air-quality risk 2/10 · Minimal
- Unhealthy air days now
- 0 days/yr
- Unhealthy air days in 30 yrs
- 1 days/yr
Risk factors via First Street. Map © Google.
Why this score? — see what drove the F grade
The composite is a weighted blend of 9 inputs, each scored 0–100. Each bar is that input's sub-score; the figure is the points it added to the 100-point composite (weight × sub-score).
- ARV discount +7.5/15.0
- Livability +4.2/5.0
- Rent growth +3.9/5.0
- Schools +3.6/10.0
- Cash flow +3.3/30.0
- Condition / age +2.5/5.0
- 1% rule +0.0/10.0
- DSCR +0.0/10.0
- Appreciation +0.0/10.0
$5,000
🖨 Deal sheet (PDF) 📄 Offer letter ✓ Due diligence
Listing remarks
Foreclosure Auction Ends June 19, 2026 at 12:00 PM EST. Discover this inviting 2-bedroom, 2-bathroom single-family home, offering a great opportunity in the desirable Pensacola area. The list price is the opening bid for the online auction. Sold As-is. Explore more details and submit your bid through Federa.
Key facts
- Built 1914
- Listed 8 days
Property features AI
Exterior
- Home design: Residential property
- Construction: Built on a 0.12-acre lot
- Exterior features: Zoned R-1AA
Interior
- Bathrooms: 2 full bathrooms
- Interior features: Single-story layout
Neighborhood map
What this means for you Summary
Snapshot
- This is a 2-bed/2.0-bath single-family listed at $5k.
Deal economics
- At list price, monthly cash flow is $-1k ($-16k/yr) — negative.
- The deal already cash-flows at list — no discount required.
- Meets the 1% rule at list price ($2k rent vs $5k).
- Cap rate 2.5% vs local median 3.6% in Pensacola — below-typical yield; the buyer is paying a premium for something (appreciation thesis, condition, location) that the cap rate doesn't capture.
Location & tenants
- Location reads 83/100 on livability (#53 in FL, #924 nationally) — a professional / high-income tenant draw. Strengths: commute A+, cost of living A+, housing A+.
- Escambia (suburban): math 40% / reading 45% proficiency, ranked #56 of 73 in FL (top 77%) — families likely to look elsewhere, expect single-tenant / working-renter base with shorter leases.
- Zoned schools: N. B. Cook Elementary School (math 80% / reading 75%, grade A, #163 of 2,144 statewide, top 8%, 514 students, 44% FRL); J. H. Workman Middle School (math 20% / reading 27%, grade F, #536 of 571 statewide, top 95%, 705 students, 72% FRL); Pensacola High School (math 29% / reading 50%, grade F, #304 of 667 statewide, top 47%, 1,229 students, 55% FRL) — zoned schools at 57% FRL track the district average.
- Market conditions: Rents rising fast (+5.4%/yr); 130 active listings in the ZIP; 23 comparable units currently listed for rent nearby; rentals at typical pace (median 25d on market — plan ~3-4 weeks tenant-placement turnaround); lower-income renter base — watch delinquency; 1,479 units permitted in Escambia County in 2024 (0 in 5+ unit buildings).
- At $2,035/mo this rent would consume 55% of the median local household income ($44k/yr) (locally 816% of renters already pay >50% of income on rent) — very limited rent-growth headroom before tenants either downsize or default.
Forward outlook
- Local home prices are declining (-3.0%/yr); year-one equity from $3k of loan paydown is wiped out by about $13k of value loss. Plan a longer hold.
- Escambia County population projected at +13% by 2050 — modest demand growth; plan on rents tracking national, not racing it.
Negotiation context
- Only 8 days on market — expect competitive offers; lowballing is unlikely to land.
Risks & watch-outs
- Watch-outs: property tax is 127.5% of price; built in 1914 — expect roof / HVAC / electrical / plumbing capex.
- Climate carrying-cost: severe wind risk, 99% chance of damaging wind over 30y; extreme-heat days projected 7→21/yr by 2055 (HVAC capex compounding) — expect insurance premiums to compound above CPI over the hold.
Questions for the listing agent
- What do current leases actually rent for vs. the listed asking? Can we see a recent rent roll and the last 12 months of T-12 income?
- Built in 1914 — when were the roof, HVAC, electrical panel, plumbing, and water heater last replaced?
- Property tax is high relative to price — has the assessment been appealed recently, and will the sale trigger a re-assessment?
- Is there a deadline driving the sale (1031 exchange, divorce, estate, relocation)? That informs how much negotiation room exists.
- The area grade is low — what's the realistic commute time and amenity access for the typical tenant pool here? Any planned neighborhood developments (good or bad) we should know about?
- What's the average days-on-market for RENTAL listings here right now (not sales)? A rising rental-DOM trend means longer vacancies and softer asking-rent achievability than the comps imply.
- What's the recent tenant-quality profile in this submarket — average credit score on applications, eviction rate, late-payment / NSF rate, and stable-employment percentage? A property-management company in the area should have these aggregated.
- How much new for-sale + rental construction is in the pipeline within 1–3 miles? Heavy new supply typically softens prices + rents 12–24 months out; constrained supply supports both.
Investment metrics
- 1% rule
- 0.48% ✗
- Cap rate
- 2.54%
- Cash-on-cash
- -13.41%
- DSCR
- 0.40
- GRM
- 17.4
CMA / ARV
- ARV (on-the-fly)
- $425,152
- Comps found
- 12
Show comp detail 12 sales within ~0.75 mi
| Address | Dist | Beds/Ba | Sqft | Sold | Price | $/sf | Match |
|---|---|---|---|---|---|---|---|
| 913 N 8th Ave | 0.30mi | 3/1.0 (+1) | 1,473 (+1%) | 5mo | $170,124 | $115 | 71 |
| 1109 E Gonzalez St | 0.31mi | 3/3.0 (+1) | 1,500 (+3%) | 2mo | $507,500 | $338 | 70 |
| 1212 N 6th Ave | 0.50mi | 3/2.0 (+1) | 1,477 (+1%) | 1mo | $409,900 | $278 | 68 |
| 1015 E Brainerd St | 0.37mi | 3/2.0 (+1) | 1,353 (-7%) | 2mo | $499,000 | $369 | 64 |
| 1519 E La Rua St | 0.50mi | 3/2.0 (+1) | 1,513 (+4%) | 2mo | $494,000 | $327 | 64 |
| 1420 N 12th Ave | 0.59mi | 2/1.0 | 1,416 (-3%) | 2mo | $414,000 | $292 | 63 |
| 415 E Gonzalez St | 0.48mi | 3/2.5 (+1) | 1,386 (-5%) | 1mo | $405,000 | $292 | 62 |
| 1613 E Desoto St | 0.61mi | 3/2.0 (+1) | 1,406 (-3%) | 1mo | $465,000 | $331 | 60 |
| 1316 N Davis Hwy | 0.59mi | 2/1.5 | 1,344 (-8%) | 4mo | $235,000 | $175 | 54 |
| 1131 E Blount St | 0.57mi | 3/2.0 (+1) | 1,320 (-9%) | 8mo | $452,000 | $342 | 46 |
| 1408 N 7th Ave | 0.58mi | 3/1.5 (+1) | 1,285 (-12%) | 5mo | $341,000 | $265 | 42 |
| 908 E Lee St | 0.54mi | 3/2.0 (+1) | 1,258 (-14%) | 6mo | $340,000 | $270 | 42 |
Match score weights: distance 35% · size 25% · config 20% · recency 20%. Top-matched comps best support the ARV.
Projected returns pro-forma
-3.0% appreciation · 5.4% rent growth · sell at horizon
- IRR
- -39.0%
- Equity multiple
- -0.25×
- Total profit
- $-148,565
- Equity at exit
- $63,392
- IRR
- -44.7%
- Equity multiple
- -0.82×
- Total profit
- $-216,664
- Equity at exit
- $36,759
Cash invested: $119,043 (down + closing). Projections, not guarantees.
Landlord ↔ Tenant lean methodology
- Overall (STATE)
- 87 Strongly Landlord-Friendly
- State Florida
- 87 Strongly Landlord-Friendly · R+3
- County
- — inherits STATE
- City
- — inherits STATE
ZIP-level market 32501
- Rents YoY
- 5.4%
- Active inventory
- 130
- Price-to-rent
- 0.2×
Monthly cashflow live
- Estimated rent
- $2,035 high interval (Pro) →
- Mortgage (P&I)
- −$2,230
- Tax est. 1.5%
- −$531 /mo · $6,377/yr
- Insurance
- −$177
- HOA
- −$0
- Vacancy / Maint / Mgmt
- −$427
- Net cashflow
- $-1,330
Break-even live
Sensitivity live
| Price | -10% $-1,037 | -5% $-1,184 | +0% $-1,330 | +5% $-1,477 | +10% $-1,624 |
|---|---|---|---|---|---|
| Rent | -10% $-1,491 | -5% $-1,411 | +0% $-1,330 | +5% $-1,250 | +10% $-1,170 |
| Rate | -1.0pp $-1,116 | -0.5pp $-1,222 | base $-1,330 | +0.5pp $-1,441 | +1.0pp $-1,553 |
UW: 25.0% down · 7.5% · 30yr · 1.5% tax · 5.0% vac · 8.0% maint · 8.0% mgmt
Financing live
Cash to close
- Down payment
- $106,288
- Closing costs
- $12,755
- Reserves months
- —
- Total cash needed
- —
Loan-product check · same deal, 3 products live
Conventional
25% down · 7.5% · 30yr
- Down + closing
- —
- Monthly P&I
- —
- Monthly cashflow
- —
- DSCR
- —
- Eligible?
- —
Personal DTI + credit; lowest rate.
DSCR
20% down · 8.5% · 30yr
- Down + closing
- —
- Monthly P&I
- —
- Monthly cashflow
- —
- DSCR
- —
- Eligible?
- —
No personal income docs; deal must DSCR.
Hard money
10% down · 12.0% · 12mo
- Down + closing
- —
- Monthly P&I
- —
- Monthly cashflow
- —
- DSCR
- —
- Eligible?
- —
Short-term bridge; refi at stabilization.
Rent comps 23 comps
| Address | Beds | Baths | Sqft | Rent | $/sqft | DOM | Units | Dist |
|---|---|---|---|---|---|---|---|---|
| 511 E La Rua St Pensacola, FL | 3.0 | 1.0 | 1128 | $1,475 | $1.31 | 15d | 1 | 0.32mi |
| 801 E Gonzalez St Pensacola, FL | 3.0 | 2.0 | 1200 | $2,200 | $1.83 | 15d | 1 | 0.32mi |
| 422 N Davis Hwy Pensacola, FL | 2.0 | 1.5 | 941 | $2,100 | $2.23 | 25d | 1 | 0.35mi |
| 1011 Doctor M.L.K. Jr Dr Unit B Pensacola, FL | 2.0 | 1.0 | 877 | $1,200 | $1.37 | 25d | 1 | 0.49mi |
| 1704 E Lee St Pensacola, FL | 3.0 | 2.0 | 1226 | $2,295 | $1.87 | 25d | 1 | 0.81mi |
| 1414 E Mallory St Pensacola, FL | 3.0 | 2.0 | 1323 | $3,400 | $2.57 | 25d | 1 | 0.82mi |
| 101 E Romana St Pensacola, FL | 3.0 | 1.0–2.0 | 987 | $2,288 | $2.32 | 15d | 20 | 0.86mi |
| 504 N Spring St Unit B Pensacola, FL | 3.0 | 1.5 | 1485 | $1,995 | $1.34 | 25d | 1 | 0.89mi |
| 2008 N 8th Ave Pensacola, FL | 3.0 | 2.0 | 1058 | $1,250 | $1.18 | 15d | 1 | 0.93mi |
| 214 W La Rua St Pensacola, FL | 2.0 | 2.5 | 1600 | $2,800 | $1.75 | 15d | 1 | 0.94mi |
| 2115 N 12th Ave Pensacola, FL | 2.0 | 1.5 | 950 | $1,800 | $1.89 | 15d | 1 | 1.01mi |
| 1121 E Maxwell St Pensacola, FL | 3.0 | 2.5 | 1716 | $3,550 | $2.07 | 25d | 1 | 1.02mi |
| 220 W Chase St Pensacola, FL | 2.0 | 1.0 | 648 | $1,241 | $1.92 | 25d | 1 | 1.03mi |
| 218 Junction Ave Pensacola, FL | 2.0 | 2.5 | 1295 | $2,400 | $1.85 | 25d | 1 | 1.12mi |
| 300 Bayou Blvd Pensacola, FL | 2.0–4.0 | 1.0–1.5 | 968 | $1,500 | $1.55 | 15d | 2 | 1.16mi |
| 615 N A St Pensacola, FL | 3.0 | 2.0 | 1122 | $1,900 | $1.69 | 15d | 1 | 1.27mi |
| 1215 N C St Pensacola, FL | 3.0 | 1.0 | 1203 | $1,775 | $1.48 | 15d | 1 | 1.37mi |
| 1010 N D St Pensacola, FL | 2.0 | 2.0 | 1196 | $1,850 | $1.55 | 25d | 1 | 1.41mi |
| 418 N C St Pensacola, FL | 3.0 | 2.0 | 1017 | $2,775 | $2.73 | 15d | 1 | 1.41mi |
| 410 N C St Unit 1367374P Pensacola, FL | 3.0 | 2.0 | 1291 | $3,313 | $2.57 | 15d | 1 | 1.41mi |
| 407 W Jordan St Unit NA Pensacola, FL | 3.0 | 2.0 | 1300 | $2,200 | $1.69 | 25d | 1 | 1.44mi |
| 811 N D St Pensacola, FL | 2.0 | 2.0 | 1035 | $1,395 | $1.35 | 25d | 1 | 1.45mi |
| 814 N E St Pensacola, FL | 3.0 | 2.0 | 1440 | $1,695 | $1.18 | 25d | 1 | 1.48mi |
Listing history 6 events
-
2026-06-18days on market $5,000 Active 8 DOM
-
2026-06-17days on market $5,000 Active 7 DOM
-
2026-06-16days on market $5,000 Active 6 DOM
-
2026-06-15days on market $5,000 Active 5 DOM
-
2026-06-14remarks 309-char remark
-
2026-06-14$5,000 Active 3 DOM
ⓘ Source: listings_history table (triggers on properties + properties_extension) + one-shot
backfill from property_details.listing_events for pre-trigger history.
Climate risk First Street
- Flood 1/10 Low FEMA zone X (unshaded) · 0% chance over 30 yrs
- Wildfire 1/10 Low
- Heat 10/10 Extreme 7 d/yr ≥105°F today · 21 d/yr by 30 yrs out
- Wind 9/10 Extreme 99% chance of damaging wind over 30 yrs
- Air quality 2/10 Low 0 unhealthy d/yr today · 1 by 30 yrs out
Nearby sold comps map
Loading sold comps map…
Walkable amenities ~0.75 mi
Loading nearby amenities…
Taxation est. · year 1
- Rental income
- $24,421
- − Mortgage interest
- −$23,815
- − Property taxes
- −$6,377
- − Insurance
- −$2,126
- − Repairs & maintenance
- −$1,954
- − Management
- −$1,954
- − Depreciation
- −$12,368
- Taxable loss
- −$24,173
- Est. tax savings @ 24.0%
- +$5,801
- After-tax cash flow
- $-10,164/yr
For passive investors: Depreciation is non-cash, so a rental often shows a tax loss while cash-flowing — sheltering income. Rental losses are passive: they offset passive income freely, and up to $25,000/yr can offset ordinary (W-2) income if you actively participate and your MAGI is under $100k (phasing out to $0 by $150k); unused losses carry forward. On sale, claimed depreciation is recaptured at up to 25%, and gains may owe capital-gains tax (a 1031 exchange can defer both). Figures are a year-1 estimate at your 24.0% rate — not tax advice; consult a CPA.
Schools (NCES district)
- District
- Escambia
- NCES district ID
- 1200510
- Math proficiency
- 40% ▼ -9.00%
- Reading proficiency
- 45% ▼ -4.00%
- Median HH income
- $44,649
- Composite
- 36.04/100
- National rank
- #4773
- State rank
- #56 of 73 in FL
Livability — Pensacola
- Score
- 83/100
- State rank
- #53
- US rank
- #924
Category grades
Schools grade is shown separately in the Schools card above.
Census & demographics
- Census place
- Pensacola, FL
- County
- Escambia County · 301,722 people
- City population
- 237,636
- Metro
- Pensacola-Ferry Pass-Brent, FL
- Population (ZIP)
- 11,036
- Household income
- $44,139
- Rent vs Own
- Severe rent burden
- 816.0
Population outlook (Escambia County) Hauer SSP2
- Today (2025)
- 334,637 people
- By 2030
- 345,779 · +3.3%
- By 2040
- 364,828 · +9.0%
- By 2050
- 378,514 · +13.1%
- By 2075
- 403,220 · +20.5%
- By 2100
- 386,125 · +15.4%
Race, ethnicity, and origin ACS 2023
- Neighborhood character
- Diverse neighborhood (Simpson 0.62)
- Race & ethnicity
- Black 45% White 42% Two or more races 8% Hispanic / Latino 5%
- Common ancestry
- Subsaharan African 2% Italian 2% Slovak 2%
- Foreign-born
- 2% · Canada, Vietnam
- Languages at home
- 97% English-only · Spanish 2%
Political lean MEDSL · Escambia
- 2024 margin
- R (+19.5) · D 39.7% · R 59.2% · Other 1.1%
- 2008→2024 swing
- -0.2pp no change · 2008: -19.3pp · 2024: -19.5pp
- All cycles
- 2024: R+19.5 2020: R+15.1 2016: R+20.6 2012: R+20.6 2008: R+19.3
Not yet ingested
- Civics
- —
Market trends
- HPI YoY
- ▼ -210.53%
- Current HPI
- 273.0151
- Rent YoY
- ▲ 5.40%
- Metro
- Pensacola-Ferry Pass-Brent, FL
- State GDP YoY
- ▲ 3.28%
- F500 in state
- 36
Industry mix (Fortune 500 HQ in FL)
| Industry | F500 HQs | Revenue |
|---|---|---|
| Industrial Technology | 2 | $29B |
|
||
| Insurance | 2 | $17B |
|
||
| Retail | 1 | $60B |
|
||
| Technology Distribution | 1 | $58B |
|
||
| Homebuilding | 1 | $35B |
|
||
| Technology Manufacturing | 1 | $35B |
|
||
Price history
-91.7% since first listed2 events — show timeline
- 2026-06-10 Listed $5,000 NFMLS
- 1991-06-01 Sold (Public Records) $59,900 Public Records
Property tax history
+3.0%/yrLatest (2025): $1,296 · +7.1% YoY. Source: county tax records.
Cash-flow waterfall
monthlySold comps — $/sqft
last 12 mo · ≤1 miLoading sold comps…