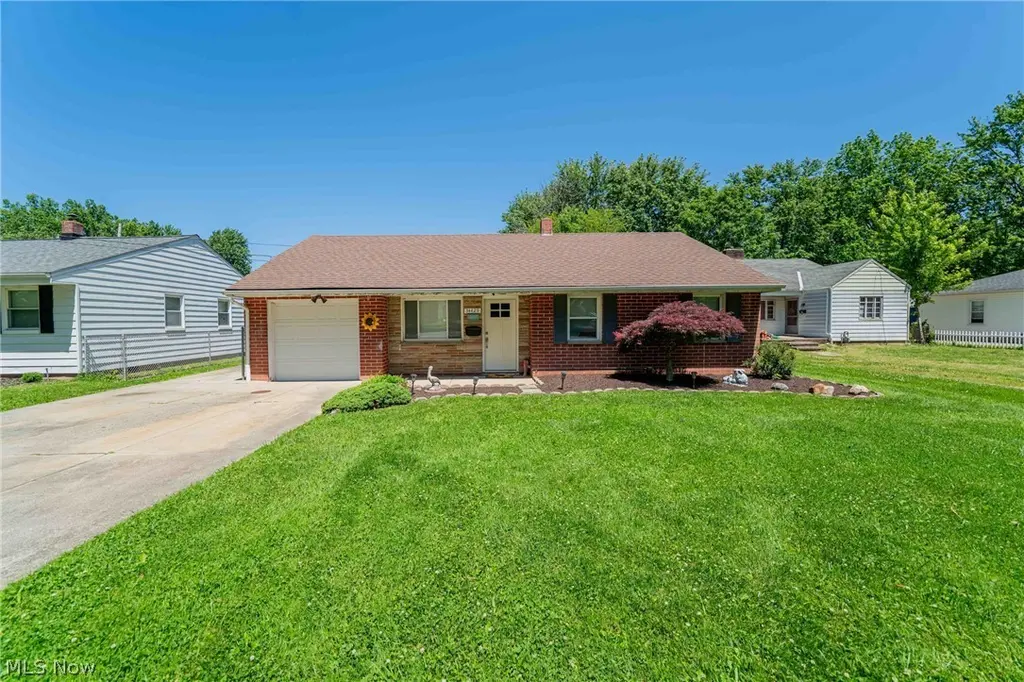
34429 Beach Park Dr · Eastlake, OH
Flood risk 1/10 · Minimal
- FEMA flood zone
- X (unshaded)
- Chance of flooding over 30 yrs
- 0.0%
- Est. flood insurance / yr
- $507 – $1,088
Fire risk 1/10 · Minimal
- Est. fire insurance / yr
- $713 – $1,323
Heat risk 3/10 · Minor
- Hot days now (above 93°F)
- 7 days/yr
- Hot days in 30 yrs
- 18 days/yr
Wind risk 1/10 · Minimal
- Chance of severe wind over 30 yrs
- —
Air-quality risk 4/10 · Minor
- Unhealthy air days now
- 6 days/yr
- Unhealthy air days in 30 yrs
- 6 days/yr
Risk factors via First Street. Map © Google.
Why this score? — see what drove the D grade
The composite is a weighted blend of 9 inputs, each scored 0–100. Each bar is that input's sub-score; the figure is the points it added to the 100-point composite (weight × sub-score).
- Cash flow +19.2/30.0
- DSCR +6.1/10.0
- Schools +4.3/10.0
- 1% rule +4.1/10.0
- Rent growth +3.7/5.0
- Livability +3.4/5.0
- Condition / age +2.5/5.0
- ARV discount +0.1/15.0
- Appreciation +0.0/10.0
$174,500
🖨 Deal sheet (PDF) 📄 Offer letter ✓ Due diligence
Listing remarks MLS
Renovated 3 bedroom, 1 bath home. New kitchen, bathroom, and flooring in 2019. Also new ceiling fans installed last year in all 3 of the bedrooms. You'll also find a newer roof, furnace, HWT, A/C, and windows.
Key facts
- Easy-flow layout
- Eastlake location
- Granite countertops
Tags
Property features AI
Exterior
- Parking: Attached garage (1 car); Concrete driveway
- Utilities: Public water; Public sewer
- Home design: Single-story; Faces north
- Construction: Brick construction; Asphalt roof; Built in public-records year; Home warranty included
- Exterior features: Front yard; Back yard; Chain link fencing; Patio; Shed(s)
Interior
- Kitchen: Dishwasher; Microwave; Range; Refrigerator
- Bedrooms: 2 main-level bedrooms
- Bathrooms: 1 full bathroom (main level)
- Heating & cooling: Gas heating; Central air conditioning
- Interior features: 5 total rooms; Patio; Shed(s)
- Laundry & utility: Washer; Dryer; Laundry in common area
Neighborhood map
What this means for you Summary
Snapshot
- This is a 3-bed/1.0-bath single-family listed at $174k.
Deal economics
- At list price, monthly cash flow is $189 ($2k/yr) — positive.
- The deal already cash-flows at list — no discount required.
- To meet the 1% rule (rent ≥ 1% of price), the offer needs to be $159k (9.0% below list).
- Recommended offer: $159k (9.0% below list) — sets the bar for 1% rule.
- Cap rate 7.6% vs local median 4.8% in Eastlake — top-decile yield for the area; either an underpriced asset or a hidden risk that comps aren't pricing in. Stress-test before assuming the spread holds.
Location & tenants
- Location reads 68/100 on livability (#550 in OH) — a middle-class / working-renter tenant base. Strengths: cost of living A+, housing A+, health & safety A-; Watch: employment D+, amenities F, commute F.
- Willoughby-Eastlake City (suburban): math 42% / reading 58% proficiency, ranked #434 of 656 in OH (top 66%) — acceptable for families but not a draw, mixed tenant base, ~2y average lease.
- Market conditions: Rents rising fast (+4.8%/yr); 132 active listings in the ZIP; 3 comparable units currently listed for rent nearby; rentals at typical pace (median 17d on market — plan ~3-4 weeks tenant-placement turnaround); 448 units permitted in Lake County in 2024 (0 in 5+ unit buildings).
Forward outlook
- Local home prices are declining (-3.0%/yr); year-one equity from $1k of loan paydown is wiped out by about $5k of value loss. Plan a longer hold.
- Lake County population projected to shrink 8% by 2050 — rents likely to lag national; underwrite the cash flow, not the appreciation.
Negotiation context
- Only 10 days on market — expect competitive offers; lowballing is unlikely to land.
- 7 sale attempts since 33y ago with the ask held roughly flat each time — persistent listings suggest the price (not the market) is what's stuck; bring a comps-based counter.
- Current owner paid $125k; 40% above their basis — modest negotiation headroom, anchor on the comps not their cost.
Risks & watch-outs
- Watch-outs: built in 1954 — expect roof / HVAC / electrical / plumbing capex.
Questions for the listing agent
- Built in 1954 — when were the roof, HVAC, electrical panel, plumbing, and water heater last replaced?
- Is there a deadline driving the sale (1031 exchange, divorce, estate, relocation)? That informs how much negotiation room exists.
- Schools are B-rated — typically a magnet for longer-tenancy family renters. What's the average tenant stay here, and is there a school-zone premium baked into asking?
- The area grade is low — what's the realistic commute time and amenity access for the typical tenant pool here? Any planned neighborhood developments (good or bad) we should know about?
- What's the average days-on-market for RENTAL listings here right now (not sales)? A rising rental-DOM trend means longer vacancies and softer asking-rent achievability than the comps imply.
- What's the recent tenant-quality profile in this submarket — average credit score on applications, eviction rate, late-payment / NSF rate, and stable-employment percentage? A property-management company in the area should have these aggregated.
- How much new for-sale + rental construction is in the pipeline within 1–3 miles? Heavy new supply typically softens prices + rents 12–24 months out; constrained supply supports both.
Investment metrics
- 1% rule
- 0.91% ✗
- Cap rate
- 7.59%
- Cash-on-cash
- 4.65%
- DSCR
- 1.21
- GRM
- 9.2
CMA / ARV
- ARV (on-the-fly)
- $149,966
- Comps found
- 12
Show comp detail 12 sales within ~0.75 mi
| Address | Dist | Beds/Ba | Sqft | Sold | Price | $/sf | Match |
|---|---|---|---|---|---|---|---|
| 743 E 347th St | 0.18mi | 3/1.0 | 975 (+9%) | 16mo | $112,500 | $115 | 64 |
| 34114 Lake Shore Blvd | 0.52mi | 2/1.0 (-1) | 870 (-3%) | 2mo | $145,000 | $167 | 64 |
| 1041 E 349th St | 0.51mi | 2/1.0 (-1) | 887 (-1%) | 8mo | $166,000 | $187 | 63 |
| 1009 E 347th St | 0.39mi | 3/1.0 | 972 (+8%) | 9mo | $179,900 | $185 | 60 |
| 34682 Iris Ln | 0.15mi | 3/1.5 | 1,032 (+15%) | 8mo | $220,000 | $213 | 60 |
| 34269 Sylvia Dr | 0.33mi | 3/1.0 | 1,008 (+12%) | 7mo | $75,000 | $74 | 59 |
| 731 E 344th St | 0.10mi | 2/1.0 (-1) | 1,013 (+13%) | 20mo | $170,000 | $168 | 52 |
| 33688 Guilbert Rd | 0.59mi | 2/1.0 (-1) | 828 (-8%) | 3mo | $132,500 | $160 | 52 |
| 34045 Sylvia Dr | 0.42mi | 3/1.5 | 980 (+9%) | 21mo | $165,500 | $169 | 46 |
| 1101 Waverly Rd | 0.74mi | 2/1.0 (-1) | 900 (+0%) | 19mo | $139,050 | $155 | 44 |
| 34312 Lake Shore Blvd | 0.52mi | 3/1.0 | 999 (+11%) | 22mo | $155,000 | $155 | 38 |
| 1221 E 340th St | 0.70mi | 2/1.0 (-1) | 1,001 (+12%) | 22mo | $157,000 | $157 | 25 |
Match score weights: distance 35% · size 25% · config 20% · recency 20%. Top-matched comps best support the ARV.
Projected returns pro-forma
-3.0% appreciation · 4.81% rent growth · sell at horizon
- IRR
- -7.3%
- Equity multiple
- 0.73×
- Total profit
- $-13,342
- Equity at exit
- $26,019
- IRR
- 4.2%
- Equity multiple
- 1.33×
- Total profit
- $16,181
- Equity at exit
- $15,088
Cash invested: $48,860 (down + closing). Projections, not guarantees.
Landlord ↔ Tenant lean methodology
- Overall (STATE)
- 73 Landlord-Friendly
- State Ohio
- 73 Landlord-Friendly · R+6
- County
- — inherits STATE
- City
- — inherits STATE
ZIP-level market 44095
- Rents YoY
- 4.8%
- Active inventory
- 132
- Price-to-rent
- 9.2×
Monthly cashflow live
- Estimated rent
- $1,587 medium interval (Pro) →
- Mortgage (P&I)
- −$915
- Tax from tax record
- −$77 /mo · $925/yr
- Insurance
- −$73
- HOA
- −$0
- Vacancy / Maint / Mgmt
- −$333
- Net cashflow
- $189
Break-even live
Sensitivity live
| Price | -10% $288 | -5% $239 | +0% $189 | +5% $140 | +10% $90 |
|---|---|---|---|---|---|
| Rent | -10% $64 | -5% $127 | +0% $189 | +5% $252 | +10% $315 |
| Rate | -1.0pp $277 | -0.5pp $234 | base $189 | +0.5pp $144 | +1.0pp $98 |
UW: 25.0% down · 7.5% · 30yr · 1.5% tax · 5.0% vac · 8.0% maint · 8.0% mgmt
Financing live
Cash to close
- Down payment
- $43,625
- Closing costs
- $5,235
- Reserves months
- —
- Total cash needed
- —
Loan-product check · same deal, 3 products live
Conventional
25% down · 7.5% · 30yr
- Down + closing
- —
- Monthly P&I
- —
- Monthly cashflow
- —
- DSCR
- —
- Eligible?
- —
Personal DTI + credit; lowest rate.
DSCR
20% down · 8.5% · 30yr
- Down + closing
- —
- Monthly P&I
- —
- Monthly cashflow
- —
- DSCR
- —
- Eligible?
- —
No personal income docs; deal must DSCR.
Hard money
10% down · 12.0% · 12mo
- Down + closing
- —
- Monthly P&I
- —
- Monthly cashflow
- —
- DSCR
- —
- Eligible?
- —
Short-term bridge; refi at stabilization.
Rent comps 3 comps
| Address | Beds | Baths | Sqft | Rent | $/sqft | DOM | Units | Dist |
|---|---|---|---|---|---|---|---|---|
| 33201 Vine St Willowick, OH | 1.0–2.0 | 1.0 | 621 | $1,200 | $1.93 | 21d | 1 | 1.03mi |
| 1323 E 360th St Eastlake, OH | 3.0 | 1.0 | 1036 | $1,599 | $1.54 | 17d | 1 | 1.13mi |
| 360 E 326th St Willowick, OH | 2.0 | 2.0 | 1053 | $1,447 | $1.37 | 3d | 1 | 1.15mi |
Listing history 8 events
-
2026-06-21statusdays on market $174,500 Active 10 DOM
-
2026-06-13statusdays on market $174,500 Pending 9 DOM
-
2026-06-09days on market $174,500 Active 8 DOM
-
2026-06-08days on market $174,500 Active 7 DOM
-
2026-06-07days on market $174,500 Active 6 DOM
-
2026-06-03days on market $174,500 Active 2 DOM
-
2026-06-01remarks 699-char remark
-
2026-06-01$174,500 Active 1 DOM
ⓘ Source: listings_history table (triggers on properties + properties_extension) + one-shot
backfill from property_details.listing_events for pre-trigger history.
Tax reassessment forecast OH · Partial reset (capped growth)
- Current annual tax
- $925 · $77/mo
- Projected year-2 tax
- $1,823 · $152/mo
- Expected delta
- +$899/yr (+$75/mo · 97.2%)
ⓘ Screening estimate from a state-policy table — verify with the county assessor before closing.
Climate risk First Street
- Flood 1/10 Low FEMA zone X (unshaded) · 0% chance over 30 yrs
- Wildfire 1/10 Low
- Heat 3/10 Moderate 7 d/yr ≥93°F today · 18 d/yr by 30 yrs out
- Wind 1/10 Low
- Air quality 4/10 Moderate 6 unhealthy d/yr today · 6 by 30 yrs out
Nearby sold comps map
Loading sold comps map…
Walkable amenities ~0.75 mi
Loading nearby amenities…
Taxation est. · year 1
- Rental income
- $19,050
- − Mortgage interest
- −$9,775
- − Property taxes
- −$925
- − Insurance
- −$872
- − Repairs & maintenance
- −$1,524
- − Management
- −$1,524
- − Depreciation
- −$5,076
- Taxable loss
- −$646
- Est. tax savings @ 24.0%
- +$155
- After-tax cash flow
- $2,426/yr
For passive investors: Depreciation is non-cash, so a rental often shows a tax loss while cash-flowing — sheltering income. Rental losses are passive: they offset passive income freely, and up to $25,000/yr can offset ordinary (W-2) income if you actively participate and your MAGI is under $100k (phasing out to $0 by $150k); unused losses carry forward. On sale, claimed depreciation is recaptured at up to 25%, and gains may owe capital-gains tax (a 1031 exchange can defer both). Figures are a year-1 estimate at your 24.0% rate — not tax advice; consult a CPA.
Schools (NCES district)
- District
- Willoughby-Eastlake City
- NCES district ID
- 3904510
- Math proficiency
- 42% ▼ -21.00%
- Reading proficiency
- 58% ▼ -11.00%
- Median HH income
- $52,500
- Composite
- 42.96/100
- National rank
- #3110
- State rank
- #434 of 656 in OH
Livability — Eastlake
- Score
- 68/100
- State rank
- #550
- US rank
- #9388
Category grades
Schools grade is shown separately in the Schools card above.
Census & demographics
- Census place
- Eastlake, OH
- County
- Lake County · 204,927 people
- City population
- 32,363
- Metro
- Cleveland-Elyria, OH
- Population (ZIP)
- 32,363
- Household income
- $71,543
- Rent vs Own
- Severe rent burden
- 590.0
Population outlook (Lake County) Hauer SSP2
- Today (2025)
- 230,022 people
- By 2030
- 228,151 · -0.8%
- By 2040
- 221,018 · -3.9%
- By 2050
- 212,754 · -7.5%
- By 2075
- 200,309 · -12.9%
- By 2100
- 183,315 · -20.3%
Race, ethnicity, and origin ACS 2023
- Neighborhood character
- Predominantly White (87%)
- Race & ethnicity
- White 87% Black 5% Two or more races 5% Hispanic / Latino 3%
- Common ancestry
- Romanian 8% Slovak 2% Lithuanian 2%
- Foreign-born
- 3% · Canada
- Languages at home
- 94% English-only · Russian/Polish/Slavic 3% Spanish 1% German/W. Germanic 1%
Political lean MEDSL · Lake
- 2024 margin
- R (+14.3) · D 42.4% · R 56.7%
- 2008→2024 swing
- -15.2pp toward R · 2008: 0.8pp · 2024: -14.3pp
- All cycles
- 2024: R+14.3 2020: R+13.6 2016: R+15.6 2012: R+1.7 2008: D+0.8
Not yet ingested
- Civics
- —
Market trends
- HPI YoY
- ▼ -187.78%
- Current HPI
- 171.8121
- Rent YoY
- ▲ 4.81%
- Metro
- Cleveland-Elyria, OH
- State GDP YoY
- ▲ 1.98%
- F500 in state
- 48
Industry mix (Fortune 500 HQ in OH)
| Industry | F500 HQs | Revenue |
|---|---|---|
| Insurance | 3 | $145B |
|
||
| Industrial Machinery | 3 | $49B |
|
||
| Financial Services | 3 | $24B |
|
||
| Consumer Goods | 2 | $93B |
|
||
| Aerospace / Defense | 2 | $47B |
|
||
| Utilities | 2 | $33B |
|
||
Price history
+267.4% since first listed25 events — show timeline
- 2026-05-20 Listed $174,500 MLSNOW
- 2020-08-30 Listing Removed — MLSNOW
- 2020-08-30 Contingent — MLSNOW
- 2020-08-29 Listing Removed — MLSNOW
- 2020-08-28 Sold (Public Records) $125,000 Public Records
- 2020-08-28 Sold (MLS) $125,000 MLSNOW
- 2020-08-10 Contingent — MLSNOW
- 2020-08-08 Listed $122,900 MLSNOW
- 2020-08-05 Coming Soon $122,900 MLSNOW
- 2019-11-11 Listing Removed — MLSNOW
- 2019-10-28 Price Changed $116,900 MLSNOW
- 2019-10-17 Listed $119,900 MLSNOW
- 2019-08-02 Sold (Public Records) $78,000 Public Records
- 2019-08-02 Sold (MLS) $78,000 MLSNOW
- 2019-07-24 Pending — MLSNOW
- 2019-07-12 Listed $89,900 MLSNOW
- 2004-02-16 Sold (MLS) $75,000 MLSNOW
- 2004-02-13 Sold (Public Records) $75,000 Public Records
- 2003-09-19 Listed $99,900 MLSNOW
- 1995-06-16 Sold (MLS) $75,000 MLSNOW
- 1995-06-15 Sold (Public Records) $75,000 Public Records
- 1995-04-30 Listed $75,000 MLSNOW
- 1994-02-08 Listing Removed — MLSNOW
- 1993-11-08 Listed $74,900 MLSNOW
- 1986-10-08 Sold (Public Records) $47,500 Public Records
Property tax history
-3.7%/yrLatest (2025): $925 · -41.2% YoY. Source: county tax records.
Cash-flow waterfall
monthlySold comps — $/sqft
last 12 mo · ≤1 miLoading sold comps…