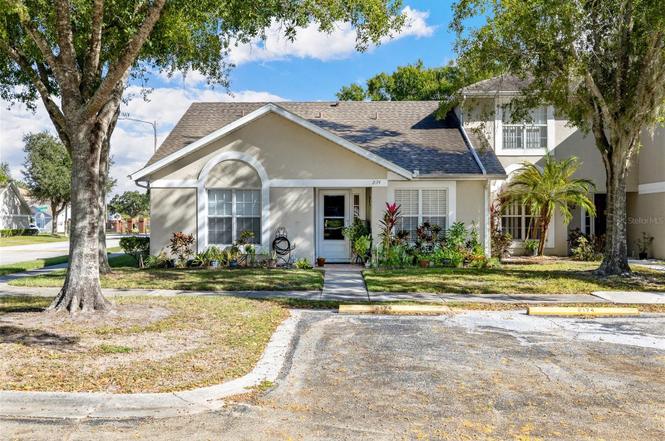
2174 Cypress Bay Blvd · Kissimmee, FL
Flood risk 3/10 · Minor
- FEMA flood zone
- X (unshaded)
- Chance of flooding over 30 yrs
- 0.2%
- Est. flood insurance / yr
- $507 – $1,088
Fire risk 1/10 · Minimal
- Est. fire insurance / yr
- $947 – $1,759
Heat risk 9/10 · Severe
- Hot days now (above 108°F)
- 7 days/yr
- Hot days in 30 yrs
- 23 days/yr
Wind risk 9/10 · Severe
- Chance of severe wind over 30 yrs
- 99.0%
Air-quality risk 1/10 · Minimal
- Unhealthy air days now
- 0 days/yr
- Unhealthy air days in 30 yrs
- 0 days/yr
Risk factors via First Street. Map © Google.
Why this score? — see what drove the D grade
The composite is a weighted blend of 9 inputs, each scored 0–100. Each bar is that input's sub-score; the figure is the points it added to the 100-point composite (weight × sub-score).
- Cash flow +13.0/30.0
- ARV discount +10.9/15.0
- DSCR +3.9/10.0
- Livability +3.9/5.0
- Schools +3.6/10.0
- 1% rule +3.3/10.0
- Rent growth +2.6/5.0
- Condition / age +2.5/5.0
- Appreciation +0.0/10.0
$260,000
🖨 Deal sheet 📄 Offer letter ✓ Due diligence
Listing remarks MLS
"Short Sale; approval of the seller's lenders(s) may be conditioned upon the gross commission being reduced. BANK APPROVED. .. .. .. .. .. .. .
Key facts
- Gated community
- Secure neighborhood
- Open layout
Tags
Property features AI
Finance
- Other: Homestead exemption indicated
- Financial info: Total monthly fees reported around $166.14; Total annual fees reported around $1,993.62; Lease restrictions not indicated
- HOA & community: HOA required; Monthly HOA fee approximately $141.02; Additional annual association fee listed; Association approval required; Association amenities include pool, playground, tennis courts, basketball court, maintenance and street lights; Pets allowed (cats and dogs)
Exterior
- Parking: Assigned parking
- Utilities: Public water; Public sewer; Cable available
- Home design: Residential townhouse; Northwest facing; One story; Living area approximately 1,177 (per public records)
- Construction: Block and stucco construction; Shingle roof; Slab foundation; Built as part of building number 2174
- Exterior features: Enclosed patio/porch; Rear porch; Screened porch; Exterior lighting; Sliding doors; Corner lot; Concrete road access; Publicly maintained road
Interior
- Kitchen: Convection oven; Disposal; Microwave
- Bedrooms: 3 bedrooms
- Flooring: Laminate; Tile
- Bathrooms: 2 full bathrooms
- Heating & cooling: Central heating; Central air conditioning
- Interior features: Ceiling fans; Open floorplan; Thermostat
- Laundry & utility: Laundry closet
Neighborhood map
What this means for you Summary
Snapshot
- This is a 3-bed/2.0-bath townhouse listed at $260k.
Deal economics
- At list price, monthly cash flow is $-15 ($-175/yr) — negative.
- To cash-flow at today's rent, offer at most $257k (1.0% below list).
- To meet the 1% rule (rent ≥ 1% of price), the offer needs to be $215k (17.1% below list).
- Recommended offer: $215k (17.1% below list) — sets the bar for 1% rule.
- Cap rate 6.2% vs local median 3.5% in Kissimmee — top-decile yield for the area; either an underpriced asset or a hidden risk that comps aren't pricing in. Stress-test before assuming the spread holds.
Location & tenants
- Location reads 77/100 on livability (#181 in FL, #2,841 nationally) — a middle-class / working-renter tenant base. Strengths: commute A+, housing A+, health & safety A+; Watch: crime D-, employment D-.
- Osceola (suburban): math 39% / reading 45% proficiency, ranked #60 of 73 in FL (top 82%) — families likely to look elsewhere, expect single-tenant / working-renter base with shorter leases; 60% free/reduced lunch — lower-income household profile, screen leases tightly.
- Zoned schools: Cypress Elementary School (math 32% / reading 35%, grade F, #1,758 of 2,144 statewide, top 83%, 498 students, 62% FRL); Gateway High School (math 26% / reading 39%, grade F, #411 of 667 statewide, top 62%, 1,726 students, 60% FRL) — zoned schools at 61% FRL track the district average.
- Market conditions: Rents flat; 188 active listings in the ZIP; 40 comparable units currently listed for rent nearby; rentals at typical pace (median 24d on market — plan ~3-4 weeks tenant-placement turnaround); 8,813 units permitted in Osceola County in 2024 (3,072 in 5+ unit buildings).
- This rent runs 41% of the median local income ($63k/yr) — at the standard rent-burdened threshold; future hikes will face affordability resistance.
Forward outlook
- Local home prices are declining (-3.0%/yr); year-one equity from $2k of loan paydown is wiped out by about $8k of value loss. Plan a longer hold.
- Osceola County population projected at +73% by 2050 — long-run rental-demand tailwind backs the buy-and-hold thesis.
Negotiation context
- It's been on market 171 days — a 12% lower offer ($229k) is reasonable based on typical stale-listing flexibility.
- 4 sale attempts since 20y ago; this cycle's ask has dropped $15k (5%) from the opening price — seller is motivated, your offer sets the floor, not the list.
- Current owner paid $55k; list at $260k implies a 373% gain — meaningful room to come down on a strong offer.
Risks & watch-outs
- Climate carrying-cost: severe wind risk, 99% chance of damaging wind over 30y; extreme-heat days projected 7→23/yr by 2055 (HVAC capex compounding) — expect insurance premiums to compound above CPI over the hold.
Questions for the listing agent
- What do current leases actually rent for vs. the listed asking? Can we see a recent rent roll and the last 12 months of T-12 income?
- It's been on market 171 days. Have you received any prior offers? Is the seller open to a 17% concession, seller financing, or rate buy-down credit?
- What does the HOA fee cover, when was the last increase, and are there any pending special assessments or reserve-fund shortfalls?
- Why hasn't it sold? Are there any deal-killer items the seller is aware of (foundation, flood, title, zoning, code violations)?
- Is there a deadline driving the sale (1031 exchange, divorce, estate, relocation)? That informs how much negotiation room exists.
- Crime grade is D in this area — have there been break-ins, vandalism, or insurance claims at this property in the last 3 years? What carrier currently insures it and at what premium?
- The area grade is low — what's the realistic commute time and amenity access for the typical tenant pool here? Any planned neighborhood developments (good or bad) we should know about?
- What's the average days-on-market for RENTAL listings here right now (not sales)? A rising rental-DOM trend means longer vacancies and softer asking-rent achievability than the comps imply.
- What's the recent tenant-quality profile in this submarket — average credit score on applications, eviction rate, late-payment / NSF rate, and stable-employment percentage? A property-management company in the area should have these aggregated.
- How much new for-sale + rental construction is in the pipeline within 1–3 miles? Heavy new supply typically softens prices + rents 12–24 months out; constrained supply supports both.
Investment metrics
- 1% rule
- 0.83% ✗
- Cap rate
- 6.23%
- Cash-on-cash
- -0.24%
- DSCR
- 0.99
- GRM
- 10.1
CMA / ARV
- ARV (on-the-fly)
- $281,303
- Comps found
- 11
Show comp detail 11 sales within ~0.75 mi
| Address | Dist | Beds/Ba | Sqft | Sold | Price | $/sf | Match |
|---|---|---|---|---|---|---|---|
| 2174 Cypress Bay Blvd | 0.00mi | 3/2.0 | 1,177 (0%) | 1mo | $240,000 | $204 | 99 |
| 2190 Cypress Bay Blvd | 0.05mi | 3/2.0 | 1,177 (0%) | 14mo | $250,000 | $212 | 86 |
| 2178 Cypress Bay Blvd | 0.02mi | 2/2.0 (-1) | 1,000 (-15%) | 1mo | $250,000 | $250 | 68 |
| 2355 Water View Loop | 0.08mi | 2/2.0 (-1) | 1,000 (-15%) | 2mo | $239,000 | $239 | 65 |
| 2181 Cypress Bay Blvd | 0.03mi | 2/2.0 (-1) | 1,000 (-15%) | 11mo | $240,000 | $240 | 59 |
| 49 Silver Park Cir | 0.71mi | 3/2.0 | 1,214 (+3%) | 5mo | $239,900 | $198 | 57 |
| 46 Silver Falls Cir | 0.73mi | 3/2.0 | 1,214 (+3%) | 9mo | $230,000 | $189 | 53 |
| 2156 Cypress Bay Blvd | 0.05mi | 2/2.0 (-1) | 1,000 (-15%) | 19mo | $284,500 | $285 | 52 |
| 51 Silver Park Cir | 0.71mi | 3/2.0 | 1,214 (+3%) | 12mo | $255,000 | $210 | 51 |
| 46 Silver Park Cir | 0.68mi | 3/2.0 | 1,070 (-9%) | 5mo | $280,000 | $262 | 49 |
| 2132 Cypress Bay Blvd | 0.12mi | 2/2.0 (-1) | 1,000 (-15%) | 24mo | $259,900 | $260 | 44 |
Match score weights: distance 35% · size 25% · config 20% · recency 20%. Top-matched comps best support the ARV.
Projected returns pro-forma
-3.0% appreciation · 0.34% rent growth · sell at horizon
- IRR
- -19.6%
- Equity multiple
- 0.33×
- Total profit
- $-48,692
- Equity at exit
- $38,767
- IRR
- -18.9%
- Equity multiple
- 0.10×
- Total profit
- $-65,516
- Equity at exit
- $22,480
Cash invested: $72,800 (down + closing). Projections, not guarantees.
Landlord ↔ Tenant lean methodology
- Overall (STATE)
- 87 Strongly Landlord-Friendly
- State Florida
- 87 Strongly Landlord-Friendly · R+3
- County
- — inherits STATE
- City
- — inherits STATE
ZIP-level market 34743
- Rents YoY
- 0.3%
- Active inventory
- 188
- Price-to-rent
- 10.1×
Monthly cashflow live
- Estimated rent
- $2,155 high interval (Pro) →
- Mortgage (P&I)
- −$1,363
- Tax from tax record
- −$79 /mo · $946/yr
- Insurance
- −$108
- HOA
- −$166
- Vacancy / Maint / Mgmt
- −$452
- Net cashflow
- $-15
Break-even live
UW: 25.0% down · 7.5% · 30yr · 1.5% tax · 5.0% vac · 8.0% maint · 8.0% mgmt
Financing live
Cash to close
- Down payment
- $65,000
- Closing costs
- $7,800
- Reserves months
- —
- Total cash needed
- —
Loan-product check · same deal, 3 products live
Conventional
25% down · 7.5% · 30yr
- Down + closing
- —
- Monthly P&I
- —
- Monthly cashflow
- —
- DSCR
- —
- Eligible?
- —
Personal DTI + credit; lowest rate.
DSCR
20% down · 8.5% · 30yr
- Down + closing
- —
- Monthly P&I
- —
- Monthly cashflow
- —
- DSCR
- —
- Eligible?
- —
No personal income docs; deal must DSCR.
Hard money
10% down · 12.0% · 12mo
- Down + closing
- —
- Monthly P&I
- —
- Monthly cashflow
- —
- DSCR
- —
- Eligible?
- —
Short-term bridge; refi at stabilization.
Rent comps 40 comps
| Address | Beds | Baths | Sqft | Rent | $/sqft | DOM | Units | Dist |
|---|---|---|---|---|---|---|---|---|
| 2194 Cypress Bay Blvd Kissimmee, FL | 2.0 | 2.0 | 1000 | $1,875 | $1.88 | 4d | 1 | 0.07mi |
| 2321 Water View Loop Kissimmee, FL | 3.0 | 2.5 | 1460 | $1,850 | $1.27 | 23d | 1 | 0.07mi |
| 1832 Wimbledon St Kissimmee, FL | 3.0 | 3.0 | 1206 | $3,200 | $2.65 | 23d | 1 | 0.17mi |
| 2039 Cypress Bay Blvd Kissimmee, FL | 3.0 | 2.5 | 1382 | $1,900 | $1.37 | 17d | 1 | 0.18mi |
| 1801 Houston St Kissimmee, FL | 3.0 | 2.5 | 1452 | $2,150 | $1.48 | 23d | 1 | 0.32mi |
| 1680 Houston St Kissimmee, FL | 3.0 | 2.5 | 1452 | $2,500 | $1.72 | 23d | 1 | 0.38mi |
| 2406 Askey Ct Kissimmee, FL | 3.0 | 2.0 | 1264 | $2,190 | $1.73 | 4d | 1 | 0.43mi |
| 2408 Sonja Ct Kissimmee, FL | 3.0 | 2.0 | 1264 | $2,185 | $1.73 | 4d | 1 | 0.50mi |
| 263 La Paz Dr Kissimmee, FL | 2.0 | 2.0 | 1162 | $2,000 | $1.72 | 4d | 1 | 0.52mi |
| 2338 Cordova Ct Kissimmee, FL | 3.0 | 2.0 | 1293 | $2,100 | $1.62 | 21d | 1 | 0.68mi |
| 2338 Cordova Ct Kissimmee, FL | 3.0 | 2.0 | 1293 | $2,100 | $1.62 | 23d | 1 | 0.68mi |
| 302 Parkland Cir Kissimmee, FL | 1.0–4.0 | 1.0–3.0 | 971 | $1,617 | $1.67 | 1d | 24 | 0.69mi |
| 2318 Santa Ana St Kissimmee, FL | 3.0 | 2.0 | 1082 | $1,800 | $1.66 | 23d | 1 | 0.70mi |
| 2294 Santa Lucia St Kissimmee, FL | 3.0 | 2.0 | 1224 | $1,890 | $1.54 | 3d | 1 | 0.71mi |
| 2298 Santa Lucia St Kissimmee, FL | 3.0 | 2.0 | 1213 | $2,050 | $1.69 | 23d | 1 | 0.72mi |
| 48 Silver Falls Cir Kissimmee, FL | 2.0 | 2.0 | 938 | $1,500 | $1.60 | 23d | 1 | 0.75mi |
| 72 Silver Park Cir Unit 72 Kissimmee, FL | 2.0 | 2.0 | 936 | $1,750 | $1.87 | 17d | 1 | 0.75mi |
| 2406 Parsons Pond Cir Kissimmee, FL | 3.0 | 2.0 | 1164 | $1,995 | $1.71 | 23d | 1 | 0.76mi |
| 13 Silver Park Cir Kissimmee, FL | 2.0 | 2.0 | 938 | $1,499 | $1.60 | 4d | 1 | 0.77mi |
| 2483 Shelby Cir Kissimmee, FL | 3.0 | 2.0 | 1413 | $2,300 | $1.63 | 10d | 1 | 0.77mi |
| 2483 Shelby Cir Kissimmee, FL | 3.0 | 2.0 | 1413 | $2,300 | $1.63 | 10d | 1 | 0.77mi |
| 165 Toluca Dr Kissimmee, FL | 3.0 | 2.0 | 1260 | $1,899 | $1.51 | 23d | 1 | 0.81mi |
| 138 Las Brisas Way Kissimmee, FL | 2.0 | 2.0 | 960 | $1,450 | $1.51 | 10d | 1 | 0.81mi |
| 2414 Harbor Town Dr Kissimmee, FL | 4.0 | 2.0 | 1263 | $1,800 | $1.43 | 23d | 1 | 0.85mi |
| 2504 Parsons Pond Cir Kissimmee, FL | 3.0 | 2.0 | 1052 | $2,000 | $1.90 | 17d | 1 | 0.87mi |
| 37 Las Brisas Way Kissimmee, FL | 2.0 | 2.0 | 960 | $1,500 | $1.56 | 23d | 1 | 0.89mi |
| 37 Las Brisas Way Unit 37 Kissimmee, FL | 2.0 | 2.0 | 960 | $1,600 | $1.67 | 23d | 1 | 0.89mi |
| 49 Las Brisas Ct Kissimmee, FL | 2.0 | 2.0 | 960 | $1,420 | $1.48 | 23d | 1 | 0.90mi |
| 19 Lago Mesa Way Kissimmee, FL | 2.0 | 2.0 | 960 | $1,599 | $1.67 | 23d | 1 | 0.92mi |
| 2370 Harbor Town Dr Kissimmee, FL | 3.0 | 2.0 | 1263 | $1,950 | $1.54 | 4d | 1 | 0.93mi |
| 354 Cervantes Dr Unit 354 Kissimmee, FL | 2.0 | 2.5 | 1120 | $1,600 | $1.43 | 23d | 1 | 0.95mi |
| 751 Country Woods Cir Kissimmee, FL | 3.0 | 2.0 | 1344 | $2,750 | $2.05 | 23d | 1 | 0.99mi |
| 2305 Cutler Ct Kissimmee, FL | 3.0 | 2.0 | 1208 | $1,979 | $1.64 | 23d | 1 | 1.05mi |
| 109 Alderwood Dr Kissimmee, FL | 2.0 | 2.0 | 1036 | $1,685 | $1.63 | 23d | 1 | 1.06mi |
| 206 Majors Ln Unit A Kissimmee, FL | 3.0 | 2.0 | 1122 | $1,800 | $1.60 | 23d | 1 | 1.06mi |
| 201 Watts Ln Kissimmee, FL | 3.0 | 2.5 | 1500 | $1,700 | $1.13 | 7d | 1 | 1.06mi |
| 203 Watts Ln Apt C Kissimmee, FL | 2.0 | 2.5 | 1088 | $1,550 | $1.42 | 23d | 1 | 1.07mi |
| 255 Taylor Ln Unit 101 Kissimmee, FL | 3.0 | 2.0 | 1159 | $1,850 | $1.60 | 21d | 1 | 1.10mi |
| 255 Taylor Ln Kissimmee, FL | 3.0 | 2.0 | 1159 | $1,800 | $1.55 | 10d | 1 | 1.10mi |
| 255 Taylor Ln Unit 202 Kissimmee, FL | 3.0 | 2.0 | 1159 | $1,800 | $1.55 | 21d | 1 | 1.10mi |
HOA detail
- Monthly dues
- $166 · $1,992/yr
Listing history 15 events
-
2026-05-14status Pending
-
2026-04-17price $260,000
-
2026-03-12status Active
-
2026-03-03status Pending
-
2026-01-20price $265,000
-
2025-11-15$275,000 Active
-
2009-12-21soldstatus $55,000
-
2009-12-11soldstatus $55,000 148-char remark
Show marketing remark (148 chars)
"Short Sale; approval of the seller's lenders(s) may be conditioned upon the gross commission being reduced. BANK APPROVED. .. .. .. .. .. .. .
-
2008-07-22$55,000 148-char remark
Show marketing remark (148 chars)
"Short Sale; approval of the seller's lenders(s) may be conditioned upon the gross commission being reduced. BANK APPROVED. .. .. .. .. .. .. .
-
2006-07-11soldstatus $198,000
-
2006-06-30soldstatus $198,000 33-char remark
Show marketing remark (33 chars)
A must see! Its ready to move in.
-
2006-05-05$193,000 33-char remark
Show marketing remark (33 chars)
A must see! Its ready to move in.
-
2004-04-07soldstatus $110,000
-
2002-09-27soldstatus $89,000
-
1995-12-01soldstatus $74,900
ⓘ Source: listings_history table (triggers on properties + properties_extension) + one-shot
backfill from property_details.listing_events for pre-trigger history.
Tax reassessment forecast FL · Resets to sale price
- Current annual tax
- $946 · $79/mo
- Projected year-2 tax
- $2,158 · $180/mo
- Expected delta
- +$1,212/yr (+$101/mo · 128.1%)
ⓘ Screening estimate from a state-policy table — verify with the county assessor before closing.
Climate risk First Street
- Flood 3/10 Moderate FEMA zone X (unshaded) · 20% chance over 30 yrs
- Wildfire 1/10 Low
- Heat 9/10 Extreme 7 d/yr ≥108°F today · 23 d/yr by 30 yrs out
- Wind 9/10 Extreme 99% chance of damaging wind over 30 yrs
- Air quality 1/10 Low 0 unhealthy d/yr today · 0 by 30 yrs out
Nearby sold comps map
Loading sold comps map…
Walkable amenities ~0.75 mi
Loading nearby amenities…
Taxation est. · year 1
- Rental income
- $25,855
- − Mortgage interest
- −$14,564
- − Property taxes
- −$946
- − Insurance
- −$1,300
- − Repairs & maintenance
- −$2,068
- − Management
- −$2,068
- − HOA
- −$1,992
- − Depreciation
- −$7,564
- Taxable loss
- −$4,648
- Est. tax savings @ 24.0%
- +$1,115
- After-tax cash flow
- $941/yr
For passive investors: Depreciation is non-cash, so a rental often shows a tax loss while cash-flowing — sheltering income. Rental losses are passive: they offset passive income freely, and up to $25,000/yr can offset ordinary (W-2) income if you actively participate and your MAGI is under $100k (phasing out to $0 by $150k); unused losses carry forward. On sale, claimed depreciation is recaptured at up to 25%, and gains may owe capital-gains tax (a 1031 exchange can defer both). Figures are a year-1 estimate at your 24.0% rate — not tax advice; consult a CPA.
Schools (NCES district)
- District
- Osceola
- NCES district ID
- 1201470
- Math proficiency
- 39% ▼ -9.00%
- Reading proficiency
- 45% ▼ -4.00%
- Median HH income
- $45,528
- Composite
- 35.7/100
- National rank
- #4865
- State rank
- #60 of 73 in FL
Livability — Kissimmee
- Score
- 77/100
- State rank
- #181
- US rank
- #2841
Category grades
Schools grade is shown separately in the Schools card above.
Census & demographics
- Census place
- Kissimmee, FL
- County
- Osceola County · 410,217 people
- City population
- 196,187
- Metro
- Orlando-Kissimmee-Sanford, FL
- Population (ZIP)
- 40,030
- Household income
- $62,992
- Rent vs Own
- Severe rent burden
- 1624.0
Population outlook (Osceola County) Hauer SSP2
- Today (2025)
- 447,624 people
- By 2030
- 511,823 · +14.3%
- By 2040
- 642,986 · +43.6%
- By 2050
- 774,552 · +73.0%
- By 2075
- 1,078,144 · +140.9%
- By 2100
- 1,269,660 · +183.6%
Race, ethnicity, and origin ACS 2023
- Neighborhood character
- Predominantly Hispanic (76%)
- Race & ethnicity
- Hispanic / Latino 76% Two or more races 25% White 10% Black 9% Asian 3%
- Hispanic origin (detail)
- Mexican 2% Puerto Rican 43% Cuban 5% Dominican 7%
- Common ancestry
- Hispanic 2% Lithuanian 1% Romanian 1%
- Foreign-born
- 27% · Canada, Jamaica
- Languages at home
- 32% English-only · Spanish 63% French/Haitian/Cajun 2% Tagalog/Filipino 2%
Political lean MEDSL · Osceola
- 2024 margin
- Toss-up / Even · D 48.7% · R 50.2% · Other 1.1%
- 2008→2024 swing
- -21.2pp toward R · 2008: 19.7pp · 2024: -1.4pp
- All cycles
- 2024: R+1.4 2020: D+13.8 2016: D+25.0 2012: D+24.5 2008: D+19.7
Not yet ingested
- Civics
- —
Market trends
- HPI YoY
- ▼ -304.87%
- Current HPI
- 352.0782
- Rent YoY
- ▲ 0.34%
- Metro
- Orlando-Kissimmee-Sanford, FL
- State GDP YoY
- ▲ 3.28%
- F500 in state
- 36
Industry mix (Fortune 500 HQ in FL)
| Industry | F500 HQs | Revenue |
|---|---|---|
| Industrial Technology | 2 | $29B |
|
||
| Insurance | 2 | $17B |
|
||
| Retail | 1 | $60B |
|
||
| Technology Distribution | 1 | $58B |
|
||
| Homebuilding | 1 | $35B |
|
||
| Technology Manufacturing | 1 | $35B |
|
||
Price history
+247.1% since first listed15 events — show timeline
- 2026-05-14 Pending — Stellar MLS as Distributed by MLS Grid
- 2026-04-17 Price Changed $260,000 Stellar MLS as Distributed by MLS Grid
- 2026-03-12 Relisted — Stellar MLS as Distributed by MLS Grid
- 2026-03-03 Pending — Stellar MLS as Distributed by MLS Grid
- 2026-01-20 Price Changed $265,000 Stellar MLS as Distributed by MLS Grid
- 2025-11-15 Listed $275,000 Stellar MLS as Distributed by MLS Grid
- 2009-12-21 Sold (Public Records) $55,000 Public Records
- 2009-12-11 Sold (MLS) $55,000 Stellar MLS as Distributed by MLS Grid
- 2008-07-22 Listed $55,000 Stellar MLS as Distributed by MLS Grid
- 2006-07-11 Sold (Public Records) $198,000 Public Records
- 2006-06-30 Sold (MLS) $198,000 Stellar MLS as Distributed by MLS Grid
- 2006-05-05 Listed $193,000 Stellar MLS as Distributed by MLS Grid
- 2004-04-07 Sold (Public Records) $110,000 Public Records
- 2002-09-27 Sold (Public Records) $89,000 Public Records
- 1995-12-01 Sold (Public Records) $74,900 Public Records
Property tax history
+0.9%/yrLatest (2025): $946 · +38.2% YoY. Source: county tax records.
Cash-flow waterfall
monthlySold comps — $/sqft
last 12 mo · ≤1 miLoading sold comps…