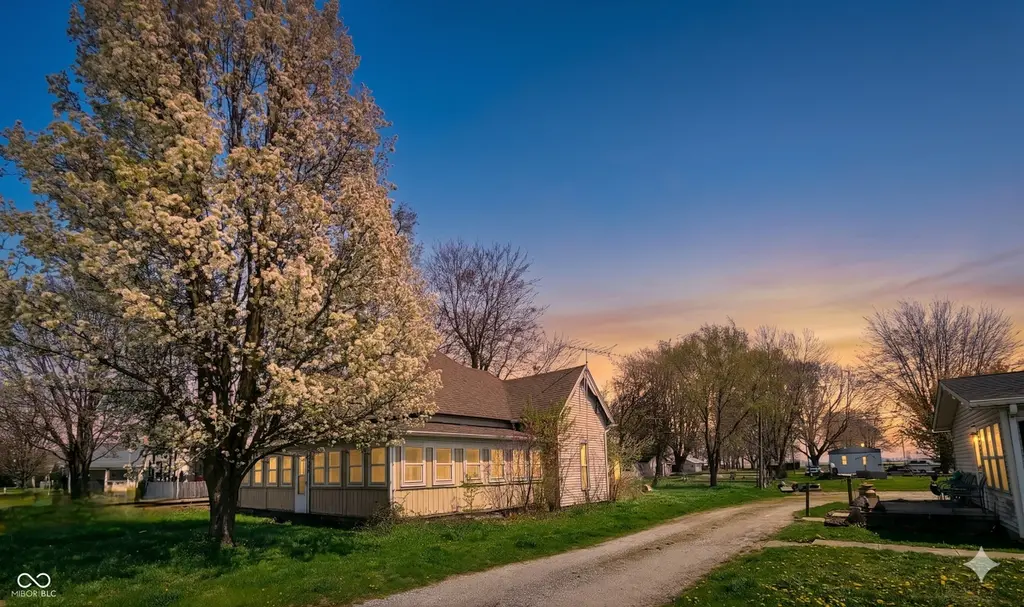
415 N Independence St · Windfall City, IN
Flood risk 1/10 · Minimal
- FEMA flood zone
- X (unshaded)
- Chance of flooding over 30 yrs
- 0.0%
- Est. flood insurance / yr
- $507 – $1,088
Fire risk 1/10 · Minimal
- Est. fire insurance / yr
- $717 – $1,331
Heat risk 3/10 · Minor
- Hot days now (above 100°F)
- 7 days/yr
- Hot days in 30 yrs
- 18 days/yr
Wind risk 2/10 · Minimal
- Chance of severe wind over 30 yrs
- 0.0%
Air-quality risk 3/10 · Minor
- Unhealthy air days now
- 2 days/yr
- Unhealthy air days in 30 yrs
- 3 days/yr
Risk factors via First Street. Map © Google.
Why this score? — see what drove the B+ grade
The composite is a weighted blend of 9 inputs, each scored 0–100. Each bar is that input's sub-score; the figure is the points it added to the 100-point composite (weight × sub-score).
- Cash flow +30.0/30.0
- 1% rule +10.0/10.0
- DSCR +10.0/10.0
- Appreciation +8.4/10.0
- ARV discount +7.5/15.0
- Schools +3.0/10.0
- Livability +2.9/5.0
- Rent growth +2.5/5.0
- Condition / age +2.5/5.0
$59,000
🖨 Deal sheet 📄 Offer letter ✓ Due diligence
Listing remarks MLS
Investor Special! This fixer-upper is brimming with potential for the right buyer. Sold * as-is * , this property presents a solid investment opportunity, whether for a flip, rental, or long-term value growth. With the right rehab, it could be transformed into a desirable asset in Windfall. The spacious layout offers plenty of room to reimagine the space, while the property's location provides convenience and appeal. If you're ready to take on a project that has great upside potential, this is the one for you! For inquiries, contact Brian Ingle at 765-960-0533.
Key facts
- Spacious layout
- 7,405 sq ft lot
- Garage
Tags
Property features AI
Exterior
- Parking: Detached and attached garage; 1 garage space
- Utilities: Public water; Municipal sewer connected
- Home design: Single-family residence; One-story home
- Construction: Vinyl siding; Crawl space foundation
- Exterior features: Lot under 1/4 acre (approximately 0.17 acre)
Interior
- Kitchen: Eat-in kitchen; Water heater
- Bedrooms: Two main-level bedrooms (one approx. 12 x 12)
- Bathrooms: One full bathroom on the main level
- Heating & cooling: Forced air heating; No central air listed
- Interior features: Eat-in kitchen; Living room (approximately 15.2 x 15.2); Additional main-level room (approximately 12.3 x 15.5); Utility room (approximately 19.7 x 10.1)
- Laundry & utility: Utility room on main level
Neighborhood map
What this means for you Summary
Snapshot
- This is a 3-bed/1.0-bath single-family listed at $59k.
Deal economics
- At list price, monthly cash flow is $603 ($7k/yr) — positive.
- The deal already cash-flows at list — no discount required.
- Meets the 1% rule at list price ($1k rent vs $59k).
- Recommended offer: $57k (3.0% below list) — sets the bar for market timing.
Location & tenants
- Location reads 57/100 on livability (#609 in IN) — a working-class tenant base; expect higher turnover. Strengths: cost of living A+, housing A-; Watch: employment D+, crime D, amenities F.
- Tri-Central Community Schools (rural): math 28% / reading 39% proficiency, ranked #196 of 301 in IN (top 65%) — families likely to look elsewhere, expect single-tenant / working-renter base with shorter leases.
- Zoned schools: Tri Central Elementary (math 32% / reading 37%, grade F, #597 of 994 statewide, top 63%, 377 students, 45% FRL) — zoned schools average 45% FRL vs 29% district-wide (17 pts higher); higher-poverty schools than district average — tighter screening recommended.
- Market conditions: 12 active listings in the ZIP; 32 units permitted in Tipton County in 2024 (0 in 5+ unit buildings).
Forward outlook
- In year one you build about $4k of equity ($408 loan paydown + $4k appreciation (6.9% local appreciation)).
- Tipton County population projected at -23% by 2050 — secular population decline; favor cash flow + early exit over multi-decade hold.
- At projected returns (6.9% appreciation + 3.0% rent growth), your $17k cash investment doubles in ~2 years — after that, you're playing with house money.
- By year 8, paydown + projected appreciation supports a ~$35k cash-out refi (75% LTV) — recoverable capital for the next deal without selling this one.
Negotiation context
- It's been on market 50 days — a 3% lower offer ($57k) is reasonable based on typical stale-listing flexibility.
- 4 sale attempts since 2y ago; this cycle's ask has dropped $6k (9%) from the opening price — seller is motivated, your offer sets the floor, not the list.
Risks & watch-outs
- Watch-outs: built in 1900 — expect roof / HVAC / electrical / plumbing capex.
Questions for the listing agent
- It's been on market 50 days. Have you received any prior offers? Is the seller open to a 3% concession, seller financing, or rate buy-down credit?
- Built in 1900 — when were the roof, HVAC, electrical panel, plumbing, and water heater last replaced?
- Is there a deadline driving the sale (1031 exchange, divorce, estate, relocation)? That informs how much negotiation room exists.
- Schools are F-rated, which usually means shorter tenancies and higher turnover. Who's the typical renter profile here, and what's been the actual vacancy rate?
- Crime grade is D in this area — have there been break-ins, vandalism, or insurance claims at this property in the last 3 years? What carrier currently insures it and at what premium?
- What's the average days-on-market for RENTAL listings here right now (not sales)? A rising rental-DOM trend means longer vacancies and softer asking-rent achievability than the comps imply.
- What's the recent tenant-quality profile in this submarket — average credit score on applications, eviction rate, late-payment / NSF rate, and stable-employment percentage? A property-management company in the area should have these aggregated.
- How much new for-sale + rental construction is in the pipeline within 1–3 miles? Heavy new supply typically softens prices + rents 12–24 months out; constrained supply supports both.
Investment metrics
- 1% rule
- 2.05% ✓
- Cap rate
- 18.55%
- Cash-on-cash
- 43.77%
- DSCR
- 2.95
- GRM
- 4.1
CMA / ARV
- ARV (median comp)
- $152,603
- List price
- $59,000
- Delta
- -57.41%
- Verdict
- UNDERPRICED
- Comps
- 10 within 1.0 mi
Show comp detail 2 sales within ~0.75 mi
| Address | Dist | Beds/Ba | Sqft | Sold | Price | $/sf | Match |
|---|---|---|---|---|---|---|---|
| 309 New St | 0.31mi | 3/2.0 | 1,431 (-2%) | 11mo | $181,800 | $127 | 69 |
| 115 N Posey St | 0.19mi | 3/1.0 | 1,663 (+14%) | 10mo | $160,000 | $96 | 60 |
Match score weights: distance 35% · size 25% · config 20% · recency 20%. Top-matched comps best support the ARV.
Projected returns pro-forma
6.9% appreciation · 3.0% rent growth · sell at horizon
- IRR
- 54.3%
- Equity multiple
- 4.55×
- Total profit
- $58,593
- Equity at exit
- $40,486
- IRR
- 50.4%
- Equity multiple
- 9.57×
- Total profit
- $141,601
- Equity at exit
- $76,545
Cash invested: $16,520 (down + closing). Projections, not guarantees.
Landlord ↔ Tenant lean methodology
- Overall (STATE)
- 90 Strongly Landlord-Friendly
- State Indiana
- 90 Strongly Landlord-Friendly · R+11
- County
- — inherits STATE
- City
- — inherits STATE
ZIP-level market 46076
- Home prices YoY
- 2.4%
- Active inventory
- 12
- Price-to-rent
- 4.1×
Monthly cashflow live
- Estimated rent
- $1,210 medium interval (Pro) →
- Mortgage (P&I)
- −$309
- Tax from tax record
- −$20 /mo · $234/yr
- Insurance
- −$25
- HOA
- −$0
- Vacancy / Maint / Mgmt
- −$254
- Net cashflow
- $603
Break-even live
UW: 25.0% down · 7.5% · 30yr · 1.5% tax · 5.0% vac · 8.0% maint · 8.0% mgmt
Financing live
Cash to close
- Down payment
- $14,750
- Closing costs
- $1,770
- Reserves months
- —
- Total cash needed
- —
Loan-product check · same deal, 3 products live
Conventional
25% down · 7.5% · 30yr
- Down + closing
- —
- Monthly P&I
- —
- Monthly cashflow
- —
- DSCR
- —
- Eligible?
- —
Personal DTI + credit; lowest rate.
DSCR
20% down · 8.5% · 30yr
- Down + closing
- —
- Monthly P&I
- —
- Monthly cashflow
- —
- DSCR
- —
- Eligible?
- —
No personal income docs; deal must DSCR.
Hard money
10% down · 12.0% · 12mo
- Down + closing
- —
- Monthly P&I
- —
- Monthly cashflow
- —
- DSCR
- —
- Eligible?
- —
Short-term bridge; refi at stabilization.
Listing history 25 events
-
2026-06-19days on market $59,000 Active 50 DOM
-
2026-06-18days on market $59,000 Active 49 DOM
-
2026-06-17days on market $59,000 Active 48 DOM
-
2026-06-17price $59,000 Active 47 DOM
-
2026-06-16days on market $64,999 Active 47 DOM
Show marketing remark (570 chars)
Investor Special! This fixer-upper is brimming with potential for the right buyer. Sold * as-is * , this property presents a solid investment opportunity, whether for a flip, rental, or long-term value growth. With the right rehab, it could be transformed into a desirable asset in Windfall. The spacious layout offers plenty of room to reimagine the space, while the property's location provides convenience and appeal. If you're ready to take on a project that has great upside potential, this is the one for you! For inquiries, contact Brian Ingle at 765-960-0533.
-
2026-06-15days on market $64,999 Active 46 DOM
-
2026-06-14days on market $64,999 Active 44 DOM
-
2026-06-13days on market $64,999 Active 43 DOM
-
2026-06-10days on market $64,999 Active 41 DOM
-
2026-06-09days on market $64,999 Active 40 DOM
-
2026-06-08days on market $64,999 Active 39 DOM
-
2026-06-07days on market $64,999 Active 38 DOM
-
2026-06-05days on market $64,999 Active 35 DOM
-
2026-06-03days on market $64,999 Active 34 DOM
-
2026-06-02days on market $64,999 Active 33 DOM
-
2026-06-01days on market $64,999 Active 32 DOM
-
2026-05-31days on market $64,999 Active 31 DOM
-
2026-05-30days on market $64,999 Active 30 DOM
-
2026-04-29$64,999 Active 498-char remark
-
2025-11-18price $64,999 598-char remark
Show marketing remark (570 chars)
Investor Special! This fixer-upper is brimming with potential for the right buyer. Sold * as-is * , this property presents a solid investment opportunity, whether for a flip, rental, or long-term value growth. With the right rehab, it could be transformed into a desirable asset in Windfall. The spacious layout offers plenty of room to reimagine the space, while the property's location provides convenience and appeal. If you're ready to take on a project that has great upside potential, this is the one for you! For inquiries, contact Brian Ingle at 765-960-0533.
-
2025-08-11status Active 598-char remark
Show marketing remark (570 chars)
Investor Special! This fixer-upper is brimming with potential for the right buyer. Sold * as-is * , this property presents a solid investment opportunity, whether for a flip, rental, or long-term value growth. With the right rehab, it could be transformed into a desirable asset in Windfall. The spacious layout offers plenty of room to reimagine the space, while the property's location provides convenience and appeal. If you're ready to take on a project that has great upside potential, this is the one for you! For inquiries, contact Brian Ingle at 765-960-0533.
-
2025-08-11historical 598-char remark
Show marketing remark (570 chars)
Investor Special! This fixer-upper is brimming with potential for the right buyer. Sold * as-is * , this property presents a solid investment opportunity, whether for a flip, rental, or long-term value growth. With the right rehab, it could be transformed into a desirable asset in Windfall. The spacious layout offers plenty of room to reimagine the space, while the property's location provides convenience and appeal. If you're ready to take on a project that has great upside potential, this is the one for you! For inquiries, contact Brian Ingle at 765-960-0533.
-
2025-05-10$65,000 Active 598-char remark
Show marketing remark (570 chars)
Investor Special! This fixer-upper is brimming with potential for the right buyer. Sold * as-is * , this property presents a solid investment opportunity, whether for a flip, rental, or long-term value growth. With the right rehab, it could be transformed into a desirable asset in Windfall. The spacious layout offers plenty of room to reimagine the space, while the property's location provides convenience and appeal. If you're ready to take on a project that has great upside potential, this is the one for you! For inquiries, contact Brian Ingle at 765-960-0533.
-
2024-12-21historical
-
2024-05-31$69,000 Active
ⓘ Source: listings_history table (triggers on properties + properties_extension) + one-shot
backfill from property_details.listing_events for pre-trigger history.
Tax reassessment forecast IN · Partial reset (capped growth)
- Current annual tax
- $234 · $20/mo
- Projected year-2 tax
- $368 · $31/mo
- Expected delta
- +$134/yr (+$11/mo · 57.2%)
ⓘ Screening estimate from a state-policy table — verify with the county assessor before closing.
Climate risk First Street
- Flood 1/10 Low FEMA zone X (unshaded) · 0% chance over 30 yrs
- Wildfire 1/10 Low
- Heat 3/10 Moderate 7 d/yr ≥100°F today · 18 d/yr by 30 yrs out
- Wind 2/10 Low 0% chance of damaging wind over 30 yrs
- Air quality 3/10 Moderate 2 unhealthy d/yr today · 3 by 30 yrs out
Nearby sold comps map
Loading sold comps map…
Walkable amenities ~0.75 mi
Loading nearby amenities…
Taxation est. · year 1
- Rental income
- $14,523
- − Mortgage interest
- −$3,305
- − Property taxes
- −$234
- − Insurance
- −$295
- − Repairs & maintenance
- −$1,162
- − Management
- −$1,162
- − Depreciation
- −$1,716
- Taxable income
- $6,649
- Est. tax owed @ 24.0%
- −$1,596
- After-tax cash flow
- $5,636/yr
For passive investors: Depreciation is non-cash, so a rental often shows a tax loss while cash-flowing — sheltering income. Rental losses are passive: they offset passive income freely, and up to $25,000/yr can offset ordinary (W-2) income if you actively participate and your MAGI is under $100k (phasing out to $0 by $150k); unused losses carry forward. On sale, claimed depreciation is recaptured at up to 25%, and gains may owe capital-gains tax (a 1031 exchange can defer both). Figures are a year-1 estimate at your 24.0% rate — not tax advice; consult a CPA.
Schools (NCES district)
- District
- Tri-Central Community Schools
- NCES district ID
- 1808040
- Math proficiency
- 28% ▼ -8.00%
- Reading proficiency
- 39% ▼ -8.00%
- Median HH income
- $54,902
- Composite
- 29.54/100
- National rank
- #6492
- State rank
- #196 of 301 in IN
Livability — Windfall City
- Score
- 57/100
- State rank
- #609
- US rank
- #21957
Category grades
Schools grade is shown separately in the Schools card above.
Census & demographics
- Census place
- Windfall City, IN
- Population (ZIP)
- 1,754
Population outlook (Tipton County) Hauer SSP2
- Today (2025)
- 14,332 people
- By 2030
- 13,717 · -4.3%
- By 2040
- 12,357 · -13.8%
- By 2050
- 11,032 · -23.0%
- By 2075
- 8,640 · -39.7%
- By 2100
- 6,544 · -54.3%
Race, ethnicity, and origin ACS 2023
- Neighborhood character
- Predominantly White (86%)
- Race & ethnicity
- White 86% Two or more races 8% Hispanic / Latino 5%
- Common ancestry
- Iranian 4% Slovak 2% Lithuanian 1%
- Languages at home
- 97% English-only · Spanish 2% Tagalog/Filipino 1%
Political lean MEDSL · Tipton
- 2024 margin
- Solid R (+50.8) · D 23.7% · R 74.5% · Other 1.7%
- 2008→2024 swing
- -35.5pp toward R · 2008: -15.4pp · 2024: -50.8pp
- All cycles
- 2024: R+50.8 2020: R+52.7 2016: R+53.3 2012: R+31.8 2008: R+15.4
Not yet ingested
- Civics
- —
Market trends
- HPI YoY
- ▲ 6.90%
- Current HPI
- 289.8652
- Rent YoY
- —
- Metro
- —
- State GDP YoY
- ▲ 2.90%
- F500 in state
- 18
Industry mix (Fortune 500 HQ in IN)
| Industry | F500 HQs | Revenue |
|---|---|---|
| Industrial Machinery | 2 | $37B |
|
||
| Healthcare | 1 | $177B |
|
||
| Pharmaceuticals | 1 | $45B |
|
||
| Metals / Steel | 1 | $18B |
|
||
| Agriculture | 1 | $17B |
|
||
| Packaging | 1 | $12B |
|
||
Price history
-14.5% since first listed9 events — show timeline
- 2026-06-16 Price Changed $59,000 RRELMS
- 2026-06-16 Price Changed $59,000 MIBOR as Distributed by MLS Grid
- 2026-04-29 Listed $64,999 MIBOR as Distributed by MLS Grid
- 2025-11-18 Price Changed $64,999 RRELMS
- 2025-08-11 Relisted — RRELMS
- 2025-08-11 Delisted — RRELMS
- 2025-05-10 Listed $65,000 RRELMS
- 2024-12-21 Listing Removed — MIBOR as Distributed by MLS Grid
- 2024-05-31 Listed $69,000 MIBOR as Distributed by MLS Grid
Property tax history
-5.6%/yrLatest (2024): $234 · +1.7% YoY. Source: county tax records.
Cash-flow waterfall
monthlySold comps — $/sqft
last 12 mo · ≤1 miLoading sold comps…