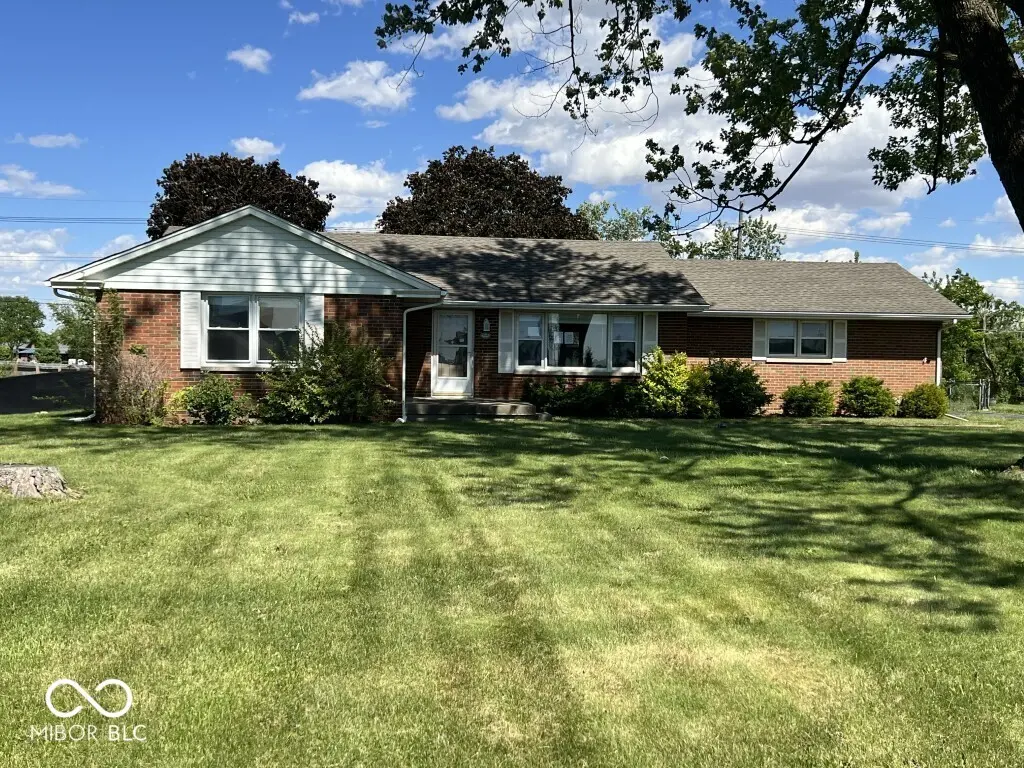
5249 Hickory Rd · Indianapolis city (balance), IN
Flood risk 1/10 · Minimal
- FEMA flood zone
- X (unshaded)
- Chance of flooding over 30 yrs
- 0.0%
- Est. flood insurance / yr
- $507 – $1,088
Fire risk 1/10 · Minimal
- Est. fire insurance / yr
- $717 – $1,331
Heat risk 3/10 · Minor
- Hot days now (above 101°F)
- 7 days/yr
- Hot days in 30 yrs
- 19 days/yr
Wind risk 2/10 · Minimal
- Chance of severe wind over 30 yrs
- 1.0%
Air-quality risk 2/10 · Minimal
- Unhealthy air days now
- 1 days/yr
- Unhealthy air days in 30 yrs
- 2 days/yr
Risk factors via First Street. Map © Google.
Why this score? — see what drove the C grade
The composite is a weighted blend of 9 inputs, each scored 0–100. Each bar is that input's sub-score; the figure is the points it added to the 100-point composite (weight × sub-score).
- Cash flow +19.1/30.0
- ARV discount +15.0/15.0
- DSCR +6.0/10.0
- 1% rule +5.0/10.0
- Rent growth +4.0/5.0
- Schools +4.0/10.0
- Livability +2.5/5.0
- Condition / age +2.5/5.0
- Appreciation +0.0/10.0
$203,000
🖨 Deal sheet 📄 Offer letter ✓ Due diligence
Listing remarks MLS
Super hard to find full brick ranch in a great location. They just don't build homes like this any more! This home has a 2 car attached garage & a large detached garage for your toys with a handyman's dream workshop. Relax outside on the open front patio in the front or the deck in the back. Inside features newer floors & loads of natural light throughout. The spacious eat-in kitchen is completely updated with solid surface countertops, new appliances & beautiful custom cabinets. The bathroom is also updated & this home has a surprising amount of closet space. Wonderful view of the large backyard from the 3 season sunroom. The backyard is fully fenced & lined with tress in the back. Additional open parking outside makes this a must see!
Key facts
- Attached garage
- Separate garage
- Sunroom
Tags
Property features AI
Finance
- Other: Approximately 0.46 acre lot (about 1/4–1/2 acre)
Exterior
- Parking: Attached and detached garage space; Two garage spaces
- Utilities: Municipal sewer connection; Private well water; Cable available; Electricity connected; Natural gas connected
- Home design: Single-family residence; One level; West-facing
- Construction: Brick construction; Block foundation
- Exterior features: Full yard fence; Outbuilding on the property
Interior
- Kitchen: Dishwasher; Garbage disposal
- Bedrooms: Three bedrooms on the main level (sizes: 13x12, 12x11, 16x14)
- Bathrooms: One full bathroom on the main level
- Heating & cooling: Natural gas heating; Central air conditioning
- Interior features: Eat-in kitchen; Glass-enclosed patio/porch
- Laundry & utility: Gas water heater
Neighborhood map
What this means for you Summary
Snapshot
- This is a 3-bed/1.0-bath single-family listed at $203k.
Deal economics
- At list price, monthly cash flow is $214 ($3k/yr) — positive.
- The deal already cash-flows at list — no discount required.
- Meets the 1% rule at list price ($2k rent vs $203k).
- Cap rate 7.6% vs local median 4.4% in Indianapolis city (balance) — top-decile yield for the area; either an underpriced asset or a hidden risk that comps aren't pricing in. Stress-test before assuming the spread holds.
Location & tenants
- Location reads: area grade C — affects rentability + tenant quality, not the cash-flow math above.
- Franklin Township Community School Corporation (urban): math 42% / reading 47% proficiency, ranked #87 of 301 in IN (top 29%) — families likely to look elsewhere, expect single-tenant / working-renter base with shorter leases.
- Market conditions: Rents rising fast (+6.1%/yr); 333 active listings in the ZIP; 5 comparable units currently listed for rent nearby; rentals at typical pace (median 24d on market — plan ~3-4 weeks tenant-placement turnaround); solid renter incomes; 1,906 units permitted in Marion County in 2024 (621 in 5+ unit buildings).
Forward outlook
- Local home prices are declining (-3.0%/yr); year-one equity from $1k of loan paydown is wiped out by about $6k of value loss. Plan a longer hold.
- Marion County population projected at +18% by 2050 — long-run rental-demand tailwind backs the buy-and-hold thesis.
Negotiation context
- Only 10 days on market — expect competitive offers; lowballing is unlikely to land.
- 4 sale attempts since 4y ago with the ask held roughly flat each time — persistent listings suggest the price (not the market) is what's stuck; bring a comps-based counter.
Risks & watch-outs
- Watch-outs: built in 1956 — expect roof / HVAC / electrical / plumbing capex.
Questions for the listing agent
- Built in 1956 — when were the roof, HVAC, electrical panel, plumbing, and water heater last replaced?
- Is there a deadline driving the sale (1031 exchange, divorce, estate, relocation)? That informs how much negotiation room exists.
- What's the average days-on-market for RENTAL listings here right now (not sales)? A rising rental-DOM trend means longer vacancies and softer asking-rent achievability than the comps imply.
- What's the recent tenant-quality profile in this submarket — average credit score on applications, eviction rate, late-payment / NSF rate, and stable-employment percentage? A property-management company in the area should have these aggregated.
- How much new for-sale + rental construction is in the pipeline within 1–3 miles? Heavy new supply typically softens prices + rents 12–24 months out; constrained supply supports both.
Investment metrics
- 1% rule
- 1.00% ✓
- Cap rate
- 7.56%
- Cash-on-cash
- 4.51%
- DSCR
- 1.20
- GRM
- 8.3
CMA / ARV
- ARV (on-the-fly)
- $272,340
- Comps found
- 10
Show comp detail 10 sales within ~0.75 mi
| Address | Dist | Beds/Ba | Sqft | Sold | Price | $/sf | Match |
|---|---|---|---|---|---|---|---|
| 4904 Betholm Dr | 0.51mi | 3/1.5 | 1,232 (-8%) | 9mo | $180,000 | $146 | 54 |
| 10325 Southeastern Ave | 0.59mi | 3/1.0 | 1,360 (+2%) | 21mo | $198,500 | $146 | 52 |
| 5145 Cartland Dr | 0.34mi | 3/2.0 | 1,503 (+13%) | 12mo | $305,000 | $203 | 49 |
| 9236 Kavanaugh Dr | 0.42mi | 3/2.0 | 1,503 (+13%) | 10mo | $307,000 | $204 | 47 |
| 5127 Cartland Dr | 0.35mi | 3/2.0 | 1,503 (+13%) | 15mo | $311,000 | $207 | 46 |
| 9237 Kavanaugh Dr | 0.39mi | 3/2.0 | 1,503 (+13%) | 15mo | $295,000 | $196 | 45 |
| 10068 Southeastern Ave | 0.33mi | 3/2.0 | 1,152 (-14%) | 21mo | $239,000 | $207 | 41 |
| 9324 E Thompson Rd | 0.48mi | 3/1.0 | 1,160 (-13%) | 19mo | $215,000 | $185 | 40 |
| 5607 Tart Blvd | 0.69mi | 3/2.0 | 1,503 (+13%) | 10mo | $318,000 | $212 | 34 |
| 9146 Blue Hill St | 0.67mi | 3/2.0 | 1,503 (+13%) | 18mo | $312,000 | $208 | 28 |
Match score weights: distance 35% · size 25% · config 20% · recency 20%. Top-matched comps best support the ARV.
Projected returns pro-forma
-3.0% appreciation · 6.11% rent growth · sell at horizon
- IRR
- -5.8%
- Equity multiple
- 0.78×
- Total profit
- $-12,691
- Equity at exit
- $30,268
- IRR
- 7.2%
- Equity multiple
- 1.62×
- Total profit
- $35,316
- Equity at exit
- $17,552
Cash invested: $56,840 (down + closing). Projections, not guarantees.
Landlord ↔ Tenant lean methodology
- Overall (STATE)
- 90 Strongly Landlord-Friendly
- State Indiana
- 90 Strongly Landlord-Friendly · R+11
- County
- — inherits STATE
- City
- — inherits STATE
ZIP-level market 46239
- Home prices YoY
- -29.2%
- Rents YoY
- 6.1%
- Active inventory
- 333
- Price-to-rent
- 8.3×
Monthly cashflow live
- Estimated rent
- $2,036 high interval (Pro) →
- Mortgage (P&I)
- −$1,065
- Tax from tax record
- −$246 /mo · $2,951/yr
- Insurance
- −$85
- HOA
- −$0
- Vacancy / Maint / Mgmt
- −$428
- Net cashflow
- $214
Break-even live
UW: 25.0% down · 7.5% · 30yr · 1.5% tax · 5.0% vac · 8.0% maint · 8.0% mgmt
Financing live
Cash to close
- Down payment
- $50,750
- Closing costs
- $6,090
- Reserves months
- —
- Total cash needed
- —
Loan-product check · same deal, 3 products live
Conventional
25% down · 7.5% · 30yr
- Down + closing
- —
- Monthly P&I
- —
- Monthly cashflow
- —
- DSCR
- —
- Eligible?
- —
Personal DTI + credit; lowest rate.
DSCR
20% down · 8.5% · 30yr
- Down + closing
- —
- Monthly P&I
- —
- Monthly cashflow
- —
- DSCR
- —
- Eligible?
- —
No personal income docs; deal must DSCR.
Hard money
10% down · 12.0% · 12mo
- Down + closing
- —
- Monthly P&I
- —
- Monthly cashflow
- —
- DSCR
- —
- Eligible?
- —
Short-term bridge; refi at stabilization.
Rent comps 5 comps
| Address | Beds | Baths | Sqft | Rent | $/sqft | DOM | Units | Dist |
|---|---|---|---|---|---|---|---|---|
| 9237 Kavanaugh Dr Indianapolis, IN | 3.0 | 2.0 | 1503 | $2,200 | $1.46 | 17d | 1 | 0.40mi |
| 10166 Southeastern Ave Indianapolis, IN | 2.0 | 1.5 | 1625 | $1,295 | $0.80 | 23d | 1 | 0.40mi |
| 8836 Kipling Dr Indianapolis, IN | 4.0 | 2.5 | 1686 | $2,200 | $1.30 | 23d | 1 | 0.89mi |
| 4146 Palermo Garden Indianapolis, IN | 3.0 | 2.0 | 1790 | $2,100 | $1.17 | 1d | 1 | 1.10mi |
| 4127 S Post Rd Indianapolis, IN | 3.0 | 2.0 | 1460 | $1,585 | $1.09 | 23d | 1 | 1.36mi |
Listing history 13 events
-
2026-06-02status $203,000 Pending 10 DOM
-
2026-06-01days on market $203,000 Active 10 DOM
-
2026-05-31days on market $203,000 Active 9 DOM
-
2026-05-22$203,000 Active
-
2025-06-06historical
-
2025-05-03price $271,000
-
2025-04-07status Active
-
2025-04-01status Pending
-
2025-01-27price $272,000
-
2025-01-09$320,000 Active
-
2022-08-11soldstatus $287,500 Closed 766-char remark
Show marketing remark (766 chars)
Super hard to find full brick ranch in a great location. They just don't build homes like this any more! This home has a 2 car attached garage & a large detached garage for your toys with a handyman's dream workshop. Relax outside on the open front patio in the front or the deck in the back. Inside features newer floors & loads of natural light throughout. The spacious eat-in kitchen is completely updated with solid surface countertops, new appliances & beautiful custom cabinets. The bathroom is also updated & this home has a surprising amount of closet space. Wonderful view of the large backyard from the 3 season sunroom. The backyard is fully fenced & lined with tress in the back. Additional open parking outside makes this a must see!
-
2022-07-12status Pending 766-char remark
Show marketing remark (766 chars)
Super hard to find full brick ranch in a great location. They just don't build homes like this any more! This home has a 2 car attached garage & a large detached garage for your toys with a handyman's dream workshop. Relax outside on the open front patio in the front or the deck in the back. Inside features newer floors & loads of natural light throughout. The spacious eat-in kitchen is completely updated with solid surface countertops, new appliances & beautiful custom cabinets. The bathroom is also updated & this home has a surprising amount of closet space. Wonderful view of the large backyard from the 3 season sunroom. The backyard is fully fenced & lined with tress in the back. Additional open parking outside makes this a must see!
-
2022-06-24$287,500 Active 766-char remark
Show marketing remark (766 chars)
Super hard to find full brick ranch in a great location. They just don't build homes like this any more! This home has a 2 car attached garage & a large detached garage for your toys with a handyman's dream workshop. Relax outside on the open front patio in the front or the deck in the back. Inside features newer floors & loads of natural light throughout. The spacious eat-in kitchen is completely updated with solid surface countertops, new appliances & beautiful custom cabinets. The bathroom is also updated & this home has a surprising amount of closet space. Wonderful view of the large backyard from the 3 season sunroom. The backyard is fully fenced & lined with tress in the back. Additional open parking outside makes this a must see!
ⓘ Source: listings_history table (triggers on properties + properties_extension) + one-shot
backfill from property_details.listing_events for pre-trigger history.
Tax reassessment forecast IN · Partial reset (capped growth)
- Current annual tax
- $2,951 · $246/mo
- Projected year-2 tax
- $2,951 · $246/mo
- Expected delta
- $0/yr ($0/mo · 0.0%)
ⓘ Screening estimate from a state-policy table — verify with the county assessor before closing.
Climate risk First Street
- Flood 1/10 Low FEMA zone X (unshaded) · 0% chance over 30 yrs
- Wildfire 1/10 Low
- Heat 3/10 Moderate 7 d/yr ≥101°F today · 19 d/yr by 30 yrs out
- Wind 2/10 Low 100% chance of damaging wind over 30 yrs
- Air quality 2/10 Low 1 unhealthy d/yr today · 2 by 30 yrs out
Nearby sold comps map
Loading sold comps map…
Walkable amenities ~0.75 mi
Loading nearby amenities…
Taxation est. · year 1
- Rental income
- $24,435
- − Mortgage interest
- −$11,371
- − Property taxes
- −$2,951
- − Insurance
- −$1,015
- − Repairs & maintenance
- −$1,955
- − Management
- −$1,955
- − Depreciation
- −$5,905
- Taxable loss
- −$716
- Est. tax savings @ 24.0%
- +$172
- After-tax cash flow
- $2,736/yr
For passive investors: Depreciation is non-cash, so a rental often shows a tax loss while cash-flowing — sheltering income. Rental losses are passive: they offset passive income freely, and up to $25,000/yr can offset ordinary (W-2) income if you actively participate and your MAGI is under $100k (phasing out to $0 by $150k); unused losses carry forward. On sale, claimed depreciation is recaptured at up to 25%, and gains may owe capital-gains tax (a 1031 exchange can defer both). Figures are a year-1 estimate at your 24.0% rate — not tax advice; consult a CPA.
Schools (NCES district)
- District
- Franklin Township Community School Corporation
- NCES district ID
- 1803750
- Math proficiency
- 42% ▼ -12.00%
- Reading proficiency
- 47% ▼ -6.00%
- Median HH income
- $67,825
- Composite
- 39.91/100
- National rank
- #3852
- State rank
- #87 of 301 in IN
Livability — Indianapolis city (balance)
No livability data for this city. (Only ~50 U.S. cities are tracked.)
Census & demographics
- Census place
- Indianapolis city (balance), IN
- County
- Marion County · 998,460 people
- City population
- 881,119
- Metro
- Indianapolis-Carmel-Anderson, IN
- Population (ZIP)
- 33,931
- Household income
- $100,331
- Rent vs Own
- Severe rent burden
- 567.0
Population outlook (Marion County) Hauer SSP2
- Today (2025)
- 1,025,572 people
- By 2030
- 1,065,727 · +3.9%
- By 2040
- 1,141,577 · +11.3%
- By 2050
- 1,208,920 · +17.9%
- By 2075
- 1,367,288 · +33.3%
- By 2100
- 1,438,201 · +40.2%
Race, ethnicity, and origin ACS 2023
- Neighborhood character
- Diverse neighborhood (Simpson 0.61)
- Race & ethnicity
- White 57% Black 24% Hispanic / Latino 9% Two or more races 9% Asian 4%
- Hispanic origin (detail)
- Mexican 6%
- Common ancestry
- Lithuanian 2% Slovak 2% Romanian 1%
- Foreign-born
- 7% · Canada, Philippines, China
- Languages at home
- 89% English-only · Spanish 6% Other Indo-European 2% Chinese 1%
Political lean MEDSL · Marion
- 2024 margin
- Strong D (+27.7) · D 63.0% · R 35.3% · Other 1.7%
- 2008→2024 swing
- -0.7pp no change · 2008: 28.4pp · 2024: 27.7pp
- All cycles
- 2024: D+27.7 2020: D+29.1 2016: D+22.8 2012: D+22.2 2008: D+28.4
Not yet ingested
- Civics
- —
Market trends
- HPI YoY
- ▼ -93.15%
- Current HPI
- 226.1965
- Rent YoY
- ▲ 6.11%
- Metro
- Indianapolis-Carmel-Anderson, IN
- State GDP YoY
- ▲ 2.90%
- F500 in state
- 18
Industry mix (Fortune 500 HQ in IN)
| Industry | F500 HQs | Revenue |
|---|---|---|
| Industrial Machinery | 2 | $37B |
|
||
| Healthcare | 1 | $177B |
|
||
| Pharmaceuticals | 1 | $45B |
|
||
| Metals / Steel | 1 | $18B |
|
||
| Agriculture | 1 | $17B |
|
||
| Packaging | 1 | $12B |
|
||
Price history
-29.4% since first listed10 events — show timeline
- 2026-05-22 Listed $203,000 MIBOR as Distributed by MLS Grid
- 2025-06-06 Listing Removed — MIBOR as Distributed by MLS Grid
- 2025-05-03 Price Changed $271,000 MIBOR as Distributed by MLS Grid
- 2025-04-07 Relisted — MIBOR as Distributed by MLS Grid
- 2025-04-01 Pending — MIBOR as Distributed by MLS Grid
- 2025-01-27 Price Changed $272,000 MIBOR as Distributed by MLS Grid
- 2025-01-09 Listed $320,000 MIBOR as Distributed by MLS Grid
- 2022-08-11 Sold (MLS) $287,500 MIBOR as Distributed by MLS Grid
- 2022-07-12 Pending — MIBOR as Distributed by MLS Grid
- 2022-06-24 Listed $287,500 MIBOR as Distributed by MLS Grid
Property tax history
+5.1%/yrLatest (2025): $2,951 · -3.9% YoY. Source: county tax records.
Cash-flow waterfall
monthlySold comps — $/sqft
last 12 mo · ≤1 miLoading sold comps…