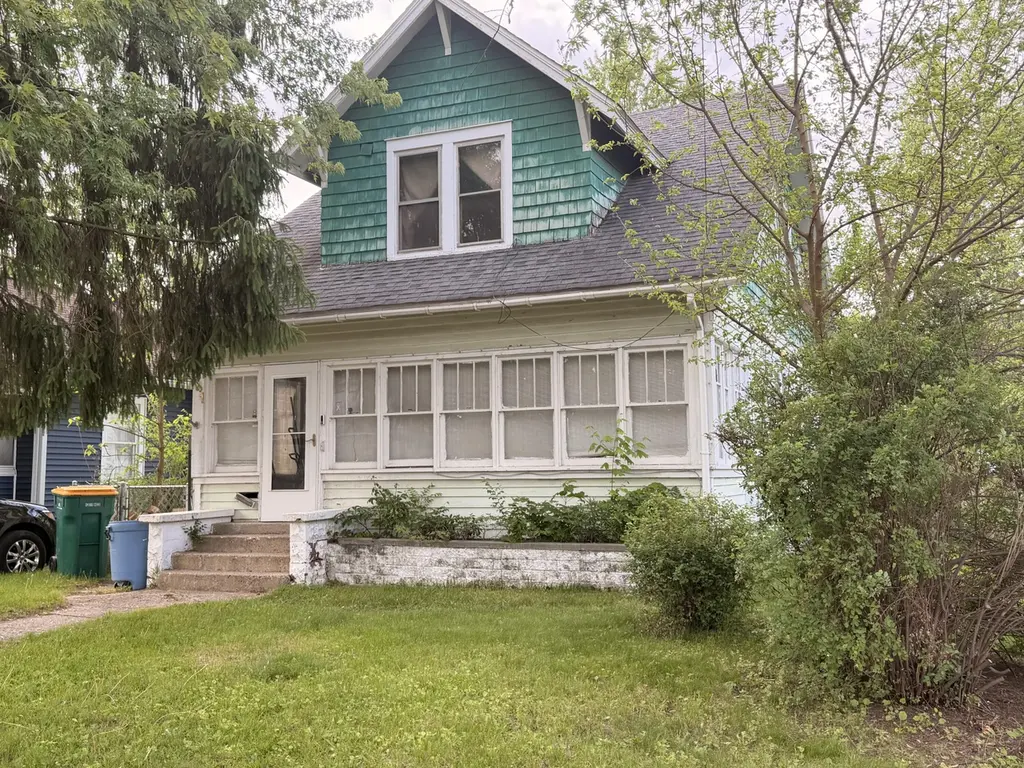
241 Post Ave · Battle Creek, MI
Flood risk 1/10 · Minimal
- FEMA flood zone
- X (unshaded)
- Chance of flooding over 30 yrs
- 0.0%
- Est. flood insurance / yr
- $473 – $860
Fire risk 2/10 · Minimal
- Est. fire insurance / yr
- $784 – $1,456
Heat risk 3/10 · Minor
- Hot days now (above 98°F)
- 7 days/yr
- Hot days in 30 yrs
- 16 days/yr
Wind risk 2/10 · Minimal
- Chance of severe wind over 30 yrs
- —
Air-quality risk 3/10 · Minor
- Unhealthy air days now
- 2 days/yr
- Unhealthy air days in 30 yrs
- 3 days/yr
Risk factors via First Street. Map © Google.
Why this score? — see what drove the B- grade
The composite is a weighted blend of 9 inputs, each scored 0–100. Each bar is that input's sub-score; the figure is the points it added to the 100-point composite (weight × sub-score).
- Cash flow +28.6/30.0
- ARV discount +13.9/15.0
- DSCR +10.0/10.0
- 1% rule +7.5/10.0
- Livability +3.7/5.0
- Rent growth +2.5/5.0
- Condition / age +2.5/5.0
- Schools +1.1/10.0
- Appreciation +0.0/10.0
$95,000
🖨 Deal sheet 📄 Offer letter ✓ Due diligence
Listing remarks MLS
Cozy corner-lot home featuring original woodwork, hardwood floors, a spacious living room, formal dining room, and an enclosed three-season sun porch. Fenced backyard on a quiet street. Long driveway located in the back of the home behind fence. A must-see! * Some visualization created with AI to show potential possibilities.
Key facts
- Corner-lot home
- Formal dining room
- Original woodwork
Tags
Property features AI
Exterior
- Utilities: Public water; Natural gas available and connected; Electricity available; Cable connected; High-speed internet
- Home design: Traditional style single-family home; Built in 1910; Living area approximately 1,118
- Construction: Shingle siding; Wood siding; Composition roof; Built in 1910
- Exterior features: Corner lot
Interior
- Kitchen: Oven; Range
- Bathrooms: 1 full bathroom
- Heating & cooling: Forced air heating; Natural gas available and connected; Electricity available
- Interior features: 3 total rooms; Full basement
- Laundry & utility: Washer; Dryer; Natural gas water heater
Neighborhood map
What this means for you Summary
Snapshot
- This is a 3-bed/1.0-bath single-family listed at $95k.
Deal economics
- At list price, monthly cash flow is $314 ($4k/yr) — positive.
- The deal already cash-flows at list — no discount required.
- Meets the 1% rule at list price ($1k rent vs $95k).
- Recommended offer: $94k (1.5% below list) — sets the bar for market timing.
- Cap rate 10.3% vs local median 5.2% in Battle Creek — top-decile yield for the area; either an underpriced asset or a hidden risk that comps aren't pricing in. Stress-test before assuming the spread holds.
Location & tenants
- Location reads 73/100 on livability (#198 in MI) — a middle-class / working-renter tenant base. Strengths: cost of living A+, housing A+, health & safety A+; Watch: schools C-, amenities C-, crime F.
- Battle Creek Public Schools (urban): math 8% / reading 19% proficiency, ranked #510 of 540 in MI (top 94%) — low school quality limits family demand, transient renter base, plan for 1-2y turnover; 75% free/reduced lunch — lower-income household profile, screen leases tightly.
- Market conditions: 135 active listings in the ZIP; 4 comparable units currently listed for rent nearby; rentals lingering (median 44d on market — plan ~5-8 weeks vacancy on turnover, expect pricing pressure); 100% of comp listings sitting > 30 days — soft ceiling on asking rent; 132 units permitted in Calhoun County in 2024 (0 in 5+ unit buildings).
Forward outlook
- Local home prices are declining (-3.0%/yr); year-one equity from $657 of loan paydown is wiped out by about $3k of value loss. Plan a longer hold.
- Calhoun County population projected at -16% by 2050 — secular population decline; favor cash flow + early exit over multi-decade hold.
- At projected returns (-3.0% appreciation + 3.0% rent growth), your $27k cash investment doubles in ~9 years — after that, you're playing with house money.
Negotiation context
- It's been on market 30 days — a 2% lower offer ($94k) is reasonable based on typical stale-listing flexibility.
- 26 sale attempts since 20y ago with the ask held roughly flat each time — persistent listings suggest the price (not the market) is what's stuck; bring a comps-based counter.
- Current owner paid $40k; list at $95k implies a 138% gain — meaningful room to come down on a strong offer.
Risks & watch-outs
- Watch-outs: built in 1910 — expect roof / HVAC / electrical / plumbing capex.
Questions for the listing agent
- Built in 1910 — when were the roof, HVAC, electrical panel, plumbing, and water heater last replaced?
- Is there a deadline driving the sale (1031 exchange, divorce, estate, relocation)? That informs how much negotiation room exists.
- Crime grade is F in this area — have there been break-ins, vandalism, or insurance claims at this property in the last 3 years? What carrier currently insures it and at what premium?
- What's the average days-on-market for RENTAL listings here right now (not sales)? A rising rental-DOM trend means longer vacancies and softer asking-rent achievability than the comps imply.
- What's the recent tenant-quality profile in this submarket — average credit score on applications, eviction rate, late-payment / NSF rate, and stable-employment percentage? A property-management company in the area should have these aggregated.
- How much new for-sale + rental construction is in the pipeline within 1–3 miles? Heavy new supply typically softens prices + rents 12–24 months out; constrained supply supports both.
Investment metrics
- 1% rule
- 1.25% ✓
- Cap rate
- 10.26%
- Cash-on-cash
- 14.18%
- DSCR
- 1.63
- GRM
- 6.7
CMA / ARV
- ARV (on-the-fly)
- $110,682
- Comps found
- 12
Show comp detail 12 sales within ~0.75 mi
| Address | Dist | Beds/Ba | Sqft | Sold | Price | $/sf | Match |
|---|---|---|---|---|---|---|---|
| 37 Inn Rd | 0.09mi | 3/1.0 | 1,227 (+10%) | 2mo | $105,000 | $86 | 78 |
| 175 Marjorie St | 0.21mi | 3/1.0 | 1,015 (-9%) | 1mo | $128,000 | $126 | 74 |
| 100 Post Ave | 0.36mi | 3/1.0 | 1,096 (-2%) | 10mo | $130,000 | $119 | 72 |
| 124 Lathrop Ave | 0.36mi | 3/1.0 | 1,183 (+6%) | 2mo | $101,000 | $85 | 72 |
| 111 Nelson St | 0.16mi | 4/1.0 (+1) | 1,265 (+13%) | 3mo | $119,900 | $95 | 63 |
| 100 Illinois St | 0.39mi | 3/1.0 | 1,208 (+8%) | 7mo | $119,900 | $99 | 63 |
| 214 Post Ave | 0.08mi | 2/1.0 (-1) | 973 (-13%) | 9mo | $86,000 | $88 | 62 |
| 174 Lathrop Ave | 0.23mi | 4/1.0 (+1) | 1,236 (+11%) | 6mo | $129,000 | $104 | 61 |
| 138 Rook St | 0.73mi | 2/1.0 (-1) | 1,100 (-2%) | 5mo | $110,000 | $100 | 54 |
| 20 Juniper St | 0.66mi | 3/1.5 | 1,012 (-10%) | 2mo | $32,500 | $32 | 50 |
| 230 Silver St | 0.70mi | 3/1.0 | 976 (-13%) | 4mo | $186,500 | $191 | 43 |
| 33 N Burdge St | 0.52mi | 2/1.5 (-1) | 1,260 (+13%) | 9mo | $32,500 | $26 | 40 |
Match score weights: distance 35% · size 25% · config 20% · recency 20%. Top-matched comps best support the ARV.
Projected returns pro-forma
-3.0% appreciation · 3.0% rent growth · sell at horizon
- IRR
- 4.5%
- Equity multiple
- 1.17×
- Total profit
- $4,615
- Equity at exit
- $14,165
- IRR
- 14.0%
- Equity multiple
- 2.12×
- Total profit
- $29,773
- Equity at exit
- $8,214
Cash invested: $26,600 (down + closing). Projections, not guarantees.
Landlord ↔ Tenant lean methodology
- Overall (STATE)
- 62 Landlord-Friendly
- State Michigan
- 62 Landlord-Friendly · EVEN
- County
- — inherits STATE
- City
- — inherits STATE
ZIP-level market 49014
- Home prices YoY
- -28.7%
- Active inventory
- 135
- Price-to-rent
- 6.7×
Monthly cashflow live
- Estimated rent
- $1,184 medium interval (Pro) →
- Mortgage (P&I)
- −$498
- Tax from tax record
- −$83 /mo · $1,000/yr
- Insurance
- −$40
- HOA
- −$0
- Vacancy / Maint / Mgmt
- −$249
- Net cashflow
- $314
Break-even live
UW: 25.0% down · 7.5% · 30yr · 1.5% tax · 5.0% vac · 8.0% maint · 8.0% mgmt
Financing live
Cash to close
- Down payment
- $23,750
- Closing costs
- $2,850
- Reserves months
- —
- Total cash needed
- —
Loan-product check · same deal, 3 products live
Conventional
25% down · 7.5% · 30yr
- Down + closing
- —
- Monthly P&I
- —
- Monthly cashflow
- —
- DSCR
- —
- Eligible?
- —
Personal DTI + credit; lowest rate.
DSCR
20% down · 8.5% · 30yr
- Down + closing
- —
- Monthly P&I
- —
- Monthly cashflow
- —
- DSCR
- —
- Eligible?
- —
No personal income docs; deal must DSCR.
Hard money
10% down · 12.0% · 12mo
- Down + closing
- —
- Monthly P&I
- —
- Monthly cashflow
- —
- DSCR
- —
- Eligible?
- —
Short-term bridge; refi at stabilization.
Rent comps 4 comps
| Address | Beds | Baths | Sqft | Rent | $/sqft | DOM | Units | Dist |
|---|---|---|---|---|---|---|---|---|
| 744 E Michigan Ave Unit 11 Battle Creek, MI | 2.0 | 1.0 | 800 | $1,050 | $1.31 | 43d | 1 | 0.41mi |
| 1975 Columbia Ave E Battle Creek, MI | 1.0–3.0 | 1.0 | 761 | $1,109 | $1.46 | 43d | 16 | 0.45mi |
| 226 Taft Ct Battle Creek, MI | 1.0–2.0 | 1.0 | 762 | $985 | $1.29 | 43d | 8 | 0.93mi |
| 98 Van Buren St E Battle Creek, MI | 2.0 | 1.0 | 1118 | $950 | $0.85 | 43d | 1 | 1.19mi |
Listing history 50 events
-
2026-06-19days on market $95,000 Active 30 DOM
-
2026-06-18days on market $95,000 Active 29 DOM
-
2026-06-17days on market $95,000 Active 28 DOM
-
2026-06-16days on market $95,000 Active 27 DOM
-
2026-06-15days on market $95,000 Active 26 DOM
-
2026-06-14days on market $95,000 Active 24 DOM
-
2026-06-13days on market $95,000 Active 23 DOM
-
2026-06-10days on market $95,000 Active 21 DOM
-
2026-06-09days on market $95,000 Active 20 DOM
-
2026-06-08days on market $95,000 Active 19 DOM
-
2026-06-07days on market $95,000 Active 18 DOM
-
2026-06-05days on market $95,000 Active 15 DOM
-
2026-06-02days on market $95,000 Active 13 DOM
-
2026-06-01days on market $95,000 Active 12 DOM
-
2026-05-31days on market $95,000 Active 11 DOM
-
2026-05-30days on market $95,000 Active 10 DOM
-
2026-05-20$95,000 Active
Show marketing remark (327 chars)
Cozy corner-lot home featuring original woodwork, hardwood floors, a spacious living room, formal dining room, and an enclosed three-season sun porch. Fenced backyard on a quiet street. Long driveway located in the back of the home behind fence. A must-see! * Some visualization created with AI to show potential possibilities.
-
2026-05-20$95,000 Active 327-char remark
Show marketing remark (327 chars)
Cozy corner-lot home featuring original woodwork, hardwood floors, a spacious living room, formal dining room, and an enclosed three-season sun porch. Fenced backyard on a quiet street. Long driveway located in the back of the home behind fence. A must-see! * Some visualization created with AI to show potential possibilities.
-
2025-04-01historical
-
2025-03-08status Active
-
2025-03-07status Active
-
2025-02-18historical
-
2025-02-18historical
-
2025-02-18historical
-
2025-02-14$85,000
-
2025-02-14$85,000
-
2025-02-01historical
-
2025-02-01historical
-
2025-01-07$95,000 Active
-
2025-01-07$95,000 Active
-
2025-01-01historical
-
2025-01-01historical
-
2024-10-31status Active
-
2024-10-31status Active
-
2024-10-28status Pending
-
2024-10-28status Pending
-
2024-09-27$95,000 Active
-
2024-09-27$95,000 Active
-
2018-06-14soldstatus $40,000
-
2018-05-25soldstatus $40,000
-
2018-05-25soldstatus $40,000 Sold
-
2018-04-16status Pending
-
2018-03-06$47,900
-
2018-03-06$47,900 Active
-
2018-03-06$47,900
-
2018-03-01historical
-
2018-02-28historical
-
2017-10-25$47,900 Active
-
2017-10-24historical
ⓘ Source: listings_history table (triggers on properties + properties_extension) + one-shot
backfill from property_details.listing_events for pre-trigger history.
Tax reassessment forecast MI · Partial reset (capped growth)
- Current annual tax
- $1,000 · $83/mo
- Projected year-2 tax
- $1,232 · $103/mo
- Expected delta
- +$231/yr (+$19/mo · 23.1%)
ⓘ Screening estimate from a state-policy table — verify with the county assessor before closing.
Climate risk First Street
- Flood 1/10 Low FEMA zone X (unshaded) · 0% chance over 30 yrs
- Wildfire 2/10 Low
- Heat 3/10 Moderate 7 d/yr ≥98°F today · 16 d/yr by 30 yrs out
- Wind 2/10 Low
- Air quality 3/10 Moderate 2 unhealthy d/yr today · 3 by 30 yrs out
Nearby sold comps map
Loading sold comps map…
Walkable amenities ~0.75 mi
Loading nearby amenities…
Taxation est. · year 1
- Rental income
- $14,208
- − Mortgage interest
- −$5,321
- − Property taxes
- −$1,000
- − Insurance
- −$475
- − Repairs & maintenance
- −$1,137
- − Management
- −$1,137
- − Depreciation
- −$2,764
- Taxable income
- $2,374
- Est. tax owed @ 24.0%
- −$570
- After-tax cash flow
- $3,201/yr
For passive investors: Depreciation is non-cash, so a rental often shows a tax loss while cash-flowing — sheltering income. Rental losses are passive: they offset passive income freely, and up to $25,000/yr can offset ordinary (W-2) income if you actively participate and your MAGI is under $100k (phasing out to $0 by $150k); unused losses carry forward. On sale, claimed depreciation is recaptured at up to 25%, and gains may owe capital-gains tax (a 1031 exchange can defer both). Figures are a year-1 estimate at your 24.0% rate — not tax advice; consult a CPA.
Schools (NCES district)
- District
- Battle Creek Public Schools
- NCES district ID
- 2600005
- Math proficiency
- 8% ▼ -2.00%
- Reading proficiency
- 19% ▬ 0.00%
- Median HH income
- $31,697
- Composite
- 10.73/100
- National rank
- #9769
- State rank
- #510 of 540 in MI
Livability — Battle Creek
- Score
- 73/100
- State rank
- #198
- US rank
- #5031
Category grades
Schools grade is shown separately in the Schools card above.
Census & demographics
- Census place
- Battle Creek, MI
- County
- Calhoun County · 91,590 people
- City population
- 91,590
- Metro
- Battle Creek, MI
- Population (ZIP)
- 21,980
- Household income
- $69,009
- Rent vs Own
- Severe rent burden
- 416.0
Population outlook (Calhoun County) Hauer SSP2
- Today (2025)
- 130,157 people
- By 2030
- 126,691 · -2.7%
- By 2040
- 118,517 · -8.9%
- By 2050
- 109,855 · -15.6%
- By 2075
- 90,486 · -30.5%
- By 2100
- 70,766 · -45.6%
Race, ethnicity, and origin ACS 2023
- Neighborhood character
- Predominantly White (78%)
- Race & ethnicity
- White 78% Black 9% Two or more races 8% Hispanic / Latino 6% Asian 1%
- Hispanic origin (detail)
- Mexican 5%
- Common ancestry
- Romanian 4% Iranian 3% Slovak 2%
- Foreign-born
- 4% · Canada
- Languages at home
- 92% English-only · Spanish 4% Russian/Polish/Slavic 1%
Political lean MEDSL · Calhoun
- 2024 margin
- R (+14.1) · D 42.3% · R 56.4% · Other 1.3%
- 2008→2024 swing
- -23.4pp toward R · 2008: 9.4pp · 2024: -14.1pp
- All cycles
- 2024: R+14.1 2020: R+11.1 2016: R+12.5 2012: D+1.6 2008: D+9.4
Not yet ingested
- Civics
- —
Market trends
- HPI YoY
- ▼ -97.29%
- Current HPI
- 241.3422
- Rent YoY
- —
- Metro
- Battle Creek, MI
- State GDP YoY
- ▲ 1.37%
- F500 in state
- 28
Industry mix (Fortune 500 HQ in MI)
| Industry | F500 HQs | Revenue |
|---|---|---|
| Automotive Parts | 3 | $48B |
|
||
| Automotive | 2 | $372B |
|
||
| Chemicals | 1 | $45B |
|
||
| Automotive Retail | 1 | $29B |
|
||
| Healthcare / Medical Devices | 1 | $23B |
|
||
| Automotive Technology | 1 | $20B |
|
||
Price history
+58.6% since first listed51 events — show timeline
- 2026-05-20 Listed $95,000 REALCOMP
- 2026-05-20 Listed $95,000 MiRealSource-MiMLS
- 2026-05-20 Listed $95,000 SW Michigan MLS
- 2025-04-01 Listing Removed — MiRealSource-MiMLS
- 2025-03-08 Relisted — REALCOMP
- 2025-03-07 Relisted — MiRealSource-MiMLS
- 2025-02-18 Listing Removed — REALCOMP
- 2025-02-18 Listing Removed — REALCOMP
- 2025-02-18 Listing Removed — MiRealSource-MiMLS
- 2025-02-14 Listed $85,000 REALCOMP
- 2025-02-14 Listed $85,000 MiRealSource-MiMLS
- 2025-02-01 Listing Removed — REALCOMP
- 2025-02-01 Listing Removed — MiRealSource-MiMLS
- 2025-01-07 Listed $95,000 REALCOMP
- 2025-01-07 Listed $95,000 MiRealSource-MiMLS
- 2025-01-01 Listing Removed — REALCOMP
- 2025-01-01 Listing Removed — MiRealSource-MiMLS
- 2024-10-31 Relisted — REALCOMP
- 2024-10-31 Relisted — MiRealSource-MiMLS
- 2024-10-28 Pending — REALCOMP
- 2024-10-28 Pending — MiRealSource-MiMLS
- 2024-09-27 Listed $95,000 MiRealSource-MiMLS
- 2024-09-27 Listed $95,000 REALCOMP
- 2018-06-14 Sold (Public Records) $40,000 Public Records
- 2018-05-25 Sold (MLS) $40,000 SW Michigan MLS
- 2018-05-25 Sold (MLS) $40,000 REALCOMP
- 2018-04-16 Pending — SW Michigan MLS
- 2018-03-06 Listed $47,900 MiRealSource-MiMLS
- 2018-03-06 Listed $47,900 SW Michigan MLS
- 2018-03-06 Listed $47,900 REALCOMP
- 2018-03-01 Listing Removed — SW Michigan MLS
- 2018-02-28 Listing Removed — REALCOMP
- 2017-10-25 Listed $47,900 SW Michigan MLS
- 2017-10-24 Listing Removed — SW Michigan MLS
- 2017-10-24 Listed $47,900 REALCOMP
- 2017-10-24 Listing Removed — REALCOMP
- 2017-08-09 Listed $49,900 SW Michigan MLS
- 2017-08-09 Listed $49,900 REALCOMP
- 2017-08-01 Listing Removed — SW Michigan MLS
- 2017-07-31 Listing Removed — REALCOMP
- 2017-03-01 Listed $49,900 SW Michigan MLS
- 2017-03-01 Listed $49,900 REALCOMP
- 2016-12-01 Listing Removed — SW Michigan MLS
- 2016-11-30 Listing Removed — REALCOMP
- 2016-10-28 Price Changed $49,900 SW Michigan MLS
- 2016-03-03 Listed $51,900 SW Michigan MLS
- 2016-03-02 Listed $49,900 REALCOMP
- 2006-03-01 Listing Removed — SW Michigan MLS
- 2006-03-01 Listing Removed — REALCOMP
- 2006-01-04 Listed $59,900 SW Michigan MLS
- 2006-01-04 Listed $59,900 REALCOMP
Property tax history
-0.1%/yrLatest (2025): $1,000 · -18.9% YoY. Source: county tax records.
Cash-flow waterfall
monthlySold comps — $/sqft
last 12 mo · ≤1 miLoading sold comps…