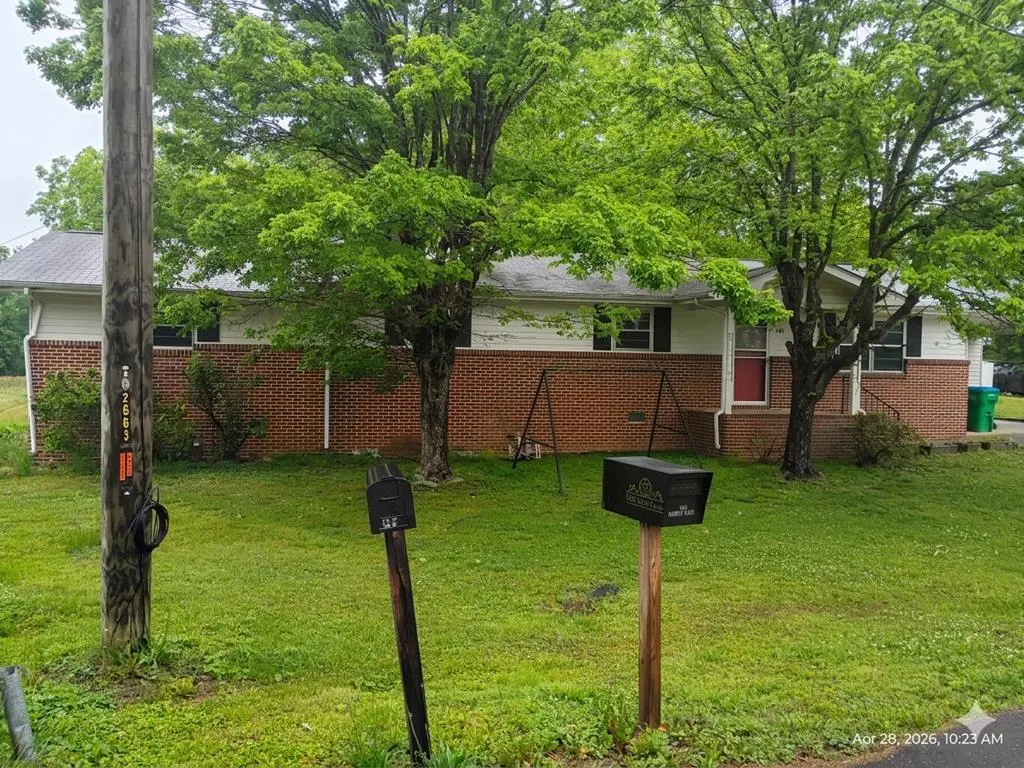
141 Cherry Street St · Tunnel Hill, GA
Flood risk 1/10 · Minimal
- FEMA flood zone
- X (unshaded)
- Chance of flooding over 30 yrs
- 0.0%
- Est. flood insurance / yr
- $507 – $1,088
Fire risk 4/10 · Minor
- Est. fire insurance / yr
- $963 – $1,789
Heat risk 6/10 · Moderate
- Hot days now (above 105°F)
- 7 days/yr
- Hot days in 30 yrs
- 19 days/yr
Wind risk 4/10 · Minor
- Chance of severe wind over 30 yrs
- 10.0%
Air-quality risk 3/10 · Minor
- Unhealthy air days now
- 2 days/yr
- Unhealthy air days in 30 yrs
- 2 days/yr
Risk factors via First Street. Map © Google.
Why this score? — see what drove the D grade
The composite is a weighted blend of 9 inputs, each scored 0–100. Each bar is that input's sub-score; the figure is the points it added to the 100-point composite (weight × sub-score).
- Cash flow +12.9/30.0
- ARV discount +12.4/15.0
- DSCR +3.9/10.0
- Livability +3.4/5.0
- Schools +3.0/10.0
- 1% rule +2.9/10.0
- Rent growth +2.5/5.0
- Condition / age +2.5/5.0
- Appreciation +0.0/10.0
$215,000
🖨 Deal sheet (PDF) 📄 Offer letter ✓ Due diligence
Listing remarks MLS
Situated on Cherry Street in Historical Tunnel Hill, Perfect home for a large family, 4 bedroom 2 bath, with Living Room, Dining Room, , Large Kitchen and office, New LVT with jack and Jill bath, Natural Gas Heat and Gas Logs, Wood fenced in back yard and out building. Large Corner Lot USDA FHA VA welcome
Key facts
- Large corner lot
- Natural gas heat
- Large kitchen
Tags
Neighborhood map
What this means for you Summary
Snapshot
- This is a 4-bed/1.5-bath single-family listed at $215k.
Deal economics
- At list price, monthly cash flow is $-16 ($-193/yr) — negative.
- To cash-flow at today's rent, offer at most $212k (1.3% below list).
- To meet the 1% rule (rent ≥ 1% of price), the offer needs to be $169k (21.4% below list).
- Recommended offer: $169k (21.4% below list) — sets the bar for 1% rule.
- Cap rate 6.2% vs local median 4.0% in Tunnel Hill — top-decile yield for the area; either an underpriced asset or a hidden risk that comps aren't pricing in. Stress-test before assuming the spread holds.
Location & tenants
- Location reads 67/100 on livability (#164 in GA) — a middle-class / working-renter tenant base. Strengths: crime A+, cost of living A+, housing A+; Watch: amenities F, commute F, health & safety F.
- Whitfield County (rural): math 37% / reading 34% proficiency, ranked #62 of 174 in GA (top 36%) — families likely to look elsewhere, expect single-tenant / working-renter base with shorter leases; 61% free/reduced lunch — lower-income household profile, screen leases tightly.
- Zoned schools: Tunnel Hill Elementary School (math 57% / reading 32%, grade F, #336 of 1,228 statewide, top 29%, 310 students, 55% FRL); Westside Middle School (math 46% / reading 51%, grade C-, #75 of 470 statewide, top 17%, 392 students, 59% FRL); Northwest Whitfield County High School (math 29% / reading 34%, grade F, #122 of 424 statewide, top 30%, 1,219 students, 49% FRL).
- Market conditions: 64 active listings in the ZIP; 374 units permitted in Whitfield County in 2024 (35 in 5+ unit buildings).
Forward outlook
- Local home prices are declining (-3.0%/yr); year-one equity from $1k of loan paydown is wiped out by about $6k of value loss. Plan a longer hold.
- Whitfield County population projected at +3% by 2050 — modest demand growth; plan on rents tracking national, not racing it.
Negotiation context
- It's been on market 56 days — a 3% lower offer ($209k) is reasonable based on typical stale-listing flexibility.
- Current owner paid $70k; list at $215k implies a 207% gain — meaningful room to come down on a strong offer.
Risks & watch-outs
- Climate carrying-cost: extreme-heat days projected 7→19/yr by 2055 (HVAC capex compounding) — expect insurance premiums to compound above CPI over the hold.
Questions for the listing agent
- What do current leases actually rent for vs. the listed asking? Can we see a recent rent roll and the last 12 months of T-12 income?
- It's been on market 56 days. Have you received any prior offers? Is the seller open to a 21% concession, seller financing, or rate buy-down credit?
- Built in 1970 — when were the roof, HVAC, electrical panel, plumbing, and water heater last replaced?
- Is there a deadline driving the sale (1031 exchange, divorce, estate, relocation)? That informs how much negotiation room exists.
- Schools are D-rated, which usually means shorter tenancies and higher turnover. Who's the typical renter profile here, and what's been the actual vacancy rate?
- The area grade is low — what's the realistic commute time and amenity access for the typical tenant pool here? Any planned neighborhood developments (good or bad) we should know about?
- What's the average days-on-market for RENTAL listings here right now (not sales)? A rising rental-DOM trend means longer vacancies and softer asking-rent achievability than the comps imply.
- What's the recent tenant-quality profile in this submarket — average credit score on applications, eviction rate, late-payment / NSF rate, and stable-employment percentage? A property-management company in the area should have these aggregated.
- How much new for-sale + rental construction is in the pipeline within 1–3 miles? Heavy new supply typically softens prices + rents 12–24 months out; constrained supply supports both.
Investment metrics
- 1% rule
- 0.79% ✗
- Cap rate
- 6.20%
- Cash-on-cash
- -0.32%
- DSCR
- 0.99
- GRM
- 10.6
CMA / ARV
- ARV (median comp)
- $240,988
- List price
- $215,000
- Delta
- -10.78%
- Verdict
- UNDERPRICED
- Comps
- 20 within 1.0 mi
Show comp detail 6 sales within ~0.75 mi
| Address | Dist | Beds/Ba | Sqft | Sold | Price | $/sf | Match |
|---|---|---|---|---|---|---|---|
| 203 S Cherry St | 0.31mi | 4/3.0 | 1,884 (-0%) | 4mo | $325,000 | $173 | 76 |
| 423 Hasty Dr | 0.41mi | 3/2.0 (-1) | 1,830 (-3%) | 13mo | $289,900 | $158 | 58 |
| 414 Regal Dr | 0.46mi | 4/2.0 | 1,747 (-8%) | 9mo | $210,000 | $120 | 57 |
| 400 Crawford Ter | 0.31mi | 3/2.0 (-1) | 1,653 (-12%) | 6mo | $213,000 | $129 | 53 |
| 507 Harper Road Rd | 0.56mi | 3/2.0 (-1) | 2,077 (+10%) | 15mo | $255,000 | $123 | 38 |
| 107 Lakeshore Drive Dr S | 0.49mi | 3/2.0 (-1) | 1,610 (-15%) | 23mo | $252,000 | $157 | 26 |
Match score weights: distance 35% · size 25% · config 20% · recency 20%. Top-matched comps best support the ARV.
Projected returns pro-forma
-3.0% appreciation · 3.0% rent growth · sell at horizon
- IRR
- -16.9%
- Equity multiple
- 0.40×
- Total profit
- $-35,920
- Equity at exit
- $32,057
- IRR
- -8.8%
- Equity multiple
- 0.45×
- Total profit
- $-32,828
- Equity at exit
- $18,589
Cash invested: $60,200 (down + closing). Projections, not guarantees.
Landlord ↔ Tenant lean methodology
- Overall (STATE)
- 90 Strongly Landlord-Friendly
- State Georgia
- 90 Strongly Landlord-Friendly · R+3
- County
- — inherits STATE
- City
- — inherits STATE
ZIP-level market 30755
- Home prices YoY
- -22.7%
- Active inventory
- 64
- Price-to-rent
- 10.6×
Monthly cashflow live
- Estimated rent
- $1,690 medium interval (Pro) →
- Mortgage (P&I)
- −$1,127
- Tax from tax record
- −$134 /mo · $1,611/yr
- Insurance
- −$90
- HOA
- −$0
- Vacancy / Maint / Mgmt
- −$355
- Net cashflow
- $-16
Break-even live
Sensitivity live
| Price | -10% $106 | -5% $45 | +0% $-16 | +5% $-77 | +10% $-138 |
|---|---|---|---|---|---|
| Rent | -10% $-150 | -5% $-83 | +0% $-16 | +5% $51 | +10% $117 |
| Rate | -1.0pp $92 | -0.5pp $39 | base $-16 | +0.5pp $-72 | +1.0pp $-128 |
UW: 25.0% down · 7.5% · 30yr · 1.5% tax · 5.0% vac · 8.0% maint · 8.0% mgmt
Financing live
Cash to close
- Down payment
- $53,750
- Closing costs
- $6,450
- Reserves months
- —
- Total cash needed
- —
Loan-product check · same deal, 3 products live
Conventional
25% down · 7.5% · 30yr
- Down + closing
- —
- Monthly P&I
- —
- Monthly cashflow
- —
- DSCR
- —
- Eligible?
- —
Personal DTI + credit; lowest rate.
DSCR
20% down · 8.5% · 30yr
- Down + closing
- —
- Monthly P&I
- —
- Monthly cashflow
- —
- DSCR
- —
- Eligible?
- —
No personal income docs; deal must DSCR.
Hard money
10% down · 12.0% · 12mo
- Down + closing
- —
- Monthly P&I
- —
- Monthly cashflow
- —
- DSCR
- —
- Eligible?
- —
Short-term bridge; refi at stabilization.
Listing history 13 events
-
2026-06-05days on market $215,000 Active 56 DOM
-
2026-06-03days on market $215,000 Active 55 DOM
-
2026-06-03price $215,000 Active 54 DOM
-
2026-06-02days on market $222,900 Active 54 DOM
-
2026-06-01days on market $222,900 Active 53 DOM
-
2026-05-31days on market $222,900 Active 52 DOM
-
2026-05-30days on market $222,900 Active 51 DOM
-
2026-05-19price $232,900 308-char remark
Show marketing remark (308 chars)
Situated on Cherry Street in Historical Tunnel Hill, Perfect home for a large family, 4 bedroom 2 bath, with Living Room, Dining Room, , Large Kitchen and office, New LVT with jack and Jill bath, Natural Gas Heat and Gas Logs, Wood fenced in back yard and out building. Large Corner Lot USDA FHA VA welcome
-
2026-05-08price $243,500 308-char remark
Show marketing remark (308 chars)
Situated on Cherry Street in Historical Tunnel Hill, Perfect home for a large family, 4 bedroom 2 bath, with Living Room, Dining Room, , Large Kitchen and office, New LVT with jack and Jill bath, Natural Gas Heat and Gas Logs, Wood fenced in back yard and out building. Large Corner Lot USDA FHA VA welcome
-
2026-04-27price $249,900 308-char remark
Show marketing remark (308 chars)
Situated on Cherry Street in Historical Tunnel Hill, Perfect home for a large family, 4 bedroom 2 bath, with Living Room, Dining Room, , Large Kitchen and office, New LVT with jack and Jill bath, Natural Gas Heat and Gas Logs, Wood fenced in back yard and out building. Large Corner Lot USDA FHA VA welcome
-
2026-04-20price $269,900 308-char remark
Show marketing remark (308 chars)
Situated on Cherry Street in Historical Tunnel Hill, Perfect home for a large family, 4 bedroom 2 bath, with Living Room, Dining Room, , Large Kitchen and office, New LVT with jack and Jill bath, Natural Gas Heat and Gas Logs, Wood fenced in back yard and out building. Large Corner Lot USDA FHA VA welcome
-
2026-04-09$289,900 Active 308-char remark
Show marketing remark (308 chars)
Situated on Cherry Street in Historical Tunnel Hill, Perfect home for a large family, 4 bedroom 2 bath, with Living Room, Dining Room, , Large Kitchen and office, New LVT with jack and Jill bath, Natural Gas Heat and Gas Logs, Wood fenced in back yard and out building. Large Corner Lot USDA FHA VA welcome
-
2017-01-09soldstatus $70,000
ⓘ Source: listings_history table (triggers on properties + properties_extension) + one-shot
backfill from property_details.listing_events for pre-trigger history.
Tax reassessment forecast GA · Resets to sale price
- Current annual tax
- $1,611 · $134/mo
- Projected year-2 tax
- $1,978 · $165/mo
- Expected delta
- +$367/yr (+$31/mo · 22.8%)
ⓘ Screening estimate from a state-policy table — verify with the county assessor before closing.
Climate risk First Street
- Flood 1/10 Low FEMA zone X (unshaded) · 0% chance over 30 yrs
- Wildfire 4/10 Moderate
- Heat 6/10 Major 7 d/yr ≥105°F today · 19 d/yr by 30 yrs out
- Wind 4/10 Moderate 10% chance of damaging wind over 30 yrs
- Air quality 3/10 Moderate 2 unhealthy d/yr today · 2 by 30 yrs out
Nearby sold comps map
Loading sold comps map…
Walkable amenities ~0.75 mi
Loading nearby amenities…
Taxation est. · year 1
- Rental income
- $20,282
- − Mortgage interest
- −$12,043
- − Property taxes
- −$1,611
- − Insurance
- −$1,075
- − Repairs & maintenance
- −$1,623
- − Management
- −$1,623
- − Depreciation
- −$6,255
- Taxable loss
- −$3,947
- Est. tax savings @ 24.0%
- +$947
- After-tax cash flow
- $754/yr
For passive investors: Depreciation is non-cash, so a rental often shows a tax loss while cash-flowing — sheltering income. Rental losses are passive: they offset passive income freely, and up to $25,000/yr can offset ordinary (W-2) income if you actively participate and your MAGI is under $100k (phasing out to $0 by $150k); unused losses carry forward. On sale, claimed depreciation is recaptured at up to 25%, and gains may owe capital-gains tax (a 1031 exchange can defer both). Figures are a year-1 estimate at your 24.0% rate — not tax advice; consult a CPA.
Schools (NCES district)
- District
- Whitfield County
- NCES district ID
- 1305700
- Math proficiency
- 37% ▼ -6.00%
- Reading proficiency
- 34% ▼ -9.00%
- Median HH income
- $44,296
- Composite
- 30.24/100
- National rank
- #6290
- State rank
- #62 of 174 in GA
Livability — Tunnel Hill
- Score
- 67/100
- State rank
- #164
- US rank
- #10419
Category grades
Schools grade is shown separately in the Schools card above.
Census & demographics
- Population (ZIP)
- 10,768
Population outlook (Whitfield County) Hauer SSP2
- Today (2025)
- 107,770 people
- By 2030
- 108,737 · +0.9%
- By 2040
- 110,260 · +2.3%
- By 2050
- 111,205 · +3.2%
- By 2075
- 113,014 · +4.9%
- By 2100
- 112,775 · +4.6%
Race, ethnicity, and origin ACS 2023
- Neighborhood character
- Predominantly White (78%)
- Race & ethnicity
- White 78% Hispanic / Latino 17% Two or more races 7% Black 2% Native American 1%
- Hispanic origin (detail)
- Mexican 10%
- Common ancestry
- Lithuanian 2% Italian 2% Slovak 1%
- Foreign-born
- 4% · Canada
- Languages at home
- 88% English-only · Spanish 12%
Political lean MEDSL · Whitfield
- 2024 margin
- Solid R (+44.5) · D 27.5% · R 72.0%
- 2008→2024 swing
- -4.5pp toward R · 2008: -40.0pp · 2024: -44.5pp
- All cycles
- 2024: R+44.5 2020: R+40.7 2016: R+44.8 2012: R+45.1 2008: R+40.0
Not yet ingested
- Civics
- —
Market trends
- HPI YoY
- ▼ -84.96%
- Current HPI
- 289.9653
- Rent YoY
- —
- Metro
- —
- State GDP YoY
- ▲ 2.66%
- F500 in state
- 28
Industry mix (Fortune 500 HQ in GA)
| Industry | F500 HQs | Revenue |
|---|---|---|
| Paper / Packaging | 2 | $29B |
|
||
| Retail | 1 | $160B |
|
||
| Transportation / Logistics | 1 | $91B |
|
||
| Airlines | 1 | $62B |
|
||
| Consumer Goods | 1 | $47B |
|
||
| Utilities | 1 | $25B |
|
||
Price history
+232.7% since first listed6 events — show timeline
- 2026-05-19 Price Changed $232,900 CCARMLS
- 2026-05-08 Price Changed $243,500 CCARMLS
- 2026-04-27 Price Changed $249,900 CCARMLS
- 2026-04-20 Price Changed $269,900 CCARMLS
- 2026-04-09 Listed $289,900 CCARMLS
- 2017-01-09 Sold (Public Records) $70,000 Public Records
Property tax history
+25.4%/yrLatest (2025): $1,611 · +11.7% YoY. Source: county tax records.
Cash-flow waterfall
monthlySold comps — $/sqft
last 12 mo · ≤1 miLoading sold comps…