208 W Houston St · Cloverport, KY
Flood risk No data
- FEMA flood zone
- —
- Chance of flooding over 30 yrs
- —
- Est. flood insurance / yr
- —
Fire risk No data
- Est. fire insurance / yr
- —
Heat risk No data
- Hot days now (above threshold)
- —
- Hot days in 30 yrs
- —
Wind risk No data
- Chance of severe wind over 30 yrs
- —
Air-quality risk No data
- Unhealthy air days now
- —
- Unhealthy air days in 30 yrs
- —
Risk factors via First Street. Map © Google.
Why this score? — see what drove the B- grade
The composite is a weighted blend of 9 inputs, each scored 0–100. Each bar is that input's sub-score; the figure is the points it added to the 100-point composite (weight × sub-score).
- Cash flow +24.9/30.0
- Appreciation +10.0/10.0
- DSCR +8.1/10.0
- ARV discount +7.5/15.0
- 1% rule +6.5/10.0
- Schools +3.9/10.0
- Livability +3.1/5.0
- Rent growth +2.5/5.0
- Condition / age +2.5/5.0
$99,900
🖨 Deal sheet (PDF) 📄 Offer letter ✓ Due diligence
Listing remarks
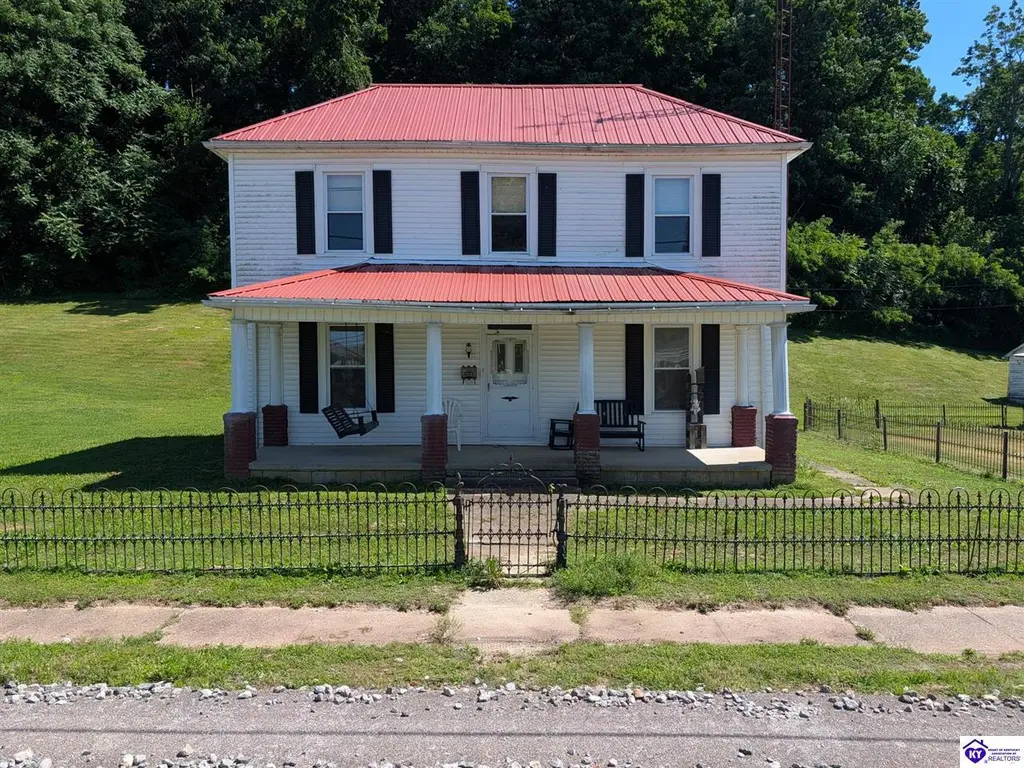
Historic 1930's Charm Meets Endless Potential On Sprawling 1 Acre Lot! Bring your vision to life at 208 W Houston Street! Nestled on a generous 1-acre lot in Cloverport, this 1,850-sq-ft, two-story home is brimming with classic character and possibilities for the right buyer. Start your mornings relaxing on the expansive, welcoming front porch. The main floor features a dedicated formal dining room perfect for entertaining and a large kitchen that offers a fantastic blank canvas for your dream culinary setup. The home's layout includes three comfortably sized bedrooms and one full bathroom, providing a solid foundation for your modern updates. Outside, the property truly shines for hobbyist
Key facts
- Sprawling yard
- Large kitchen
- Sprawling 1 acre lot
Tags
Property features AI
Finance
- Other: Accessible full bathroom; Accessible approach with ramp
Exterior
- Parking: Attached garage with 4 spaces
- Utilities: Public water; Public sewer
- Home design: Farm property; 2-story home
- Construction: Vinyl siding; Metal roof; Crawl space foundation; Built as residential farm
- Exterior features: Covered porch; Fenced yard; Shed(s); Workshop
Interior
- Flooring: Carpet; Laminate
- Bathrooms: 1 full bathroom (main level)
- Heating & cooling: Space heater; Ceiling fan(s); Window unit(s)
- Interior features: Ceiling fan(s)
- Laundry & utility: Dedicated laundry room; Gas water heater
Neighborhood map
What this means for you Summary
Snapshot
- This is a 3-bed/1.0-bath single-family listed at $100k.
Deal economics
- At list price, monthly cash flow is $214 ($3k/yr) — positive.
- The deal already cash-flows at list — no discount required.
- Meets the 1% rule at list price ($1k rent vs $100k).
- Recommended offer: $98k (1.5% below list) — sets the bar for market timing.
Location & tenants
- Location reads 61/100 on livability (#373 in KY) — a middle-class / working-renter tenant base. Strengths: crime A+, cost of living A+, housing A+; Watch: schools D+, amenities F, commute F.
- Cloverport Independent (rural): math 40% / reading 50% proficiency, ranked #132 of 173 in KY (top 76%) — families likely to look elsewhere, expect single-tenant / working-renter base with shorter leases.
- Market conditions: 17 active listings in the ZIP; 9 units permitted in Breckinridge County in 2024 (0 in 5+ unit buildings).
Forward outlook
- In year one you build about $11k of equity ($691 loan paydown + $10k appreciation (10.0% local appreciation)).
- Breckinridge County population projected at -15% by 2050 — secular population decline; favor cash flow + early exit over multi-decade hold.
- At projected returns (10.0% appreciation + 3.0% rent growth), your $28k cash investment doubles in ~3 years — after that, you're playing with house money.
- By year 4, paydown + projected appreciation supports a ~$38k cash-out refi (75% LTV) — recoverable capital for the next deal without selling this one.
Negotiation context
- It's been on market 17 days — a 2% lower offer ($98k) is reasonable based on typical stale-listing flexibility.
- 2 sale attempts with the ask held roughly flat each time — persistent listings suggest the price (not the market) is what's stuck; bring a comps-based counter.
Risks & watch-outs
- Watch-outs: built in 1930 — expect roof / HVAC / electrical / plumbing capex.
Questions for the listing agent
- Built in 1930 — when were the roof, HVAC, electrical panel, plumbing, and water heater last replaced?
- Is there a deadline driving the sale (1031 exchange, divorce, estate, relocation)? That informs how much negotiation room exists.
- Schools are D-rated, which usually means shorter tenancies and higher turnover. Who's the typical renter profile here, and what's been the actual vacancy rate?
- What's the average days-on-market for RENTAL listings here right now (not sales)? A rising rental-DOM trend means longer vacancies and softer asking-rent achievability than the comps imply.
- What's the recent tenant-quality profile in this submarket — average credit score on applications, eviction rate, late-payment / NSF rate, and stable-employment percentage? A property-management company in the area should have these aggregated.
- How much new for-sale + rental construction is in the pipeline within 1–3 miles? Heavy new supply typically softens prices + rents 12–24 months out; constrained supply supports both.
Investment metrics
- 1% rule
- 1.15% ✓
- Cap rate
- 8.86%
- Cash-on-cash
- 9.17%
- DSCR
- 1.41
- GRM
- 7.3
CMA / ARV
- ARV (on-the-fly)
- $25,900
- Comps found
- 1
Show comp detail 1 sale within ~0.75 mi
| Address | Dist | Beds/Ba | Sqft | Sold | Price | $/sf | Match |
|---|---|---|---|---|---|---|---|
| 311 Oak St | 0.20mi | 3/1.0 | 1,764 (-5%) | 15mo | $25,000 | $14 | 70 |
Match score weights: distance 35% · size 25% · config 20% · recency 20%. Top-matched comps best support the ARV.
Projected returns pro-forma
10.0% appreciation · 3.0% rent growth · sell at horizon
- IRR
- 31.0%
- Equity multiple
- 3.43×
- Total profit
- $68,043
- Equity at exit
- $89,998
- IRR
- 26.8%
- Equity multiple
- 7.78×
- Total profit
- $189,701
- Equity at exit
- $194,084
Cash invested: $27,972 (down + closing). Projections, not guarantees.
Landlord ↔ Tenant lean methodology
- Overall (STATE)
- 83 Strongly Landlord-Friendly
- State Kentucky
- 83 Strongly Landlord-Friendly · R+16
- County
- — inherits STATE
- City
- — inherits STATE
ZIP-level market 40111
- Home prices YoY
- 3.1%
- Active inventory
- 17
- Price-to-rent
- 7.3×
Monthly cashflow live
- Estimated rent
- $1,145 medium interval (Pro) →
- Mortgage (P&I)
- −$524
- Tax est. 1.5%
- −$125 /mo · $1,498/yr
- Insurance
- −$42
- HOA
- −$0
- Vacancy / Maint / Mgmt
- −$240
- Net cashflow
- $214
Break-even live
Sensitivity live
| Price | -10% $283 | -5% $248 | +0% $214 | +5% $179 | +10% $145 |
|---|---|---|---|---|---|
| Rent | -10% $123 | -5% $169 | +0% $214 | +5% $259 | +10% $304 |
| Rate | -1.0pp $264 | -0.5pp $239 | base $214 | +0.5pp $188 | +1.0pp $162 |
UW: 25.0% down · 7.5% · 30yr · 1.5% tax · 5.0% vac · 8.0% maint · 8.0% mgmt
Financing live
Cash to close
- Down payment
- $24,975
- Closing costs
- $2,997
- Reserves months
- —
- Total cash needed
- —
Loan-product check · same deal, 3 products live
Conventional
25% down · 7.5% · 30yr
- Down + closing
- —
- Monthly P&I
- —
- Monthly cashflow
- —
- DSCR
- —
- Eligible?
- —
Personal DTI + credit; lowest rate.
DSCR
20% down · 8.5% · 30yr
- Down + closing
- —
- Monthly P&I
- —
- Monthly cashflow
- —
- DSCR
- —
- Eligible?
- —
No personal income docs; deal must DSCR.
Hard money
10% down · 12.0% · 12mo
- Down + closing
- —
- Monthly P&I
- —
- Monthly cashflow
- —
- DSCR
- —
- Eligible?
- —
Short-term bridge; refi at stabilization.
Listing history 13 events
-
2026-06-21days on market $99,900 Active 17 DOM
-
2026-06-18days on market $99,900 Active 15 DOM
-
2026-06-17days on market $99,900 Active 14 DOM
-
2026-06-16days on market $99,900 Active 13 DOM
-
2026-06-15days on market $99,900 Active 12 DOM
-
2026-06-13days on market $99,900 Active 10 DOM
-
2026-06-12days on market $99,900 Active 9 DOM
-
2026-06-09days on market $99,900 Active 6 DOM
-
2026-06-08days on market $99,900 Active 5 DOM
-
2026-06-07days on market $99,900 Active 4 DOM
-
2026-06-07days on market $99,900 Active 3 DOM
-
2026-06-04remarks 699-char remark
-
2026-06-04$99,900 Active 1 DOM
ⓘ Source: listings_history table (triggers on properties + properties_extension) + one-shot
backfill from property_details.listing_events for pre-trigger history.
Nearby sold comps map
Loading sold comps map…
Walkable amenities ~0.75 mi
Loading nearby amenities…
Taxation est. · year 1
- Rental income
- $13,735
- − Mortgage interest
- −$5,596
- − Property taxes
- −$1,498
- − Insurance
- −$500
- − Repairs & maintenance
- −$1,099
- − Management
- −$1,099
- − Depreciation
- −$2,906
- Taxable income
- $1,037
- Est. tax owed @ 24.0%
- −$249
- After-tax cash flow
- $2,317/yr
For passive investors: Depreciation is non-cash, so a rental often shows a tax loss while cash-flowing — sheltering income. Rental losses are passive: they offset passive income freely, and up to $25,000/yr can offset ordinary (W-2) income if you actively participate and your MAGI is under $100k (phasing out to $0 by $150k); unused losses carry forward. On sale, claimed depreciation is recaptured at up to 25%, and gains may owe capital-gains tax (a 1031 exchange can defer both). Figures are a year-1 estimate at your 24.0% rate — not tax advice; consult a CPA.
Schools (NCES district)
- District
- Cloverport Independent
- NCES district ID
- 2101290
- Math proficiency
- 40% ▼ -3.00%
- Reading proficiency
- 50% ▼ -1.00%
- Median HH income
- $30,443
- Composite
- 38.98/100
- National rank
- #8290
- State rank
- #132 of 173 in KY
Livability — Cloverport
- Score
- 61/100
- State rank
- #373
- US rank
- #17679
Category grades
Schools grade is shown separately in the Schools card above.
Census & demographics
- Census place
- Cloverport, KY
- Population (ZIP)
- 2,121
Population outlook (Breckinridge County) Hauer SSP2
- Today (2025)
- 19,487 people
- By 2030
- 18,994 · -2.5%
- By 2040
- 17,825 · -8.5%
- By 2050
- 16,640 · -14.6%
- By 2075
- 14,155 · -27.4%
- By 2100
- 11,696 · -40.0%
Race, ethnicity, and origin ACS 2023
- Neighborhood character
- Predominantly White (97%)
- Race & ethnicity
- White 97% Two or more races 2%
- Common ancestry
- Slovak 2% Serbian 2% Lithuanian 1%
Political lean MEDSL · Breckinridge
- 2024 margin
- Solid R (+58.2) · D 20.3% · R 78.5% · Other 1.2%
- 2008→2024 swing
- -32.7pp toward R · 2008: -25.5pp · 2024: -58.2pp
- All cycles
- 2024: R+58.2 2020: R+52.5 2016: R+51.6 2012: R+27.6 2008: R+25.5
Not yet ingested
- Civics
- —
Market trends
- HPI YoY
- ▲ 12.78%
- Current HPI
- 420.524
- Rent YoY
- —
- Metro
- —
- State GDP YoY
- ▲ 1.81%
- F500 in state
- 4
Industry mix (Fortune 500 HQ in KY)
| Industry | F500 HQs | Revenue |
|---|---|---|
| Healthcare | 1 | $118B |
|
||
| Food / Beverage | 1 | $7B |
|
||
Price history
-20.1% since first listed4 events — show timeline
- 2026-06-03 Listed $99,900 HKARMLS
- 2026-02-20 Price Changed $100,000 HKARMLS
- 2025-12-01 Price Changed $110,000 HKARMLS
- 2025-08-13 Listed $125,000 HKARMLS
Property tax history
-0.6%/yrLatest (2025): $65 · +26.3% YoY. Source: county tax records.
Cash-flow waterfall
monthlySold comps — $/sqft
last 12 mo · ≤1 miLoading sold comps…