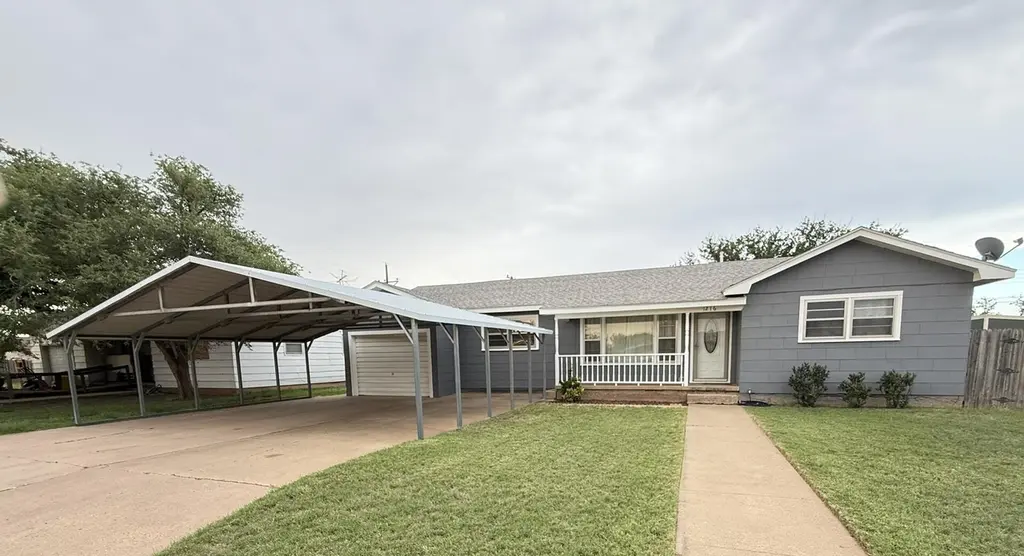
1216 Avenue M · Ralls, TX
Flood risk 1/10 · Minimal
- FEMA flood zone
- —
- Chance of flooding over 30 yrs
- 0.0%
- Est. flood insurance / yr
- —
Fire risk 1/10 · Minimal
- Est. fire insurance / yr
- $1,222 – $2,270
Heat risk 5/10 · Moderate
- Hot days now (above 100°F)
- 7 days/yr
- Hot days in 30 yrs
- 20 days/yr
Wind risk 2/10 · Minimal
- Chance of severe wind over 30 yrs
- 1.0%
Air-quality risk 1/10 · Minimal
- Unhealthy air days now
- 0 days/yr
- Unhealthy air days in 30 yrs
- 0 days/yr
Risk factors via First Street. Map © Google.
Why this score? — see what drove the C- grade
The composite is a weighted blend of 9 inputs, each scored 0–100. Each bar is that input's sub-score; the figure is the points it added to the 100-point composite (weight × sub-score).
- Cash flow +18.8/30.0
- ARV discount +7.5/15.0
- Appreciation +6.5/10.0
- DSCR +5.9/10.0
- 1% rule +5.6/10.0
- Livability +3.2/5.0
- Rent growth +2.5/5.0
- Condition / age +2.5/5.0
- Schools +2.0/10.0
$108,000
🖨 Deal sheet (PDF) 📄 Offer letter ✓ Due diligence
Listing remarks MLS
Pride of Ownership is evident in this lovely 3 bedroom, 1-1/2 bath home; Highlighted with a country Kitchen, Large Master Bedroom with walk-in closet, updated paint, carpet and vinyl flooring, lots of storage and closets. This home is move in ready, with a New 50 gallon hot water heater, New energy efficient 4 Ton Central Heating & Air Conditioning Complete System installed July 2019 and came with a 10 Year Warranty & will convey to new owner, 5 ceiling fans, a New built-in GE Dishwasher. The Kenmore Refrigerator, Stove, & the window Blinds/Curtains will convey. A New composition 30 year warranted Roof. A Tree shaded back yard with a New 12 ft X 14 ft = 168 sq ft Storage Building with additional attic space & an additional storage/greenhouse building. The back yard is enclosed with a privacy Wood Fence. Your Family can Enjoy Living in the Quiet / Peaceful Community of Ralls. Come take a Look at this Lovely, Energy Efficient Home, as the month of April electric bill was only $50.
Key facts
- Spacious backyard
- Large carport
- Storage unit
Tags
Property features AI
Finance
- Other: Listing provided by Aycock Realty Group, LLC
Exterior
- Parking: Attached garage (1 car); Carport (2 cars); Garage, attached, and carport; see remarks
- Security: See remarks
- Utilities: Public water; Public sewer
- Home design: Single family residence; Residential property
- Construction: Fiber cement exterior; Composition roof; Pillar/post/pier foundation; Built on a 0.22-acre lot
- Exterior features: Private yard; Storage structure on property; Front porch; Fenced backyard; Paved public road frontage (city street)
Interior
- Kitchen: Water heater (listed under appliances)
- Flooring: Carpet; Vinyl
- Bathrooms: 2 full bathrooms
- Heating & cooling: Central heating (natural gas); Central electric cooling
- Interior features: See remarks
- Laundry & utility: Laundry room; Laundry area in garage
Neighborhood map
What this means for you Summary
Snapshot
- This is a 3-bed/2.0-bath single-family listed at $108k.
Deal economics
- At list price, monthly cash flow is $109 ($1k/yr) — positive.
- The deal already cash-flows at list — no discount required.
- Meets the 1% rule at list price ($1k rent vs $108k).
Location & tenants
- Location reads 65/100 on livability (#685 in TX) — a middle-class / working-renter tenant base. Strengths: cost of living A+, housing A+, crime B+; Watch: health & safety C-, amenities F, commute F.
- Ralls ISD (rural): math 23% / reading 26% proficiency, ranked #728 of 826 in TX (top 88%) — low school quality limits family demand, transient renter base, plan for 1-2y turnover; 67% free/reduced lunch — lower-income household profile, screen leases tightly.
- Zoned schools: Ralls El (math 22% / reading 27%, grade F, #3,052 of 4,322 statewide, top 74%, 192 students, 88% FRL); Ralls Middle (math 27% / reading 27%, grade F, #1,177 of 1,662 statewide, top 72%, 108 students, 79% FRL); Ralls H S (math 5% / reading 15%, grade F, #1,566 of 1,632 statewide, top 97%, 153 students, 75% FRL).
- Market conditions: 19 active listings in the ZIP.
Forward outlook
- In year one you build about $4k of equity ($747 loan paydown + $3k appreciation (3.0% local appreciation)).
- Crosby County population projected at -19% by 2050 — secular population decline; favor cash flow + early exit over multi-decade hold.
- At projected returns (3.0% appreciation + 3.0% rent growth), your $30k cash investment doubles in ~5 years — after that, you're playing with house money.
- By year 9, paydown + projected appreciation supports a ~$34k cash-out refi (75% LTV) — recoverable capital for the next deal without selling this one.
Negotiation context
- Only 9 days on market — expect competitive offers; lowballing is unlikely to land.
- 2 sale attempts since 6y ago with the ask held roughly flat each time — persistent listings suggest the price (not the market) is what's stuck; bring a comps-based counter.
Risks & watch-outs
- Watch-outs: built in 1950 — expect roof / HVAC / electrical / plumbing capex.
- Climate carrying-cost: extreme-heat days projected 7→20/yr by 2055 (HVAC capex compounding) — expect insurance premiums to compound above CPI over the hold.
Questions for the listing agent
- Built in 1950 — when were the roof, HVAC, electrical panel, plumbing, and water heater last replaced?
- Is there a deadline driving the sale (1031 exchange, divorce, estate, relocation)? That informs how much negotiation room exists.
- Schools are F-rated, which usually means shorter tenancies and higher turnover. Who's the typical renter profile here, and what's been the actual vacancy rate?
- What's the average days-on-market for RENTAL listings here right now (not sales)? A rising rental-DOM trend means longer vacancies and softer asking-rent achievability than the comps imply.
- What's the recent tenant-quality profile in this submarket — average credit score on applications, eviction rate, late-payment / NSF rate, and stable-employment percentage? A property-management company in the area should have these aggregated.
- How much new for-sale + rental construction is in the pipeline within 1–3 miles? Heavy new supply typically softens prices + rents 12–24 months out; constrained supply supports both.
Investment metrics
- 1% rule
- 1.06% ✓
- Cap rate
- 7.50%
- Cash-on-cash
- 4.31%
- DSCR
- 1.19
- GRM
- 7.9
CMA / ARV
No comps found within radius.
Projected returns pro-forma
2.98% appreciation · 3.0% rent growth · sell at horizon
- IRR
- 11.5%
- Equity multiple
- 1.66×
- Total profit
- $19,873
- Equity at exit
- $48,458
- IRR
- 13.7%
- Equity multiple
- 3.03×
- Total profit
- $61,263
- Equity at exit
- $74,598
Cash invested: $30,240 (down + closing). Projections, not guarantees.
Landlord ↔ Tenant lean methodology
- Overall (STATE)
- 87 Strongly Landlord-Friendly
- State Texas
- 87 Strongly Landlord-Friendly · R+5
- County
- — inherits STATE
- City
- — inherits STATE
ZIP-level market 79357
- Home prices YoY
- 3.2%
- Active inventory
- 19
- Price-to-rent
- 7.9×
Monthly cashflow live
- Estimated rent
- $1,145 medium interval (Pro) →
- Mortgage (P&I)
- −$566
- Tax from tax record
- −$185 /mo · $2,220/yr
- Insurance
- −$45
- HOA
- −$0
- Vacancy / Maint / Mgmt
- −$241
- Net cashflow
- $109
Break-even live
Sensitivity live
| Price | -10% $170 | -5% $139 | +0% $109 | +5% $78 | +10% $47 |
|---|---|---|---|---|---|
| Rent | -10% $18 | -5% $63 | +0% $109 | +5% $154 | +10% $199 |
| Rate | -1.0pp $163 | -0.5pp $136 | base $109 | +0.5pp $81 | +1.0pp $52 |
UW: 25.0% down · 7.5% · 30yr · 1.5% tax · 5.0% vac · 8.0% maint · 8.0% mgmt
Financing live
Cash to close
- Down payment
- $27,000
- Closing costs
- $3,240
- Reserves months
- —
- Total cash needed
- —
Loan-product check · same deal, 3 products live
Conventional
25% down · 7.5% · 30yr
- Down + closing
- —
- Monthly P&I
- —
- Monthly cashflow
- —
- DSCR
- —
- Eligible?
- —
Personal DTI + credit; lowest rate.
DSCR
20% down · 8.5% · 30yr
- Down + closing
- —
- Monthly P&I
- —
- Monthly cashflow
- —
- DSCR
- —
- Eligible?
- —
No personal income docs; deal must DSCR.
Hard money
10% down · 12.0% · 12mo
- Down + closing
- —
- Monthly P&I
- —
- Monthly cashflow
- —
- DSCR
- —
- Eligible?
- —
Short-term bridge; refi at stabilization.
Listing history 9 events
-
2026-06-17status $108,000 Pending 9 DOM
-
2026-06-17days on market $108,000 Active 9 DOM
-
2026-06-16days on market $108,000 Active 8 DOM
-
2026-06-15days on market $108,000 Active 7 DOM
-
2026-06-15days on market $108,000 Active 6 DOM
-
2026-06-13days on market $108,000 Active 5 DOM
-
2026-06-12days on market $108,000 Active 4 DOM
-
2026-06-09remarks 699-char remark
-
2026-06-09$108,000 Active 1 DOM
ⓘ Source: listings_history table (triggers on properties + properties_extension) + one-shot
backfill from property_details.listing_events for pre-trigger history.
Tax reassessment forecast TX · Resets to sale price
- Current annual tax
- $2,220 · $185/mo
- Projected year-2 tax
- $2,220 · $185/mo
- Expected delta
- $0/yr ($0/mo · 0.0%)
ⓘ Screening estimate from a state-policy table — verify with the county assessor before closing.
Climate risk First Street
- Flood 1/10 Low 0% chance over 30 yrs
- Wildfire 1/10 Low
- Heat 5/10 Major 7 d/yr ≥100°F today · 20 d/yr by 30 yrs out
- Wind 2/10 Low 100% chance of damaging wind over 30 yrs
- Air quality 1/10 Low 0 unhealthy d/yr today · 0 by 30 yrs out
Nearby sold comps map
Loading sold comps map…
Walkable amenities ~0.75 mi
Loading nearby amenities…
Taxation est. · year 1
- Rental income
- $13,745
- − Mortgage interest
- −$6,050
- − Property taxes
- −$2,220
- − Insurance
- −$540
- − Repairs & maintenance
- −$1,100
- − Management
- −$1,100
- − Depreciation
- −$3,142
- Taxable loss
- −$405
- Est. tax savings @ 24.0%
- +$97
- After-tax cash flow
- $1,400/yr
For passive investors: Depreciation is non-cash, so a rental often shows a tax loss while cash-flowing — sheltering income. Rental losses are passive: they offset passive income freely, and up to $25,000/yr can offset ordinary (W-2) income if you actively participate and your MAGI is under $100k (phasing out to $0 by $150k); unused losses carry forward. On sale, claimed depreciation is recaptured at up to 25%, and gains may owe capital-gains tax (a 1031 exchange can defer both). Figures are a year-1 estimate at your 24.0% rate — not tax advice; consult a CPA.
Schools (NCES district)
- District
- Ralls ISD
- NCES district ID
- 4836390
- Math proficiency
- 23% ▼ -6.00%
- Reading proficiency
- 26% ▼ -1.00%
- Median HH income
- $35,203
- Composite
- 20.23/100
- National rank
- #8626
- State rank
- #728 of 826 in TX
Livability — Ralls
- Score
- 65/100
- State rank
- #685
- US rank
- #12805
Category grades
Schools grade is shown separately in the Schools card above.
Census & demographics
- Census place
- Ralls, TX
- Population (ZIP)
- 1,883
Population outlook (Crosby County) Hauer SSP2
- Today (2025)
- 5,795 people
- By 2030
- 5,626 · -2.9%
- By 2040
- 5,198 · -10.3%
- By 2050
- 4,696 · -19.0%
- By 2075
- 3,250 · -43.9%
- By 2100
- 2,123 · -63.4%
Race, ethnicity, and origin ACS 2023
- Neighborhood character
- Majority Hispanic (52%)
- Race & ethnicity
- Hispanic / Latino 52% White 46% Two or more races 12% Black 2%
- Hispanic origin (detail)
- Mexican 39%
- Common ancestry
- Serbian 4% Romanian 1% Iranian 1%
- Foreign-born
- 4% · Canada
- Languages at home
- 67% English-only · Spanish 33%
Political lean MEDSL · Crosby
- 2024 margin
- Solid R (+51.3) · D 24.0% · R 75.3%
- 2008→2024 swing
- -23.3pp toward R · 2008: -28.1pp · 2024: -51.3pp
- All cycles
- 2024: R+51.3 2020: R+44.5 2016: R+41.6 2012: R+27.6 2008: R+28.1
Not yet ingested
- Civics
- —
Market trends
- HPI YoY
- ▲ 2.98%
- Current HPI
- 95.4996
- Rent YoY
- —
- Metro
- —
- State GDP YoY
- ▲ 3.95%
- F500 in state
- 110
Industry mix (Fortune 500 HQ in TX)
| Industry | F500 HQs | Revenue |
|---|---|---|
| Energy | 16 | $1,198B |
|
||
| Technology | 5 | $198B |
|
||
| Engineering / Construction | 4 | $72B |
|
||
| Energy Services | 3 | $60B |
|
||
| Utilities | 3 | $41B |
|
||
| Healthcare | 2 | $330B |
|
||
Price history
+44.0% since first listed6 events — show timeline
- 2026-06-08 Listed $108,000 LARMLS
- 2020-07-15 Sold (MLS) — LARMLS
- 2020-06-26 Sold (Public Records) — Public Records
- 2020-05-12 Listed $75,000 LARMLS
- 2015-03-05 Sold (Public Records) — Public Records
- 2003-12-05 Sold (Public Records) — Public Records
Property tax history
+4.4%/yrLatest (2025): $2,220 · +4.0% YoY. Source: county tax records.
Cash-flow waterfall
monthlySold comps — $/sqft
last 12 mo · ≤1 miLoading sold comps…