 Multi-family
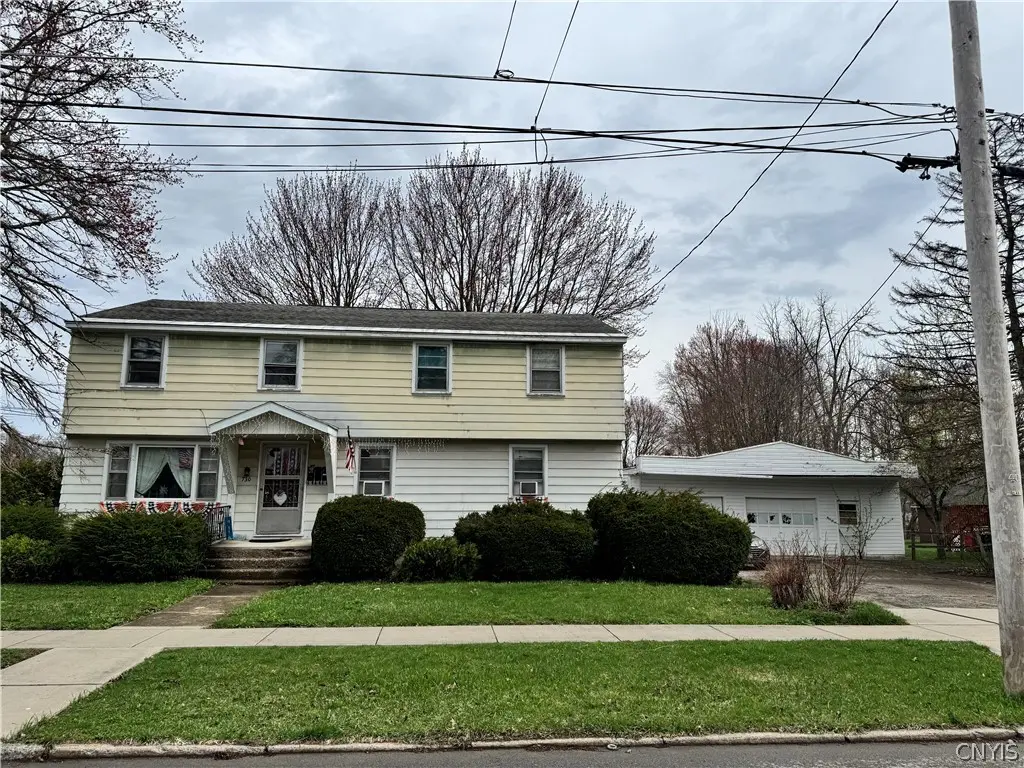
730 W Court St · Rome, NY
Flood risk 5/10 · Moderate
- FEMA flood zone
- X (unshaded)
- Chance of flooding over 30 yrs
- 0.47%
- Est. flood insurance / yr
- $473 – $860
Fire risk 3/10 · Minor
- Est. fire insurance / yr
- $691 – $1,283
Heat risk 3/10 · Minor
- Hot days now (above 94°F)
- 7 days/yr
- Hot days in 30 yrs
- 17 days/yr
Wind risk 1/10 · Minimal
- Chance of severe wind over 30 yrs
- 0.0%
Air-quality risk 2/10 · Minimal
- Unhealthy air days now
- 0 days/yr
- Unhealthy air days in 30 yrs
- 1 days/yr
Risk factors via First Street. Map © Google.
Why this score? — see what drove the B grade
The composite is a weighted blend of 9 inputs, each scored 0–100. Each bar is that input's sub-score; the figure is the points it added to the 100-point composite (weight × sub-score).
- Cash flow +30.0/30.0
- ARV discount +12.9/15.0
- 1% rule +10.0/10.0
- DSCR +10.0/10.0
- Schools +3.5/10.0
- Livability +3.2/5.0
- Rent growth +2.5/5.0
- Condition / age +2.5/5.0
- Appreciation +0.0/10.0
$80,000
🖨 Deal sheet (PDF) 📄 Offer letter ✓ Due diligence
Multi-family units
County records classify this as Multi-Family (2-4 Unit). Listing-text estimate: 1 unit. estimate disagrees with records
Listing remarks MLS
Great home to live cheaply and allow the other two apartments help pay your mortgage. This three family home with a triple lot is across from Stevens Field Park. The park features a public in-ground pool, Basketball court, baseball and softball fields and a full playground. The home has a 3 bedrooms 1 bath on the 1st floor. Hardwood floors and a private backyard. The 2nd floor features 2 separate one bedroom apartments. Home sits on a corner lot and has parking on both sides. 2 stall garage.
Key facts
- 0.43 acre lot
- 2 garage spots
- Built 1955
Neighborhood map
What this means for you Summary
Snapshot
- This is a 3-bed/3.0-bath multifamily listed at $80k.
Deal economics
- At list price, monthly cash flow is $1k ($15k/yr) — positive.
- The deal already cash-flows at list — no discount required.
- Meets the 1% rule at list price ($2k rent vs $80k).
- Cap rate 24.5% vs local median 5.6% in Rome — top-decile yield for the area; either an underpriced asset or a hidden risk that comps aren't pricing in. Stress-test before assuming the spread holds.
Location & tenants
- Location reads 64/100 on livability (#722 in NY) — a middle-class / working-renter tenant base. Strengths: cost of living A+, housing A+; Watch: health & safety C-, amenities F, commute F.
- Rome City School District (town): math 35% / reading 46% proficiency, ranked #516 of 590 in NY (top 88%) — families likely to look elsewhere, expect single-tenant / working-renter base with shorter leases.
- Zoned schools: Gansevoort Elementary School (math 12% / reading 22%, grade F, #2,011 of 2,108 statewide, top 96%, 443 students, 78% FRL); Lyndon H Strough Middle School (math 20% / reading 40%, grade F, #539 of 729 statewide, top 74%, 829 students, 59% FRL); Rome Free Academy (math 85% / reading 98%, grade A+, #201 of 1,100 statewide, top 18%, 1,511 students, 51% FRL).
- Market conditions: 278 active listings in the ZIP; 2 comparable units currently listed for rent nearby; 204 units permitted in Oneida County in 2024 (68 in 5+ unit buildings).
Forward outlook
- Local home prices are declining (-3.0%/yr); year-one equity from $553 of loan paydown is wiped out by about $2k of value loss. Plan a longer hold.
- Oneida County population projected at -12% by 2050 — secular population decline; favor cash flow + early exit over multi-decade hold.
- At projected returns (-3.0% appreciation + 3.0% rent growth), your $22k cash investment doubles in ~2 years — after that, you're playing with house money.
Negotiation context
- Only 1 days on market — expect competitive offers; lowballing is unlikely to land.
- 3 sale attempts since 9y ago with the ask held roughly flat each time — persistent listings suggest the price (not the market) is what's stuck; bring a comps-based counter.
Risks & watch-outs
- Watch-outs: property tax is 3.8% of price; built in 1955 — expect roof / HVAC / electrical / plumbing capex.
- Climate carrying-cost: moderate flood risk — expect insurance premiums to compound above CPI over the hold.
Questions for the listing agent
- Built in 1955 — when were the roof, HVAC, electrical panel, plumbing, and water heater last replaced?
- Property tax is high relative to price — has the assessment been appealed recently, and will the sale trigger a re-assessment?
- Is there a deadline driving the sale (1031 exchange, divorce, estate, relocation)? That informs how much negotiation room exists.
- Schools are F-rated, which usually means shorter tenancies and higher turnover. Who's the typical renter profile here, and what's been the actual vacancy rate?
- What's the average days-on-market for RENTAL listings here right now (not sales)? A rising rental-DOM trend means longer vacancies and softer asking-rent achievability than the comps imply.
- What's the recent tenant-quality profile in this submarket — average credit score on applications, eviction rate, late-payment / NSF rate, and stable-employment percentage? A property-management company in the area should have these aggregated.
- How much new apartment / multifamily construction is in the pipeline within 1–3 miles? Heavy new supply (>2% of stock underway) typically softens rents 12–24 months out; light construction supports rent growth.
Investment metrics
- 1% rule
- 3.04% ✓
- Cap rate
- 24.50%
- Cash-on-cash
- 65.03%
- DSCR
- 3.89
- GRM
- 2.7
CMA / ARV
- ARV (on-the-fly)
- $90,972
- Comps found
- 4
Show comp detail 4 sales within ~0.75 mi
| Address | Dist | Beds/Ba | Sqft | Sold | Price | $/sf | Match |
|---|---|---|---|---|---|---|---|
| 408 N Madison St | 0.52mi | 4/2.0 (+1) | 2,412 (+1%) | 2mo | $70,000 | $29 | 64 |
| 416 Pond St | 0.43mi | 3/2.0 | 2,039 (-15%) | 11mo | $77,250 | $38 | 42 |
| 419 W Thomas St | 0.44mi | 4/2.0 (+1) | 2,200 (-8%) | 20mo | $77,000 | $35 | 40 |
| 425 W Bloomfield St | 0.48mi | 4/2.0 (+1) | 2,106 (-12%) | 20mo | $218,000 | $104 | 32 |
Match score weights: distance 35% · size 25% · config 20% · recency 20%. Top-matched comps best support the ARV.
Projected returns pro-forma
-3.0% appreciation · 3.0% rent growth · sell at horizon
- IRR
- 64.3%
- Equity multiple
- 3.88×
- Total profit
- $64,486
- Equity at exit
- $11,928
- IRR
- 68.7%
- Equity multiple
- 7.98×
- Total profit
- $156,247
- Equity at exit
- $6,917
Cash invested: $22,400 (down + closing). Projections, not guarantees.
Landlord ↔ Tenant lean methodology
- Overall (STATE)
- 15 Strongly Tenant-Friendly
- State New York
- 15 Strongly Tenant-Friendly · D+10
- County
- — inherits STATE
- City
- — inherits STATE
ZIP-level market 13440
- Home prices YoY
- -8.0%
- Active inventory
- 278
- Price-to-rent
- 7.4×
Monthly cashflow live
- Estimated rent
- $2,432 medium interval (Pro) →
- Mortgage (P&I)
- −$420
- Tax from tax record
- −$254 /mo · $3,053/yr
- Insurance
- −$33
- HOA
- −$0
- Vacancy / Maint / Mgmt
- −$511
- Net cashflow
- $1,214
Break-even live
Sensitivity live
| Price | -10% $1,259 | -5% $1,237 | +0% $1,214 | +5% $1,191 | +10% $1,169 |
|---|---|---|---|---|---|
| Rent | -10% $1,022 | -5% $1,118 | +0% $1,214 | +5% $1,310 | +10% $1,406 |
| Rate | -1.0pp $1,254 | -0.5pp $1,234 | base $1,214 | +0.5pp $1,193 | +1.0pp $1,172 |
3-unit breakdown (identical units grouped — click to expand)
| Units | Beds | Baths | Est. rent |
|---|---|---|---|
| 1× unit | 3 | 1 | $904 |
| 2× units | 1 | 1 | $1,528 |
| #2 | 1 | 1 | $764 |
| #3 | 1 | 1 | $764 |
| Total (3 units) | $2,432 | ||
UW: 25.0% down · 7.5% · 30yr · 1.5% tax · 5.0% vac · 8.0% maint · 8.0% mgmt
Financing live
Cash to close
- Down payment
- $20,000
- Closing costs
- $2,400
- Reserves months
- —
- Total cash needed
- —
Loan-product check · same deal, 3 products live
Conventional
25% down · 7.5% · 30yr
- Down + closing
- —
- Monthly P&I
- —
- Monthly cashflow
- —
- DSCR
- —
- Eligible?
- —
Personal DTI + credit; lowest rate.
DSCR
20% down · 8.5% · 30yr
- Down + closing
- —
- Monthly P&I
- —
- Monthly cashflow
- —
- DSCR
- —
- Eligible?
- —
No personal income docs; deal must DSCR.
Hard money
10% down · 12.0% · 12mo
- Down + closing
- —
- Monthly P&I
- —
- Monthly cashflow
- —
- DSCR
- —
- Eligible?
- —
Short-term bridge; refi at stabilization.
Rent comps 2 comps
| Address | Beds | Baths | Sqft | Rent | $/sqft | DOM | Units | Dist |
|---|---|---|---|---|---|---|---|---|
| 218 N George St Rome, NY | 2.0 | 1.0 | 2200 | $1,200 | $0.55 | 45d | 1 | 0.64mi |
| 251 Liam Ln Unit 251 Rome, NY | 3.0 | 2.0 | 1577 | $2,750 | $1.74 | 45d | 1 | 1.27mi |
Listing history 8 events
-
2026-04-20status Pending
-
2026-04-16$80,000 Active
-
2020-06-09soldstatus $100,000
-
2020-06-05soldstatus $100,000
-
2020-04-06$120,000
-
2018-01-18soldstatus $47,500
-
2018-01-17soldstatus $47,500 496-char remark
Show marketing remark (496 chars)
Great home to live cheaply and allow the other two apartments help pay your mortgage. This three family home with a triple lot is across from Stevens Field Park. The park features a public in-ground pool, Basketball court, baseball and softball fields and a full playground. The home has a 3 bedrooms 1 bath on the 1st floor. Hardwood floors and a private backyard. The 2nd floor features 2 separate one bedroom apartments. Home sits on a corner lot and has parking on both sides. 2 stall garage.
-
2017-07-25$74,900 496-char remark
Show marketing remark (496 chars)
Great home to live cheaply and allow the other two apartments help pay your mortgage. This three family home with a triple lot is across from Stevens Field Park. The park features a public in-ground pool, Basketball court, baseball and softball fields and a full playground. The home has a 3 bedrooms 1 bath on the 1st floor. Hardwood floors and a private backyard. The 2nd floor features 2 separate one bedroom apartments. Home sits on a corner lot and has parking on both sides. 2 stall garage.
ⓘ Source: listings_history table (triggers on properties + properties_extension) + one-shot
backfill from property_details.listing_events for pre-trigger history.
Tax reassessment forecast NY · Partial reset (capped growth)
- Current annual tax
- $3,053 · $254/mo
- Projected year-2 tax
- $3,053 · $254/mo
- Expected delta
- $0/yr ($0/mo · 0.0%)
ⓘ Screening estimate from a state-policy table — verify with the county assessor before closing.
Climate risk First Street
- Flood 5/10 Major FEMA zone X (unshaded) · 47% chance over 30 yrs
- Wildfire 3/10 Moderate
- Heat 3/10 Moderate 7 d/yr ≥94°F today · 17 d/yr by 30 yrs out
- Wind 1/10 Low 0% chance of damaging wind over 30 yrs
- Air quality 2/10 Low 0 unhealthy d/yr today · 1 by 30 yrs out
Nearby sold comps map
Loading sold comps map…
Walkable amenities ~0.75 mi
Loading nearby amenities…
Taxation est. · year 1
- Rental income
- $29,184
- − Mortgage interest
- −$4,481
- − Property taxes
- −$3,053
- − Insurance
- −$400
- − Repairs & maintenance
- −$2,335
- − Management
- −$2,335
- − Depreciation
- −$2,327
- Taxable income
- $14,253
- Est. tax owed @ 24.0%
- −$3,421
- After-tax cash flow
- $11,147/yr
For passive investors: Depreciation is non-cash, so a rental often shows a tax loss while cash-flowing — sheltering income. Rental losses are passive: they offset passive income freely, and up to $25,000/yr can offset ordinary (W-2) income if you actively participate and your MAGI is under $100k (phasing out to $0 by $150k); unused losses carry forward. On sale, claimed depreciation is recaptured at up to 25%, and gains may owe capital-gains tax (a 1031 exchange can defer both). Figures are a year-1 estimate at your 24.0% rate — not tax advice; consult a CPA.
Schools (NCES district)
- District
- Rome City School District
- NCES district ID
- 3624900
- Math proficiency
- 35% ▼ -4.00%
- Reading proficiency
- 46% ▲ 10.00%
- Median HH income
- $46,406
- Composite
- 34.52/100
- National rank
- #5178
- State rank
- #516 of 590 in NY
Livability — Rome
- Score
- 64/100
- State rank
- #722
- US rank
- #13676
Category grades
Schools grade is shown separately in the Schools card above.
Census & demographics
- Census place
- Rome, NY
- City population
- 41,418
- Population (ZIP)
- 41,273
Population outlook (Oneida County) Hauer SSP2
- Today (2025)
- 225,223 people
- By 2030
- 220,384 · -2.1%
- By 2040
- 209,071 · -7.2%
- By 2050
- 197,920 · -12.1%
- By 2075
- 175,541 · -22.1%
- By 2100
- 148,491 · -34.1%
Race, ethnicity, and origin ACS 2023
- Neighborhood character
- Predominantly White (82%)
- Race & ethnicity
- White 82% Hispanic / Latino 7% Two or more races 6% Black 4% Asian 1%
- Hispanic origin (detail)
- Mexican 1% Puerto Rican 4%
- Common ancestry
- Romanian 9% Lithuanian 4% Slovak 1%
- Foreign-born
- 3% · Canada, China
- Languages at home
- 94% English-only · Spanish 3% Other Indo-European 1%
Political lean MEDSL · Oneida
- 2024 margin
- Strong R (+21.3) · D 39.4% · R 60.6%
- 2008→2024 swing
- -15.2pp toward R · 2008: -6.1pp · 2024: -21.3pp
- All cycles
- 2024: R+21.3 2020: R+15.5 2016: R+21.1 2012: R+5.3 2008: R+6.1
Not yet ingested
- Civics
- —
Market trends
- HPI YoY
- ▼ -29.58%
- Current HPI
- 339.3589
- Rent YoY
- —
- Metro
- —
- State GDP YoY
- ▲ 2.60%
- F500 in state
- 92
Industry mix (Fortune 500 HQ in NY)
| Industry | F500 HQs | Revenue |
|---|---|---|
| Financial Services | 10 | $950B |
|
||
| Consumer Goods | 9 | $162B |
|
||
| Insurance | 4 | $225B |
|
||
| Telecommunications | 2 | $144B |
|
||
| Pharmaceuticals | 2 | $112B |
|
||
| Media / Entertainment | 2 | $69B |
|
||
Price history
+6.8% since first listed8 events — show timeline
- 2026-04-20 Pending — CNYIS
- 2026-04-16 Listed $80,000 CNYIS
- 2020-06-09 Sold (Public Records) $100,000 Public Records
- 2020-06-05 Sold (MLS) $100,000 CNYIS
- 2020-04-06 Listed $120,000 CNYIS
- 2018-01-18 Sold (Public Records) $47,500 Public Records
- 2018-01-17 Sold (MLS) $47,500 CNYIS
- 2017-07-25 Listed $74,900 CNYIS
Property tax history
+6.4%/yrLatest (2025): $3,053 · +0.3% YoY. Source: county tax records.
Cash-flow waterfall
monthlySold comps — $/sqft
last 12 mo · ≤1 miLoading sold comps…