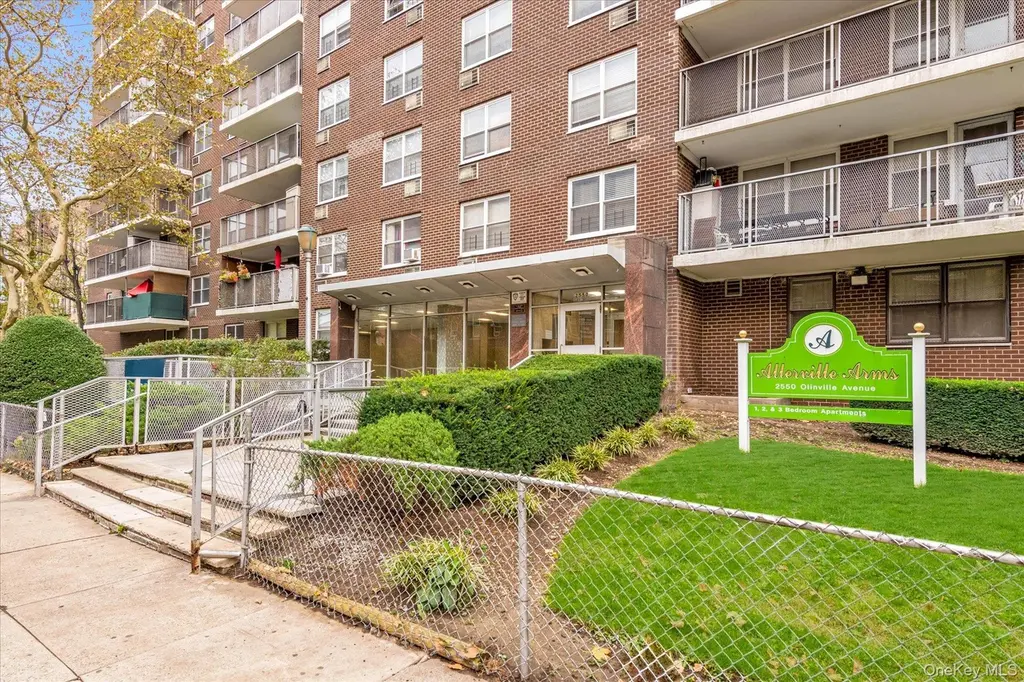
2550 Olinville Ave Unit 4E · New York, NY
Flood risk 1/10 · Minimal
- FEMA flood zone
- X (unshaded)
- Chance of flooding over 30 yrs
- 0.0%
- Est. flood insurance / yr
- $507 – $1,088
Fire risk 1/10 · Minimal
- Est. fire insurance / yr
- $691 – $1,283
Heat risk 6/10 · Moderate
- Hot days now (above 99°F)
- 7 days/yr
- Hot days in 30 yrs
- 14 days/yr
Wind risk 6/10 · Moderate
- Chance of severe wind over 30 yrs
- 27.0%
Air-quality risk 3/10 · Minor
- Unhealthy air days now
- 3 days/yr
- Unhealthy air days in 30 yrs
- 4 days/yr
Risk factors via First Street. Map © Google.
Why this score? — see what drove the D- grade
The composite is a weighted blend of 9 inputs, each scored 0–100. Each bar is that input's sub-score; the figure is the points it added to the 100-point composite (weight × sub-score).
- ARV discount +7.5/15.0
- Cash flow +6.7/30.0
- 1% rule +5.8/10.0
- Schools +5.0/10.0
- Rent growth +4.8/5.0
- Livability +3.8/5.0
- Condition / age +2.8/5.0
- DSCR +0.9/10.0
- Appreciation +0.0/10.0
$225,000
🖨 Deal sheet (PDF) 📄 Offer letter ✓ Due diligence
Listing remarks
ALL UTILITIES INCLUDED IN MONTHLY MAINTENANCE FEE!! Welcome to Allerville Arms! A bright and beautiful Co-op situated in the prime commuter corridor of the Olinville section of the Bronx. This sunny & spacious one-bedroom unit boats an open yet cozy living area with multiple closets, adjacent to your fully functional walk-through kitchen with stainless steel appliances, featuring generous cabinet storage plus a full-sized pantry, in unit Washer/Dryer + dishwasher providing for easy living, adjoining a bright open dining space. Step outside and relax on your private tree-lined balcony, providing the perfect outdoor space for morning coffee or a luxurious outdoor dinner. The bedroom, co
Key facts
- His and her closets
- Walk-through kitchen
- Soaking tub
Tags
Property features AI
Finance
- HOA & community: Community features: Other
Exterior
- Parking: Assigned private parking in a parking lot; Parking fee applies
- Utilities: Public sewer; Sewer connected; Water connected; Electricity connected; Natural gas connected; Cable available; Phone available; See remarks for additional utility details
- Home design: Stock cooperative
- Construction: Brick construction
- Exterior features: Brick exterior; Not waterfront
Interior
- Kitchen: Dishwasher; Range; Microwave; Refrigerator; Walk-through layout with pantry
- Bedrooms: Includes multiple rooms (total 5 rooms) — entry level: 4
- Bathrooms: 1 full bathroom
- Heating & cooling: Steam heat; Wall/window air conditioning units
- Interior features: Built-in features; Ceiling fan(s); His and hers closets; Pantry; Storage; Walk-through kitchen; Washer/dryer hookup; Pets allowed
- Laundry & utility: Washer; Dryer; Washer/dryer hookup
Neighborhood map
What this means for you Summary
Snapshot
- This is a 1-bed/1.0-bath condo listed at $225k. Condition is rated average.
Deal economics
- At list price, monthly cash flow is $-360 ($-4k/yr) — negative.
- The deal already cash-flows at list — no discount required.
- Meets the 1% rule at list price ($2k rent vs $225k).
- Recommended offer: $222k (1.5% below list) — sets the bar for market timing.
- Cap rate 4.4% vs local median 2.6% in New York — top-decile yield for the area; either an underpriced asset or a hidden risk that comps aren't pricing in. Stress-test before assuming the spread holds.
Location & tenants
- Location reads 75/100 on livability (#268 in NY, #4,188 nationally) — a middle-class / working-renter tenant base. Strengths: amenities A+, commute A+, health & safety A; Watch: crime F, cost of living F.
- Zoned schools: Ps 96 Richard Rodgers (math 42% / reading 72%, grade C+, #842 of 2,108 statewide, top 43%, 830 students, 85% FRL); Jhs 383 Philippa Schuyler (math 32% / reading 67%, grade C, #280 of 729 statewide, top 40%, 822 students, 85% FRL); Midwood High School (math 94% / reading 96%, grade A+, #83 of 1,100 statewide, top 8%, 4,062 students, 73% FRL).
- Market conditions: Rents rising fast (+9.2%/yr); 131 active listings in the ZIP; 1 comparable units currently listed for rent nearby; 6,929 units permitted in Bronx County in 2024 (6,829 in 5+ unit buildings).
- At $2,422/mo this rent would consume 59% of the median local household income ($49k/yr) (locally 10930% of renters already pay >50% of income on rent) — very limited rent-growth headroom before tenants either downsize or default.
Forward outlook
- Local home prices are declining (-3.0%/yr); year-one equity from $2k of loan paydown is wiped out by about $7k of value loss. Plan a longer hold.
- Bronx County population projected at +21% by 2050 — long-run rental-demand tailwind backs the buy-and-hold thesis.
Negotiation context
- It's been on market 23 days — a 2% lower offer ($222k) is reasonable based on typical stale-listing flexibility.
Risks & watch-outs
- Watch-outs: HOA is 30% of rent.
- Climate carrying-cost: major wind risk, 27% chance of damaging wind over 30y; extreme-heat days projected 7→14/yr by 2055 (HVAC capex compounding) — expect insurance premiums to compound above CPI over the hold.
Questions for the listing agent
- What do current leases actually rent for vs. the listed asking? Can we see a recent rent roll and the last 12 months of T-12 income?
- Built in 1965 — when were the roof, HVAC, electrical panel, plumbing, and water heater last replaced?
- What does the HOA fee cover, when was the last increase, and are there any pending special assessments or reserve-fund shortfalls?
- Any open or pending special assessments — roof, HVAC, plumbing, elevator, façade? What's the per-unit balance and payoff schedule, and is the seller paying it off at close or rolling it to the buyer?
- Is there a deadline driving the sale (1031 exchange, divorce, estate, relocation)? That informs how much negotiation room exists.
- Schools are B-rated — typically a magnet for longer-tenancy family renters. What's the average tenant stay here, and is there a school-zone premium baked into asking?
- Crime grade is F in this area — have there been break-ins, vandalism, or insurance claims at this property in the last 3 years? What carrier currently insures it and at what premium?
- The area grade is low — what's the realistic commute time and amenity access for the typical tenant pool here? Any planned neighborhood developments (good or bad) we should know about?
- What's the average days-on-market for RENTAL listings here right now (not sales)? A rising rental-DOM trend means longer vacancies and softer asking-rent achievability than the comps imply.
- What's the recent tenant-quality profile in this submarket — average credit score on applications, eviction rate, late-payment / NSF rate, and stable-employment percentage? A property-management company in the area should have these aggregated.
- How much new apartment / multifamily construction is in the pipeline within 1–3 miles? Heavy new supply (>2% of stock underway) typically softens rents 12–24 months out; light construction supports rent growth.
Investment metrics
- 1% rule
- 1.08% ✓
- Cap rate
- 4.37%
- Cash-on-cash
- -6.86%
- DSCR
- 0.69
- GRM
- 7.7
CMA / ARV
No comps found within radius.
Projected returns pro-forma
-3.0% appreciation · 8.0% rent growth · sell at horizon
- IRR
- -19.7%
- Equity multiple
- 0.27×
- Total profit
- $-46,131
- Equity at exit
- $33,548
- IRR
- -1.7%
- Equity multiple
- 0.85×
- Total profit
- $-9,518
- Equity at exit
- $19,454
Cash invested: $63,000 (down + closing). Projections, not guarantees.
Landlord ↔ Tenant lean methodology
- Overall (CITY)
- 0 Strongly Tenant-Friendly
- State New York
- 15 Strongly Tenant-Friendly · D+10
- County
- — inherits STATE
- City New York
- 0 Strongly Tenant-Friendly · D+34
ZIP-level market 10467
- Home prices YoY
- -32.8%
- Rents YoY
- 9.2%
- Active inventory
- 131
- Price-to-rent
- 7.7×
Monthly cashflow live
- Estimated rent
- $2,422 medium interval (Pro) →
- Mortgage (P&I)
- −$1,180
- Tax est. 1.5%
- −$281 /mo · $3,375/yr
- Insurance
- −$94
- HOA est. from 2 same-building comps
- −$719
- Vacancy / Maint / Mgmt
- −$509
- Net cashflow
- $-360
Break-even live
Sensitivity live
| Price | -10% $-205 | -5% $-283 | +0% $-360 | +5% $-438 | +10% $-516 |
|---|---|---|---|---|---|
| Rent | -10% $-552 | -5% $-456 | +0% $-360 | +5% $-265 | +10% $-169 |
| Rate | -1.0pp $-247 | -0.5pp $-303 | base $-360 | +0.5pp $-419 | +1.0pp $-478 |
UW: 25.0% down · 7.5% · 30yr · 1.5% tax · 5.0% vac · 8.0% maint · 8.0% mgmt
Financing live
Cash to close
- Down payment
- $56,250
- Closing costs
- $6,750
- Reserves months
- —
- Total cash needed
- —
Loan-product check · same deal, 3 products live
Conventional
25% down · 7.5% · 30yr
- Down + closing
- —
- Monthly P&I
- —
- Monthly cashflow
- —
- DSCR
- —
- Eligible?
- —
Personal DTI + credit; lowest rate.
DSCR
20% down · 8.5% · 30yr
- Down + closing
- —
- Monthly P&I
- —
- Monthly cashflow
- —
- DSCR
- —
- Eligible?
- —
No personal income docs; deal must DSCR.
Hard money
10% down · 12.0% · 12mo
- Down + closing
- —
- Monthly P&I
- —
- Monthly cashflow
- —
- DSCR
- —
- Eligible?
- —
Short-term bridge; refi at stabilization.
Rent comps 1 comps
| Address | Beds | Baths | Sqft | Rent | $/sqft | DOM | Units | Dist |
|---|---|---|---|---|---|---|---|---|
| 1250 Pelham Pkwy S Unit B Bronx, NY | 1.0 | 1.0 | 725 | $2,850 | $3.93 | 26d | 1 | 1.03mi |
HOA detail condo
- Monthly dues
- $0 · $0/yr
- Assessments
- None detected in remarks — confirm with the listing agent.
Listing history 14 events
-
2026-06-21days on market $225,000 Active 23 DOM
-
2026-06-18days on market $225,000 Active 20 DOM
-
2026-06-17days on market $225,000 Active 19 DOM
-
2026-06-16days on market $225,000 Active 18 DOM
-
2026-06-15days on market $225,000 Active 17 DOM
-
2026-06-13days on market $225,000 Active 15 DOM
-
2026-06-09days on market $225,000 Active 11 DOM
-
2026-06-08days on market $225,000 Active 10 DOM
-
2026-06-08days on market $225,000 Active 9 DOM
-
2026-06-04days on market $225,000 Active 6 DOM
-
2026-06-03days on market $225,000 Active 5 DOM
-
2026-06-02days on market $225,000 Active 4 DOM
-
2026-06-01days on market $225,000 Active 3 DOM
-
2026-05-31days on market $225,000 Active 2 DOM
ⓘ Source: listings_history table (triggers on properties + properties_extension) + one-shot
backfill from property_details.listing_events for pre-trigger history.
Climate risk First Street
- Flood 1/10 Low FEMA zone X (unshaded) · 0% chance over 30 yrs
- Wildfire 1/10 Low
- Heat 6/10 Major 7 d/yr ≥99°F today · 14 d/yr by 30 yrs out
- Wind 6/10 Major 27% chance of damaging wind over 30 yrs
- Air quality 3/10 Moderate 3 unhealthy d/yr today · 4 by 30 yrs out
Nearby sold comps map
Loading sold comps map…
Walkable amenities ~0.75 mi
Loading nearby amenities…
Taxation est. · year 1
- Rental income
- $29,067
- − Mortgage interest
- −$12,603
- − Property taxes
- −$3,375
- − Insurance
- −$1,125
- − Repairs & maintenance
- −$2,325
- − Management
- −$2,325
- − HOA
- −$8,628
- − Depreciation
- −$6,545
- Taxable loss
- −$7,861
- Est. tax savings @ 24.0%
- +$1,887
- After-tax cash flow
- $-2,438/yr
For passive investors: Depreciation is non-cash, so a rental often shows a tax loss while cash-flowing — sheltering income. Rental losses are passive: they offset passive income freely, and up to $25,000/yr can offset ordinary (W-2) income if you actively participate and your MAGI is under $100k (phasing out to $0 by $150k); unused losses carry forward. On sale, claimed depreciation is recaptured at up to 25%, and gains may owe capital-gains tax (a 1031 exchange can defer both). Figures are a year-1 estimate at your 24.0% rate — not tax advice; consult a CPA.
Condition & rehab AI · 12 photos
This one-bedroom unit requires moderate renovations to update the kitchen and paint interior walls, which would significantly increase its resale and rental value.
Repairs flagged
- Moderate kitchen cabinets — dated and worn
- Moderate kitchen countertops — dated and worn
- Moderate kitchen backsplash — dated and worn
- Minor bathroom fixtures — standard and functional
Value-add opportunities
- Both update kitchen cabinets and countertops — modernizes and increases appeal
- Both paint interior walls — freshens the space and improves curb appeal
- Both replace windows — improves natural light and energy efficiency
Renovation cost estimate screening
| Repair item | Severity | Est. cost |
|---|---|---|
| kitchen cabinets · dated and worn | Moderate | $3,000–15,000 |
| kitchen countertops · dated and worn | Moderate | $3,000–15,000 |
| kitchen backsplash · dated and worn | Moderate | $3,000–15,000 |
| bathroom fixtures · standard and functional | Minor | $500–3,000 |
| Total estimated repair cost · 4 items | $9,500–48,000 |
Value-add ROI direction
- Both update kitchen cabinets and countertops — modernizes and increases appeal ↑
- Both paint interior walls — freshens the space and improves curb appeal ↑
- Both replace windows — improves natural light and energy efficiency ↑
ⓘ Cost ranges are severity-bucket heuristics (US national rule-of-thumb). Get contractor quotes + a written scope before underwriting a rehab budget.
Schools (NCES district)
No district data.
Livability — New York
- Score
- 75/100
- State rank
- #268
- US rank
- #4188
Category grades
Schools grade is shown separately in the Schools card above.
Census & demographics
- Census place
- New York, NY
- County
- Bronx County · 1,197,324 people
- City population
- 7,731,280
- Metro
- New York-Newark-Jersey City, NY-NJ-PA
- Population (ZIP)
- 96,421
- Household income
- $49,330
- Rent vs Own
- Severe rent burden
- 10930.0
Population outlook (Bronx County) Hauer SSP2
- Today (2025)
- 1,607,353 people
- By 2030
- 1,681,852 · +4.6%
- By 2040
- 1,824,421 · +13.5%
- By 2050
- 1,945,470 · +21.0%
- By 2075
- 2,187,887 · +36.1%
- By 2100
- 2,244,136 · +39.6%
Race, ethnicity, and origin ACS 2023
- Neighborhood character
- Diverse neighborhood (Simpson 0.62)
- Race & ethnicity
- Hispanic / Latino 53% Black 28% Two or more races 11% White 9% Asian 6% Native American 1%
- Hispanic origin (detail)
- Mexican 7% Puerto Rican 16% Dominican 22%
- Foreign-born
- 39% · Canada, Jamaica
- Languages at home
- 41% English-only · Spanish 45% Other Indo-European 7% French/Haitian/Cajun 1%
Political lean MEDSL · Bronx
- 2024 margin
- Solid D (+45.4) · D 72.7% · R 27.3%
- 2008→2024 swing
- -32.3pp toward R · 2008: 77.8pp · 2024: 45.4pp
- All cycles
- 2024: D+45.4 2020: D+67.6 2016: D+79.1 2012: D+82.9 2008: D+77.8
Not yet ingested
- Civics
- —
Market trends
- HPI YoY
- ▼ -112.76%
- Current HPI
- 231.537
- Rent YoY
- ▲ 9.23%
- Metro
- New York-Newark-Jersey City, NY-NJ-PA
- State GDP YoY
- ▲ 2.60%
- F500 in state
- 92
Industry mix (Fortune 500 HQ in NY)
| Industry | F500 HQs | Revenue |
|---|---|---|
| Financial Services | 10 | $950B |
|
||
| Consumer Goods | 9 | $162B |
|
||
| Insurance | 4 | $225B |
|
||
| Telecommunications | 2 | $144B |
|
||
| Pharmaceuticals | 2 | $112B |
|
||
| Media / Entertainment | 2 | $69B |
|
||
Price history
1 event — show timeline
- 2026-05-27 Listed $225,000 OneKey® MLS as Distributed by MLS Grid
Cash-flow waterfall
monthlySold comps — $/sqft
last 12 mo · ≤1 miLoading sold comps…