 🏗️ New Construction
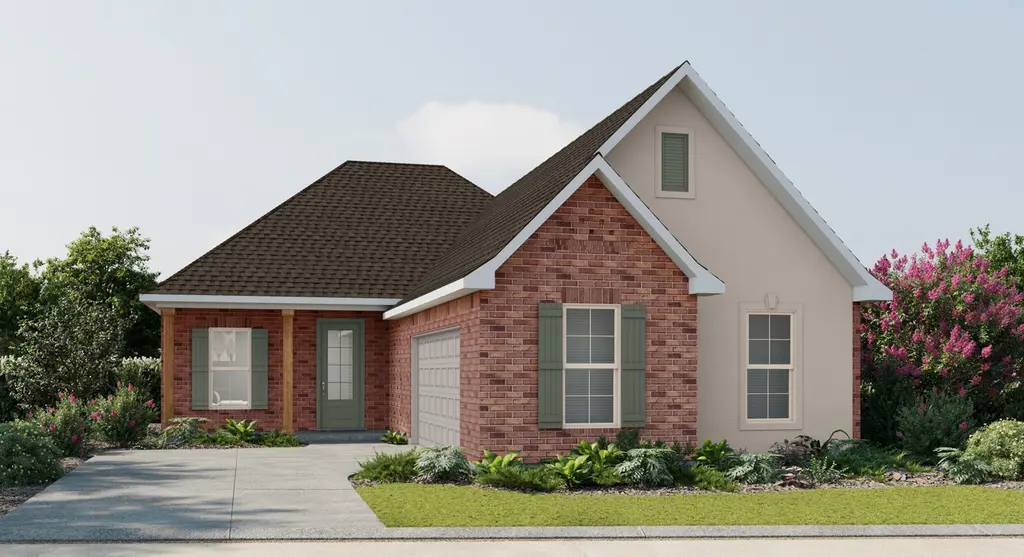
Boucher III A Plan · Sterlington, LA
Flood risk 1/10 · Minimal
- FEMA flood zone
- X (shaded)
- Chance of flooding over 30 yrs
- 0.0%
- Est. flood insurance / yr
- $507 – $1,088
Fire risk 2/10 · Minimal
- Est. fire insurance / yr
- $1,269 – $2,357
Heat risk 7/10 · Major
- Hot days now (above 111°F)
- 7 days/yr
- Hot days in 30 yrs
- 20 days/yr
Wind risk 8/10 · Major
- Chance of severe wind over 30 yrs
- 80.0%
Air-quality risk 1/10 · Minimal
- Unhealthy air days now
- 0 days/yr
- Unhealthy air days in 30 yrs
- 0 days/yr
Risk factors via First Street. Map © Google.
Why this score? — see what drove the D- grade
The composite is a weighted blend of 9 inputs, each scored 0–100. Each bar is that input's sub-score; the figure is the points it added to the 100-point composite (weight × sub-score).
- Appreciation +10.0/10.0
- ARV discount +7.5/15.0
- Cash flow +6.5/30.0
- Livability +3.5/5.0
- Schools +3.2/10.0
- Rent growth +2.5/5.0
- Condition / age +2.5/5.0
- 1% rule +1.6/10.0
- DSCR +0.8/10.0
$322,990
🖨 Deal sheet (PDF) 📄 Offer letter ✓ Due diligence
Listing remarks
Explore the Boucher III A by DSLD Homes, a spacious and stylish 1,917 sq. ft. home featuring 3 bedrooms, 2 bathrooms, and a two-car garage. The attractive brick and stucco exterior offers curb appeal, while the covered rear patio provides the perfect space for outdoor enjoyment. Inside, enjoy wood floors in the living area and recessed lighting throughout the kitchen, dining, and living rooms, creating a warm, modern atmosphere. This open layout includes a walk-in pantry and a convenient boot bench for added functionality. The luxurious master suite features a double vanity, garden tub, and a spacious walk-in closet, offering comfort and style. Designed with quality craftsmanship and energy
Key facts
- Double vanity
- Boot bench
- Wood floors
Tags
Property features AI
Finance
- Financial info: Listing price $322,990
Exterior
- Parking: 2 covered garage spaces (2 total parking spaces)
- Home design: New construction plan: Boucher III A; Single-family home (plan)
- Exterior features: Living area approximately 1,917 (per plan)
Interior
- Bedrooms: 3 bedrooms
- Bathrooms: 2 bathrooms
- Interior features: Open living area (plan Boucher III A)
Neighborhood map
What this means for you Summary
Snapshot
- This is a 3-bed/2.0-bath single-family listed at $323k.
Deal economics
- At list price, monthly cash flow is $-629 ($-8k/yr) — negative.
- To cash-flow at today's rent, offer at most $285k (11.7% below list).
- To meet the 1% rule (rent ≥ 1% of price), the offer needs to be $250k (22.8% below list).
- Recommended offer: $250k (22.8% below list) — sets the bar for 1% rule.
Location & tenants
- Location reads 70/100 on livability (#60 in LA) — a middle-class / working-renter tenant base. Strengths: cost of living A+, housing A+, crime B+; Watch: health & safety D, amenities F, commute F.
- Ouachita Parish (suburban): math 31% / reading 45% proficiency, ranked #26 of 98 in LA (top 26%) — families likely to look elsewhere, expect single-tenant / working-renter base with shorter leases.
- Zoned schools: Sterlington Elementary School (math 56% / reading 65%, grade B-, #62 of 646 statewide, top 10%, 820 students, 45% FRL); Sterlington Middle School (math 50% / reading 58%, grade B-, #19 of 218 statewide, top 9%, 423 students, 48% FRL); Sterlington High School (math 42% / reading 47%, grade F, #58 of 265 statewide, top 23%, 539 students, 41% FRL).
- Zoned-school proficiency averages 53% at this address vs 38% district-wide (+15 pts) — the actual schools serving this property are materially stronger than the Ouachita Parish average implies; a family-tenant draw the district grade alone would hide.
- Market conditions: 189 active listings in the ZIP; 1 comparable units currently listed for rent nearby; 345 units permitted in Ouachita Parish in 2024 (0 in 5+ unit buildings).
Forward outlook
- In year one you build about $40k of equity ($3k loan paydown + $38k appreciation (10.0% local appreciation)).
- By year 2, paydown + projected appreciation supports a ~$65k cash-out refi (75% LTV) — recoverable capital for the next deal without selling this one.
Negotiation context
- It's been on market 62 days — a 6% lower offer ($304k) is reasonable based on typical stale-listing flexibility.
Risks & watch-outs
- Climate carrying-cost: severe wind risk, 80% chance of damaging wind over 30y; extreme-heat days projected 7→20/yr by 2055 (HVAC capex compounding) — expect insurance premiums to compound above CPI over the hold.
Questions for the listing agent
- What do current leases actually rent for vs. the listed asking? Can we see a recent rent roll and the last 12 months of T-12 income?
- It's been on market 62 days. Have you received any prior offers? Is the seller open to a 23% concession, seller financing, or rate buy-down credit?
- Why hasn't it sold? Are there any deal-killer items the seller is aware of (foundation, flood, title, zoning, code violations)?
- Is there a deadline driving the sale (1031 exchange, divorce, estate, relocation)? That informs how much negotiation room exists.
- Schools are A-rated — typically a magnet for longer-tenancy family renters. What's the average tenant stay here, and is there a school-zone premium baked into asking?
- The area grade is low — what's the realistic commute time and amenity access for the typical tenant pool here? Any planned neighborhood developments (good or bad) we should know about?
- What's the average days-on-market for RENTAL listings here right now (not sales)? A rising rental-DOM trend means longer vacancies and softer asking-rent achievability than the comps imply.
- What's the recent tenant-quality profile in this submarket — average credit score on applications, eviction rate, late-payment / NSF rate, and stable-employment percentage? A property-management company in the area should have these aggregated.
- How much new for-sale + rental construction is in the pipeline within 1–3 miles? Heavy new supply typically softens prices + rents 12–24 months out; constrained supply supports both.
Investment metrics
- 1% rule
- 0.66% ✗
- Cap rate
- 4.29%
- Cash-on-cash
- -7.16%
- DSCR
- 0.68
- GRM
- 12.6
CMA / ARV
- ARV (median comp)
- $376,212
- List price
- $322,990
- Delta
- -14.15%
- Verdict
- UNDERPRICED
- Comps
- 8 within 1.0 mi
Show comp detail 1 sale within ~0.75 mi
| Address | Dist | Beds/Ba | Sqft | Sold | Price | $/sf | Match |
|---|---|---|---|---|---|---|---|
| 105 Brook Orchard Cir | 0.73mi | 4/2.0 (+1) | 2,149 (+12%) | 18mo | $340,000 | $158 | 26 |
Match score weights: distance 35% · size 25% · config 20% · recency 20%. Top-matched comps best support the ARV.
Projected returns pro-forma
10.0% appreciation · 3.0% rent growth · sell at horizon
- IRR
- 19.2%
- Equity multiple
- 2.57×
- Total profit
- $164,880
- Equity at exit
- $338,921
- IRR
- 17.7%
- Equity multiple
- 5.91×
- Total profit
- $517,116
- Equity at exit
- $730,896
Cash invested: $105,339 (down + closing). Projections, not guarantees.
Landlord ↔ Tenant lean methodology
- Overall (STATE)
- 90 Strongly Landlord-Friendly
- State Louisiana
- 90 Strongly Landlord-Friendly · R+12
- County
- — inherits STATE
- City
- — inherits STATE
ZIP-level market 71280
- Home prices YoY
- 4.1%
- Active inventory
- 189
- Price-to-rent
- 10.8×
Monthly cashflow live
- Estimated rent
- $2,495 medium interval (Pro) →
- Mortgage (P&I)
- −$1,973
- Tax est. 1.5%
- −$470 /mo · $5,643/yr
- Insurance
- −$157
- HOA
- −$0
- Vacancy / Maint / Mgmt
- −$524
- Net cashflow
- $-629
Break-even live
Sensitivity live
| Price | -10% $-369 | -5% $-499 | +0% $-629 | +5% $-759 | +10% $-889 |
|---|---|---|---|---|---|
| Rent | -10% $-826 | -5% $-727 | +0% $-629 | +5% $-530 | +10% $-432 |
| Rate | -1.0pp $-439 | -0.5pp $-533 | base $-629 | +0.5pp $-726 | +1.0pp $-826 |
UW: 25.0% down · 7.5% · 30yr · 1.5% tax · 5.0% vac · 8.0% maint · 8.0% mgmt
Financing live
Cash to close
- Down payment
- $94,053
- Closing costs
- $11,286
- Reserves months
- —
- Total cash needed
- —
Loan-product check · same deal, 3 products live
Conventional
25% down · 7.5% · 30yr
- Down + closing
- —
- Monthly P&I
- —
- Monthly cashflow
- —
- DSCR
- —
- Eligible?
- —
Personal DTI + credit; lowest rate.
DSCR
20% down · 8.5% · 30yr
- Down + closing
- —
- Monthly P&I
- —
- Monthly cashflow
- —
- DSCR
- —
- Eligible?
- —
No personal income docs; deal must DSCR.
Hard money
10% down · 12.0% · 12mo
- Down + closing
- —
- Monthly P&I
- —
- Monthly cashflow
- —
- DSCR
- —
- Eligible?
- —
Short-term bridge; refi at stabilization.
Rent comps 1 comps
| Address | Beds | Baths | Sqft | Rent | $/sqft | DOM | Units | Dist |
|---|---|---|---|---|---|---|---|---|
| 492 Cliff Bullock Dr Sterlington, LA | 3.0 | 2.0 | 1500 | $2,495 | $1.66 | 45d | 1 | 1.20mi |
Listing history 18 events
-
2026-06-22days on market $322,990 Active 62 DOM
-
2026-06-19days on market $322,990 Active 60 DOM
-
2026-06-18days on market $322,990 Active 59 DOM
-
2026-06-17days on market $322,990 Active 58 DOM
-
2026-06-16days on market $322,990 Active 57 DOM
-
2026-06-15days on market $322,990 Active 56 DOM
-
2026-06-14days on market $322,990 Active 54 DOM
-
2026-06-13days on market $322,990 Active 53 DOM
-
2026-06-10days on market $322,990 Active 51 DOM
-
2026-06-09days on market $322,990 Active 50 DOM
-
2026-06-08days on market $322,990 Active 49 DOM
-
2026-06-07days on market $322,990 Active 48 DOM
-
2026-06-03days on market $322,990 Active 44 DOM
-
2026-06-02days on market $322,990 Active 43 DOM
-
2026-06-01days on market $322,990 Active 42 DOM
-
2026-05-31days on market $322,990 Active 41 DOM
-
2026-05-30days on market $322,990 Active 40 DOM
-
2026-04-20$322,990 Active 765-char remark
ⓘ Source: listings_history table (triggers on properties + properties_extension) + one-shot
backfill from property_details.listing_events for pre-trigger history.
Climate risk First Street
- Flood 1/10 Low FEMA zone X (shaded) · 0% chance over 30 yrs
- Wildfire 2/10 Low
- Heat 7/10 Severe 7 d/yr ≥111°F today · 20 d/yr by 30 yrs out
- Wind 8/10 Severe 80% chance of damaging wind over 30 yrs
- Air quality 1/10 Low 0 unhealthy d/yr today · 0 by 30 yrs out
Nearby sold comps map
Loading sold comps map…
Walkable amenities ~0.75 mi
Loading nearby amenities…
Taxation est. · year 1
- Rental income
- $29,940
- − Mortgage interest
- −$21,074
- − Property taxes
- −$5,643
- − Insurance
- −$1,881
- − Repairs & maintenance
- −$2,395
- − Management
- −$2,395
- − Depreciation
- −$10,944
- Taxable loss
- −$14,393
- Est. tax savings @ 24.0%
- +$3,454
- After-tax cash flow
- $-4,092/yr
For passive investors: Depreciation is non-cash, so a rental often shows a tax loss while cash-flowing — sheltering income. Rental losses are passive: they offset passive income freely, and up to $25,000/yr can offset ordinary (W-2) income if you actively participate and your MAGI is under $100k (phasing out to $0 by $150k); unused losses carry forward. On sale, claimed depreciation is recaptured at up to 25%, and gains may owe capital-gains tax (a 1031 exchange can defer both). Figures are a year-1 estimate at your 24.0% rate — not tax advice; consult a CPA.
Schools (NCES district)
- District
- Ouachita Parish
- NCES district ID
- 2201200
- Math proficiency
- 31% ▼ -38.00%
- Reading proficiency
- 45% ▼ -31.00%
- Median HH income
- $43,316
- Composite
- 32.14/100
- National rank
- #5791
- State rank
- #26 of 98 in LA
Livability — Sterlington
- Score
- 70/100
- State rank
- #60
- US rank
- #7741
Category grades
Schools grade is shown separately in the Schools card above.
Census & demographics
- Population (ZIP)
- 4,999
Population outlook (Ouachita County) Hauer SSP2
- Today (2025)
- 163,370 people
- By 2030
- 165,520 · +1.3%
- By 2040
- 167,652 · +2.6%
- By 2050
- 166,699 · +2.0%
- By 2075
- 156,348 · -4.3%
- By 2100
- 134,102 · -17.9%
Race, ethnicity, and origin ACS 2023
- Neighborhood character
- Predominantly White (74%)
- Race & ethnicity
- White 74% Black 21% Hispanic / Latino 4%
- Common ancestry
- Lithuanian 4% Iranian 2% Danish 1%
- Foreign-born
- 3% · Canada, Jamaica
- Languages at home
- 98% English-only · Spanish 2%
Political lean MEDSL · Ouachita
- 2024 margin
- Strong R (+27.9) · D 35.5% · R 63.3% · Other 1.2%
- 2008→2024 swing
- -2.7pp toward R · 2008: -25.2pp · 2024: -27.9pp
- All cycles
- 2024: R+27.9 2020: R+23.6 2016: R+25.4 2012: R+20.9 2008: R+25.2
Not yet ingested
- Civics
- —
Market trends
- HPI YoY
- ▲ 11.14%
- Current HPI
- 283.4492
- Rent YoY
- —
- Metro
- —
- State GDP YoY
- ▲ 3.29%
- F500 in state
- 10
Industry mix (Fortune 500 HQ in LA)
| Industry | F500 HQs | Revenue |
|---|---|---|
| Telecommunications | 2 | $23B |
|
||
| Utilities | 1 | $12B |
|
||
| Wholesale / Distribution | 1 | $5B |
|
||
| Advertising | 1 | $2B |
|
||
Cash-flow waterfall
monthlySold comps — $/sqft
last 12 mo · ≤1 miLoading sold comps…