 🏗️ New Construction
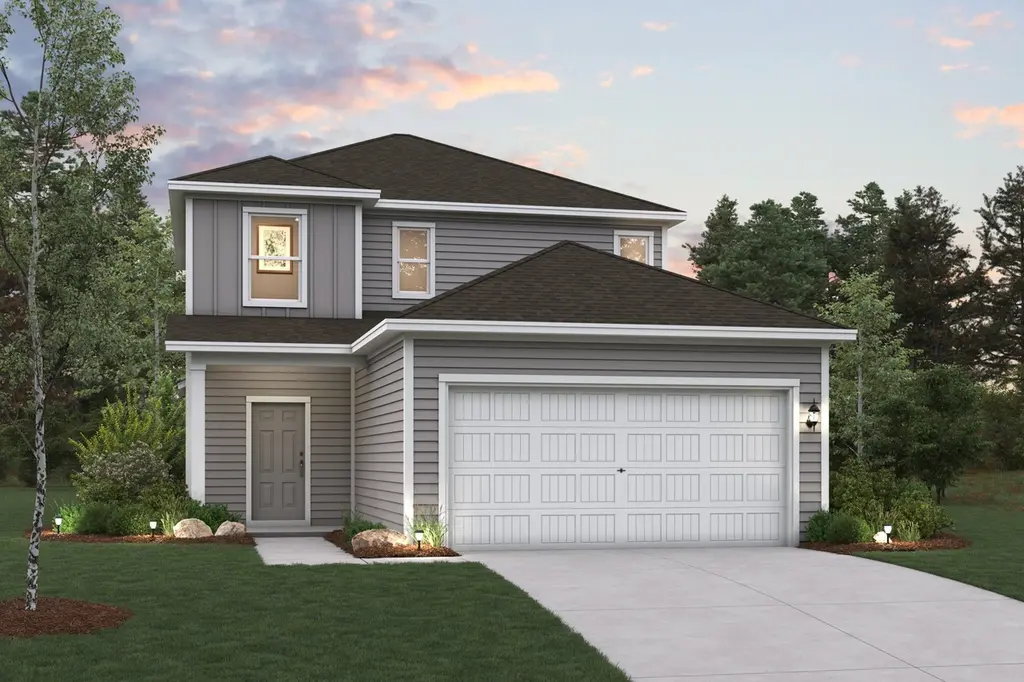
Hampton Plan · Elgin, TX
Flood risk No data
- FEMA flood zone
- —
- Chance of flooding over 30 yrs
- —
- Est. flood insurance / yr
- —
Fire risk No data
- Est. fire insurance / yr
- —
Heat risk No data
- Hot days now (above threshold)
- —
- Hot days in 30 yrs
- —
Wind risk No data
- Chance of severe wind over 30 yrs
- —
Air-quality risk No data
- Unhealthy air days now
- —
- Unhealthy air days in 30 yrs
- —
Risk factors via First Street. Map © Google.
Why this score? — see what drove the D+ grade
The composite is a weighted blend of 9 inputs, each scored 0–100. Each bar is that input's sub-score; the figure is the points it added to the 100-point composite (weight × sub-score).
- Appreciation +10.0/10.0
- Cash flow +9.2/30.0
- ARV discount +7.5/15.0
- Condition / age +4.8/5.0
- Livability +3.7/5.0
- Rent growth +3.3/5.0
- 1% rule +2.8/10.0
- DSCR +2.6/10.0
- Schools +2.0/10.0
$335,990
🖨 Deal sheet (PDF) 📄 Offer letter ✓ Due diligence
Listing remarks MLS
The Hampton plan will have you feeling right at home in no time. Upon entering, a foyer welcomes you into a versatile and accessible open-concept layout, with a lavish kitchen overlooking a generous great room and dining area. The main floor is also home to an expansive owner's suite and primary bathroom, boasting dual vanities and a sizeable walk-in closet. Completing the home, the second floor features three more bedrooms and a loft-perfect for entertainment and relaxation. Options May Include: Covered Patio Laundry sink Second vanity in upstairs bathroom * Photos may not be of exact home. Prices, plans, and terms are effective on the date of publication and subject to change without notice. Square footage/dimensions shown is only an estimate and actual square footage/dimensions will differ. Buyer should rely on his or her own evaluation of usable area. Depictions of homes or other features are artist conceptions. Hardscape, landscape, and other items shown may be decorator suggestions that are not included in the purchase price and availability may vary. ©2025 Century Communities, Inc.
Key facts
- Primary bathroom
- Dual vanities
- Lavish kitchen
Tags
Neighborhood map
What this means for you Summary
Snapshot
- This is a 4-bed/1.5-bath single-family listed at $336k. Condition is rated excellent.
Deal economics
- At list price, monthly cash flow is $-247 ($-3k/yr) — negative.
- To cash-flow at today's rent, offer at most $296k (12.0% below list).
- To meet the 1% rule (rent ≥ 1% of price), the offer needs to be $259k (23.0% below list).
- Recommended offer: $259k (23.0% below list) — sets the bar for 1% rule.
- Cap rate 5.4% vs local median 4.4% in Elgin — meaningfully above typical; check what's discounted (condition, days-on-market, listing class) to confirm the premium yield is real.
Location & tenants
- Location reads 74/100 on livability (#167 in TX, #4,404 nationally) — a middle-class / working-renter tenant base. Strengths: cost of living A+, housing A+, health & safety A+; Watch: amenities F, commute F.
- Elgin ISD (rural): math 17% / reading 26% proficiency, ranked #741 of 826 in TX (top 90%) — low school quality limits family demand, transient renter base, plan for 1-2y turnover; 67% free/reduced lunch — lower-income household profile, screen leases tightly.
- Zoned schools: Elgin El (math 8% / reading 17%, grade F, #4,180 of 4,322 statewide, top 97%, 847 students, 84% FRL); Elgin Middle (math 22% / reading 24%, grade F, #1,327 of 1,662 statewide, top 81%, 780 students, 82% FRL); Elgin H S (math 12% / reading 37%, grade F, #1,264 of 1,632 statewide, top 82%, 1,672 students, 74% FRL).
- Market conditions: Rents rising (+3.1%/yr); 814 active listings in the ZIP; 7 comparable units currently listed for rent nearby; rentals at typical pace (median 26d on market — plan ~3-4 weeks tenant-placement turnaround); solid renter incomes; 1,841 units permitted in Bastrop County in 2024 (150 in 5+ unit buildings).
- This rent runs 31% of the median local income ($99k/yr) — at the standard rent-burdened threshold; future hikes will face affordability resistance.
Forward outlook
- In year one you build about $35k of equity ($2k loan paydown + $33k appreciation (10.0% local appreciation)).
- Bastrop County population projected at +37% by 2050 — long-run rental-demand tailwind backs the buy-and-hold thesis.
- By year 2, paydown + projected appreciation supports a ~$57k cash-out refi (75% LTV) — recoverable capital for the next deal without selling this one.
Negotiation context
- It's been on market 534 days — a 12% lower offer ($296k) is reasonable based on typical stale-listing flexibility.
Questions for the listing agent
- What do current leases actually rent for vs. the listed asking? Can we see a recent rent roll and the last 12 months of T-12 income?
- It's been on market 534 days. Have you received any prior offers? Is the seller open to a 23% concession, seller financing, or rate buy-down credit?
- Why hasn't it sold? Are there any deal-killer items the seller is aware of (foundation, flood, title, zoning, code violations)?
- Is there a deadline driving the sale (1031 exchange, divorce, estate, relocation)? That informs how much negotiation room exists.
- Schools are F-rated, which usually means shorter tenancies and higher turnover. Who's the typical renter profile here, and what's been the actual vacancy rate?
- The area grade is low — what's the realistic commute time and amenity access for the typical tenant pool here? Any planned neighborhood developments (good or bad) we should know about?
- What's the average days-on-market for RENTAL listings here right now (not sales)? A rising rental-DOM trend means longer vacancies and softer asking-rent achievability than the comps imply.
- What's the recent tenant-quality profile in this submarket — average credit score on applications, eviction rate, late-payment / NSF rate, and stable-employment percentage? A property-management company in the area should have these aggregated.
- How much new for-sale + rental construction is in the pipeline within 1–3 miles? Heavy new supply typically softens prices + rents 12–24 months out; constrained supply supports both.
Investment metrics
- 1% rule
- 0.78% ✗
- Cap rate
- 5.40%
- Cash-on-cash
- -3.19%
- DSCR
- 0.86
- GRM
- 10.7
CMA / ARV
- ARV (median comp)
- $331,311
- List price
- $335,990
- Delta
- 1.41%
- Verdict
- FAIR
- Comps
- 20 within 1.0 mi
Show comp detail 12 sales within ~0.75 mi
| Address | Dist | Beds/Ba | Sqft | Sold | Price | $/sf | Match |
|---|---|---|---|---|---|---|---|
| 182 Bendecido Loop | 0.25mi | 4/2.5 | 2,003 (0%) | 1mo | $321,990 | $161 | 83 |
| 170 Hornet St | 0.22mi | 4/3.0 | 1,998 (-0%) | 1mo | $316,935 | $159 | 82 |
| 163 Two Bits Ln | 0.24mi | 4/2.5 | 2,003 (0%) | 3mo | $319,990 | $160 | 82 |
| 129 Two Bits Ln | 0.28mi | 4/2.5 | 2,003 (0%) | 2mo | $314,990 | $157 | 82 |
| 119 Two Bits Ln | 0.29mi | 4/2.5 | 2,003 (0%) | 1mo | $316,990 | $158 | 82 |
| 107 Two Bits Ln | 0.31mi | 4/2.5 | 2,003 (0%) | 2mo | $333,075 | $166 | 80 |
| 136 Tolo Dr | 0.29mi | 4/2.5 | 2,025 (+1%) | 3mo | $309,990 | $153 | 78 |
| 200 Hidalgo Ln | 0.14mi | 4/2.0 | 1,818 (-9%) | 3mo | $321,770 | $177 | 74 |
| 237 Hidalgo Ln | 0.19mi | 4/2.0 | 1,853 (-8%) | 3mo | $358,350 | $193 | 74 |
| 147 Two Bits Ln | 0.26mi | 4/2.5 | 1,785 (-11%) | 3mo | $299,840 | $168 | 64 |
| 446 Lucky Ave | 0.27mi | 4/2.5 | 2,299 (+15%) | 1mo | $337,490 | $147 | 58 |
| 439 Lucky Ave | 0.28mi | 4/2.5 | 2,299 (+15%) | 2mo | $329,490 | $143 | 57 |
Match score weights: distance 35% · size 25% · config 20% · recency 20%. Top-matched comps best support the ARV.
Projected returns pro-forma
10.0% appreciation · 3.12% rent growth · sell at horizon
- IRR
- 22.0%
- Equity multiple
- 2.78×
- Total profit
- $165,092
- Equity at exit
- $298,471
- IRR
- 19.8%
- Equity multiple
- 6.38×
- Total profit
- $499,230
- Equity at exit
- $643,664
Cash invested: $92,767 (down + closing). Projections, not guarantees.
Landlord ↔ Tenant lean methodology
- Overall (STATE)
- 87 Strongly Landlord-Friendly
- State Texas
- 87 Strongly Landlord-Friendly · R+5
- County
- — inherits STATE
- City
- — inherits STATE
ZIP-level market 78621
- Home prices YoY
- 7.6%
- Rents YoY
- 3.1%
- Active inventory
- 814
- Price-to-rent
- 10.8×
Monthly cashflow live
- Estimated rent
- $2,586 high interval (Pro) →
- Mortgage (P&I)
- −$1,737
- Tax est. 1.5%
- −$414 /mo · $4,970/yr
- Insurance
- −$138
- HOA
- −$0
- Vacancy / Maint / Mgmt
- −$543
- Net cashflow
- $-247
Break-even live
Sensitivity live
| Price | -10% $-18 | -5% $-132 | +0% $-247 | +5% $-361 | +10% $-475 |
|---|---|---|---|---|---|
| Rent | -10% $-451 | -5% $-349 | +0% $-247 | +5% $-144 | +10% $-42 |
| Rate | -1.0pp $-80 | -0.5pp $-162 | base $-247 | +0.5pp $-332 | +1.0pp $-420 |
UW: 25.0% down · 7.5% · 30yr · 1.5% tax · 5.0% vac · 8.0% maint · 8.0% mgmt
Financing live
Cash to close
- Down payment
- $82,828
- Closing costs
- $9,939
- Reserves months
- —
- Total cash needed
- —
Loan-product check · same deal, 3 products live
Conventional
25% down · 7.5% · 30yr
- Down + closing
- —
- Monthly P&I
- —
- Monthly cashflow
- —
- DSCR
- —
- Eligible?
- —
Personal DTI + credit; lowest rate.
DSCR
20% down · 8.5% · 30yr
- Down + closing
- —
- Monthly P&I
- —
- Monthly cashflow
- —
- DSCR
- —
- Eligible?
- —
No personal income docs; deal must DSCR.
Hard money
10% down · 12.0% · 12mo
- Down + closing
- —
- Monthly P&I
- —
- Monthly cashflow
- —
- DSCR
- —
- Eligible?
- —
Short-term bridge; refi at stabilization.
Rent comps 7 comps
| Address | Beds | Baths | Sqft | Rent | $/sqft | DOM | Units | Dist |
|---|---|---|---|---|---|---|---|---|
| 174 Gullivers Dr Elgin, TX | 4.0 | 2.5 | 2304 | $2,850 | $1.24 | 45d | 1 | 0.07mi |
| 126 Bendecido Loop Elgin, TX | 4.0 | 2.5 | 2697 | $2,250 | $0.83 | 25d | 1 | 0.15mi |
| 813 Central Ave Elgin, TX | 4.0 | 2.0 | 2025 | $2,300 | $1.14 | 6d | 1 | 0.65mi |
| 209 Lake Placid Run Elgin, TX | 5.0 | 3.0 | 2196 | $2,200 | $1.00 | 25d | 1 | 0.96mi |
| 120 Jim Dandy Dr Elgin, TX | 4.0 | 2.0 | 1650 | $1,923 | $1.17 | 6d | 1 | 0.97mi |
| 212 Lake Placid Run Elgin, TX | 3.0 | 2.5 | 1681 | $1,895 | $1.13 | 0d | 1 | 0.98mi |
| 102 Schuylerville Dr Elgin, TX | 3.0 | 2.0 | 1479 | $1,800 | $1.22 | 45d | 1 | 1.10mi |
Listing history 16 events
-
2026-06-21days on market $335,990 Active 534 DOM
-
2026-06-18days on market $335,990 Active 531 DOM
-
2026-06-17days on market $335,990 Active 530 DOM
-
2026-06-16days on market $335,990 Active 529 DOM
-
2026-06-15days on market $335,990 Active 528 DOM
-
2026-06-13days on market $335,990 Active 526 DOM
-
2026-06-09days on market $335,990 Active 522 DOM
-
2026-06-08days on market $335,990 Active 521 DOM
-
2026-06-07days on market $335,990 Active 520 DOM
-
2026-06-04days on market $335,990 Active 517 DOM
-
2026-06-03days on market $335,990 Active 516 DOM
-
2026-06-02days on market $335,990 Active 515 DOM
-
2026-06-01days on market $335,990 Active 514 DOM
-
2026-05-31days on market $335,990 Active 513 DOM
-
2025-04-03price $335,990 1111-char remark
Show marketing remark (1111 chars)
The Hampton plan will have you feeling right at home in no time. Upon entering, a foyer welcomes you into a versatile and accessible open-concept layout, with a lavish kitchen overlooking a generous great room and dining area. The main floor is also home to an expansive owner's suite and primary bathroom, boasting dual vanities and a sizeable walk-in closet. Completing the home, the second floor features three more bedrooms and a loft-perfect for entertainment and relaxation. Options May Include: Covered Patio Laundry sink Second vanity in upstairs bathroom * Photos may not be of exact home. Prices, plans, and terms are effective on the date of publication and subject to change without notice. Square footage/dimensions shown is only an estimate and actual square footage/dimensions will differ. Buyer should rely on his or her own evaluation of usable area. Depictions of homes or other features are artist conceptions. Hardscape, landscape, and other items shown may be decorator suggestions that are not included in the purchase price and availability may vary. ©2025 Century Communities, Inc.
-
2025-01-03$334,990 Active 1111-char remark
Show marketing remark (1111 chars)
The Hampton plan will have you feeling right at home in no time. Upon entering, a foyer welcomes you into a versatile and accessible open-concept layout, with a lavish kitchen overlooking a generous great room and dining area. The main floor is also home to an expansive owner's suite and primary bathroom, boasting dual vanities and a sizeable walk-in closet. Completing the home, the second floor features three more bedrooms and a loft-perfect for entertainment and relaxation. Options May Include: Covered Patio Laundry sink Second vanity in upstairs bathroom * Photos may not be of exact home. Prices, plans, and terms are effective on the date of publication and subject to change without notice. Square footage/dimensions shown is only an estimate and actual square footage/dimensions will differ. Buyer should rely on his or her own evaluation of usable area. Depictions of homes or other features are artist conceptions. Hardscape, landscape, and other items shown may be decorator suggestions that are not included in the purchase price and availability may vary. ©2025 Century Communities, Inc.
ⓘ Source: listings_history table (triggers on properties + properties_extension) + one-shot
backfill from property_details.listing_events for pre-trigger history.
Nearby sold comps map
Loading sold comps map…
Walkable amenities ~0.75 mi
Loading nearby amenities…
Taxation est. · year 1
- Rental income
- $31,035
- − Mortgage interest
- −$18,559
- − Property taxes
- −$4,970
- − Insurance
- −$1,657
- − Repairs & maintenance
- −$2,483
- − Management
- −$2,483
- − Depreciation
- −$9,638
- Taxable loss
- −$8,754
- Est. tax savings @ 24.0%
- +$2,101
- After-tax cash flow
- $-857/yr
For passive investors: Depreciation is non-cash, so a rental often shows a tax loss while cash-flowing — sheltering income. Rental losses are passive: they offset passive income freely, and up to $25,000/yr can offset ordinary (W-2) income if you actively participate and your MAGI is under $100k (phasing out to $0 by $150k); unused losses carry forward. On sale, claimed depreciation is recaptured at up to 25%, and gains may owe capital-gains tax (a 1031 exchange can defer both). Figures are a year-1 estimate at your 24.0% rate — not tax advice; consult a CPA.
Condition & rehab AI · 12 photos
This home is in excellent condition with modern finishes and a well-maintained exterior. It is move-in ready and would benefit from a fresh coat of paint and some landscaping to further enhance its curb appeal and value.
Value-add opportunities
- Both landscaping — enhances curb appeal and adds value
- Both painting — refreshes interior and exterior
- Both landscaping — enhances curb appeal and adds value
Renovation cost estimate screening
Value-add ROI direction
- Both landscaping — enhances curb appeal and adds value ↑
- Both painting — refreshes interior and exterior ↑
- Both landscaping — enhances curb appeal and adds value ↑
ⓘ Cost ranges are severity-bucket heuristics (US national rule-of-thumb). Get contractor quotes + a written scope before underwriting a rehab budget.
Schools (NCES district)
- District
- Elgin ISD
- NCES district ID
- 4818360
- Math proficiency
- 17% ▼ -9.00%
- Reading proficiency
- 26% ▼ -5.00%
- Median HH income
- $55,176
- Composite
- 19.62/100
- National rank
- #8749
- State rank
- #741 of 826 in TX
Livability — Elgin
- Score
- 74/100
- State rank
- #167
- US rank
- #4404
Category grades
Schools grade is shown separately in the Schools card above.
Census & demographics
- County
- Bastrop County · 68,601 people
- City population
- 27,860
- Metro
- Austin-Round Rock-Georgetown, TX
- Population (ZIP)
- 30,411
- Household income
- $98,534
- Rent vs Own
- Severe rent burden
- 235.0
Population outlook (Bastrop County) Hauer SSP2
- Today (2025)
- 94,260 people
- By 2030
- 101,355 · +7.5%
- By 2040
- 115,578 · +22.6%
- By 2050
- 129,464 · +37.3%
- By 2075
- 168,068 · +78.3%
- By 2100
- 194,857 · +106.7%
Race, ethnicity, and origin ACS 2023
- Neighborhood character
- Diverse neighborhood (Simpson 0.64)
- Race & ethnicity
- Hispanic / Latino 46% White 38% Two or more races 19% Black 11% Native American 1%
- Hispanic origin (detail)
- Mexican 38%
- Common ancestry
- Slovak 2% Italian 2% Romanian 1%
- Foreign-born
- 17% · Canada, Vietnam
- Languages at home
- 63% English-only · Spanish 36%
Political lean MEDSL · Bastrop
- 2024 margin
- R (+18.4) · D 40.2% · R 58.6% · Other 1.2%
- 2008→2024 swing
- -10.2pp toward R · 2008: -8.2pp · 2024: -18.4pp
- All cycles
- 2024: R+18.4 2020: R+13.8 2016: R+20.4 2012: R+17.0 2008: R+8.2
Not yet ingested
- Civics
- —
Market trends
- HPI YoY
- ▲ 29.47%
- Current HPI
- 416.87
- Rent YoY
- ▲ 3.12%
- Metro
- Austin-Round Rock-Georgetown, TX
- State GDP YoY
- ▲ 3.95%
- F500 in state
- 110
Industry mix (Fortune 500 HQ in TX)
| Industry | F500 HQs | Revenue |
|---|---|---|
| Energy | 16 | $1,198B |
|
||
| Technology | 5 | $198B |
|
||
| Engineering / Construction | 4 | $72B |
|
||
| Energy Services | 3 | $60B |
|
||
| Utilities | 3 | $41B |
|
||
| Healthcare | 2 | $330B |
|
||
Price history
+0.3% since first listed2 events — show timeline
- 2025-04-03 Price Changed $335,990 Zillow
- 2025-01-03 Listed $334,990 Zillow
Cash-flow waterfall
monthlySold comps — $/sqft
last 12 mo · ≤1 miLoading sold comps…