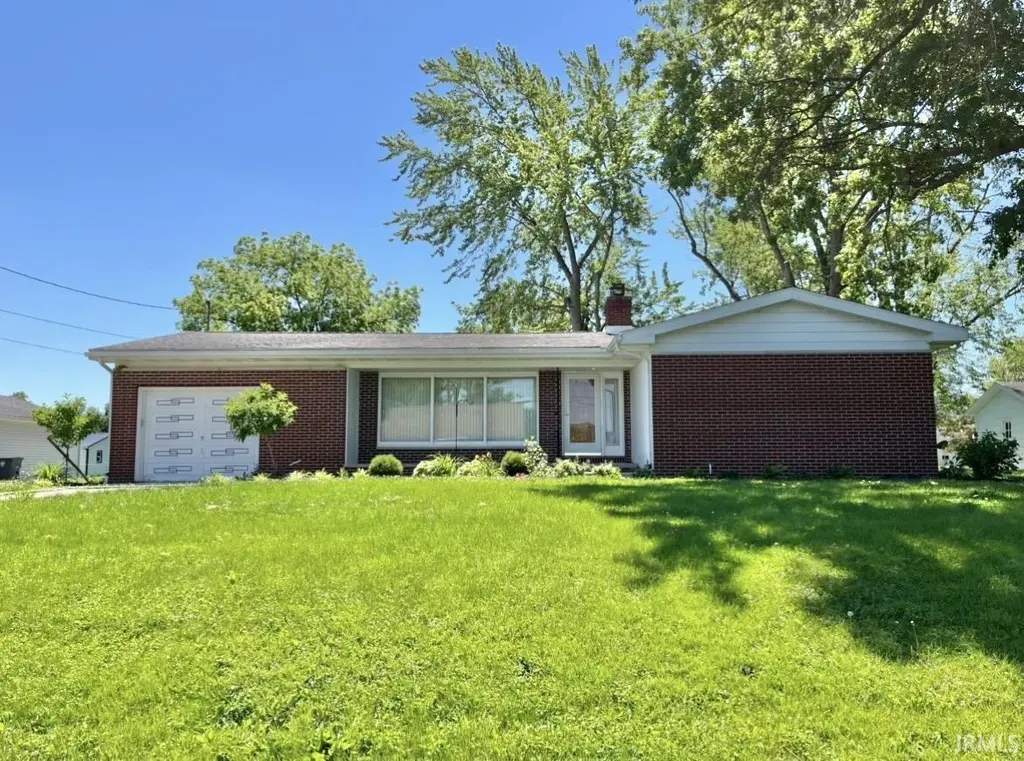
529 Floral Ave · Portland, IN
Flood risk 1/10 · Minimal
- FEMA flood zone
- X (unshaded)
- Chance of flooding over 30 yrs
- 0.0%
- Est. flood insurance / yr
- $473 – $860
Fire risk 1/10 · Minimal
- Est. fire insurance / yr
- $717 – $1,331
Heat risk 3/10 · Minor
- Hot days now (above 100°F)
- 7 days/yr
- Hot days in 30 yrs
- 18 days/yr
Wind risk 2/10 · Minimal
- Chance of severe wind over 30 yrs
- 1.0%
Air-quality risk 3/10 · Minor
- Unhealthy air days now
- 2 days/yr
- Unhealthy air days in 30 yrs
- 4 days/yr
Risk factors via First Street. Map © Google.
Why this score? — see what drove the F grade
The composite is a weighted blend of 9 inputs, each scored 0–100. Each bar is that input's sub-score; the figure is the points it added to the 100-point composite (weight × sub-score).
- Cash flow +12.7/30.0
- DSCR +3.8/10.0
- Livability +3.5/5.0
- Schools +3.2/10.0
- 1% rule +2.6/10.0
- Rent growth +2.5/5.0
- Condition / age +2.5/5.0
- ARV discount +0.0/15.0
- Appreciation +0.0/10.0
$159,900
🖨 Deal sheet (PDF) 📄 Offer letter ✓ Due diligence
Key facts
- 0.72 acre lot
- Garage
- Built 1961
Property features AI
Exterior
- Parking: Attached concrete garage (1 car)
- Utilities: Public water; Public sewer
- Home design: Single-family residence, site-built; One story
- Construction: Brick and vinyl siding exterior; Asphalt shingle roof; Full finished basement (below grade finished area present)
- Exterior features: Landscaped lot; No fencing; Second (detached) garage
Interior
- Kitchen: Double oven
- Bedrooms: 6 total rooms (includes bedrooms and living areas)
- Flooring: Hardwood; Tile; Vinyl
- Bathrooms: 2 full bathrooms; 1 main-level bathroom
- Heating & cooling: Natural gas forced-air heating; Central air conditioning
- Interior features: Walk-in closets; Natural woodwork; Window treatments; Finished full basement with sump pump; Basement fireplace
- Laundry & utility: Washer hookup on main level; Washer included; Water softener (owned); Gas water heater
Neighborhood map
What this means for you Summary
Snapshot
- This is a 3-bed/2.0-bath single-family listed at $160k.
Deal economics
- At list price, monthly cash flow is $-17 ($-205/yr) — negative.
- To cash-flow at today's rent, offer at most $157k (1.9% below list).
- To meet the 1% rule (rent ≥ 1% of price), the offer needs to be $122k (23.9% below list).
- Recommended offer: $122k (23.9% below list) — sets the bar for 1% rule.
- Cap rate 6.2% vs local median 4.7% in Portland — top-decile yield for the area; either an underpriced asset or a hidden risk that comps aren't pricing in. Stress-test before assuming the spread holds.
Location & tenants
- Location reads 69/100 on livability (#191 in IN) — a middle-class / working-renter tenant base. Strengths: cost of living A+, housing A+; Watch: commute C-, health & safety D, amenities F.
- Jay School Corporation (rural): math 38% / reading 37% proficiency, ranked #175 of 301 in IN (top 58%) — families likely to look elsewhere, expect single-tenant / working-renter base with shorter leases.
- Zoned schools: East Jay Elementary (math 37% / reading 34%, grade F, #584 of 994 statewide, top 59%, 540 students, 56% FRL); Jay County Jr/Sr High School (math 34% / reading 41%, grade F, #245 of 369 statewide, top 67%, 1,242 students, 50% FRL).
- Market conditions: 5 active listings in the ZIP; 19 units permitted in Jay County in 2024 (0 in 5+ unit buildings).
Forward outlook
- Local home prices are declining (-3.0%/yr); year-one equity from $1k of loan paydown is wiped out by about $5k of value loss. Plan a longer hold.
- Jay County population projected at -12% by 2050 — secular population decline; favor cash flow + early exit over multi-decade hold.
Negotiation context
- Only 3 days on market — expect competitive offers; lowballing is unlikely to land.
Questions for the listing agent
- What do current leases actually rent for vs. the listed asking? Can we see a recent rent roll and the last 12 months of T-12 income?
- Built in 1961 — when were the roof, HVAC, electrical panel, plumbing, and water heater last replaced?
- Is there a deadline driving the sale (1031 exchange, divorce, estate, relocation)? That informs how much negotiation room exists.
- Schools are D-rated, which usually means shorter tenancies and higher turnover. Who's the typical renter profile here, and what's been the actual vacancy rate?
- The area grade is low — what's the realistic commute time and amenity access for the typical tenant pool here? Any planned neighborhood developments (good or bad) we should know about?
- What's the average days-on-market for RENTAL listings here right now (not sales)? A rising rental-DOM trend means longer vacancies and softer asking-rent achievability than the comps imply.
- What's the recent tenant-quality profile in this submarket — average credit score on applications, eviction rate, late-payment / NSF rate, and stable-employment percentage? A property-management company in the area should have these aggregated.
- How much new for-sale + rental construction is in the pipeline within 1–3 miles? Heavy new supply typically softens prices + rents 12–24 months out; constrained supply supports both.
Investment metrics
- 1% rule
- 0.76% ✗
- Cap rate
- 6.16%
- Cash-on-cash
- -0.46%
- DSCR
- 0.98
- GRM
- 11.0
CMA / ARV
- ARV (on-the-fly)
- $122,016
- Comps found
- 9
Show comp detail 9 sales within ~0.75 mi
| Address | Dist | Beds/Ba | Sqft | Sold | Price | $/sf | Match |
|---|---|---|---|---|---|---|---|
| 534 E Floral Ave | 0.03mi | 3/1.0 | 1,664 (+12%) | 7mo | $135,000 | $81 | 69 |
| 314 W Tenth St | 0.47mi | 3/2.0 | 1,456 (-2%) | 14mo | $170,000 | $117 | 63 |
| 909 S Meridian St | 0.31mi | 3/1.0 | 1,575 (+6%) | 13mo | $95,000 | $60 | 61 |
| 1009 S Meridian St | 0.28mi | 3/1.0 | 1,564 (+5%) | 17mo | $137,900 | $88 | 60 |
| 703 S Meridian St | 0.46mi | 3/1.5 | 1,425 (-4%) | 14mo | $137,000 | $96 | 58 |
| 1114 S Bridge St | 0.44mi | 3/1.5 | 1,372 (-8%) | 11mo | $158,000 | $115 | 55 |
| 715 S Bridge St | 0.54mi | 4/1.5 (+1) | 1,512 (+2%) | 14mo | $120,000 | $79 | 54 |
| 915 S Vine St | 0.26mi | 3/1.0 | 1,296 (-13%) | 23mo | $105,900 | $82 | 43 |
| 441 S Vine St | 0.59mi | 4/1.0 (+1) | 1,462 (-2%) | 23mo | $108,000 | $74 | 42 |
Match score weights: distance 35% · size 25% · config 20% · recency 20%. Top-matched comps best support the ARV.
Projected returns pro-forma
-3.0% appreciation · 3.0% rent growth · sell at horizon
- IRR
- -17.1%
- Equity multiple
- 0.40×
- Total profit
- $-27,058
- Equity at exit
- $23,842
- IRR
- -9.1%
- Equity multiple
- 0.44×
- Total profit
- $-25,206
- Equity at exit
- $13,825
Cash invested: $44,772 (down + closing). Projections, not guarantees.
Landlord ↔ Tenant lean methodology
- Overall (STATE)
- 90 Strongly Landlord-Friendly
- State Indiana
- 90 Strongly Landlord-Friendly · R+11
- County
- — inherits STATE
- City
- — inherits STATE
ZIP-level market 47340
- Home prices YoY
- -5.1%
- Active inventory
- 5
- Price-to-rent
- 11.0×
Monthly cashflow live
- Estimated rent
- $1,216 medium interval (Pro) →
- Mortgage (P&I)
- −$839
- Tax from tax record
- −$73 /mo · $873/yr
- Insurance
- −$67
- HOA
- −$0
- Vacancy / Maint / Mgmt
- −$255
- Net cashflow
- $-17
Break-even live
Sensitivity live
| Price | -10% $73 | -5% $28 | +0% $-17 | +5% $-62 | +10% $-108 |
|---|---|---|---|---|---|
| Rent | -10% $-113 | -5% $-65 | +0% $-17 | +5% $31 | +10% $79 |
| Rate | -1.0pp $63 | -0.5pp $24 | base $-17 | +0.5pp $-59 | +1.0pp $-101 |
UW: 25.0% down · 7.5% · 30yr · 1.5% tax · 5.0% vac · 8.0% maint · 8.0% mgmt
Financing live
Cash to close
- Down payment
- $39,975
- Closing costs
- $4,797
- Reserves months
- —
- Total cash needed
- —
Loan-product check · same deal, 3 products live
Conventional
25% down · 7.5% · 30yr
- Down + closing
- —
- Monthly P&I
- —
- Monthly cashflow
- —
- DSCR
- —
- Eligible?
- —
Personal DTI + credit; lowest rate.
DSCR
20% down · 8.5% · 30yr
- Down + closing
- —
- Monthly P&I
- —
- Monthly cashflow
- —
- DSCR
- —
- Eligible?
- —
No personal income docs; deal must DSCR.
Hard money
10% down · 12.0% · 12mo
- Down + closing
- —
- Monthly P&I
- —
- Monthly cashflow
- —
- DSCR
- —
- Eligible?
- —
Short-term bridge; refi at stabilization.
Listing history 2 events
-
2026-06-07statusdays on market $159,900 Pending 3 DOM
-
2026-06-05$159,900 Active 1 DOM
ⓘ Source: listings_history table (triggers on properties + properties_extension) + one-shot
backfill from property_details.listing_events for pre-trigger history.
Tax reassessment forecast IN · Partial reset (capped growth)
- Current annual tax
- $873 · $73/mo
- Projected year-2 tax
- $1,116 · $93/mo
- Expected delta
- +$243/yr (+$20/mo · 27.9%)
ⓘ Screening estimate from a state-policy table — verify with the county assessor before closing.
Climate risk First Street
- Flood 1/10 Low FEMA zone X (unshaded) · 0% chance over 30 yrs
- Wildfire 1/10 Low
- Heat 3/10 Moderate 7 d/yr ≥100°F today · 18 d/yr by 30 yrs out
- Wind 2/10 Low 100% chance of damaging wind over 30 yrs
- Air quality 3/10 Moderate 2 unhealthy d/yr today · 4 by 30 yrs out
Nearby sold comps map
Loading sold comps map…
Walkable amenities ~0.75 mi
Loading nearby amenities…
Taxation est. · year 1
- Rental income
- $14,595
- − Mortgage interest
- −$8,957
- − Property taxes
- −$873
- − Insurance
- −$800
- − Repairs & maintenance
- −$1,168
- − Management
- −$1,168
- − Depreciation
- −$4,652
- Taxable loss
- −$3,021
- Est. tax savings @ 24.0%
- +$725
- After-tax cash flow
- $520/yr
For passive investors: Depreciation is non-cash, so a rental often shows a tax loss while cash-flowing — sheltering income. Rental losses are passive: they offset passive income freely, and up to $25,000/yr can offset ordinary (W-2) income if you actively participate and your MAGI is under $100k (phasing out to $0 by $150k); unused losses carry forward. On sale, claimed depreciation is recaptured at up to 25%, and gains may owe capital-gains tax (a 1031 exchange can defer both). Figures are a year-1 estimate at your 24.0% rate — not tax advice; consult a CPA.
Schools (NCES district)
- District
- Jay School Corporation
- NCES district ID
- 1804980
- Math proficiency
- 38% ▼ -13.00%
- Reading proficiency
- 37% ▼ -13.00%
- Median HH income
- $40,841
- Composite
- 31.56/100
- National rank
- #5954
- State rank
- #175 of 301 in IN
Livability — Portland
- Score
- 69/100
- State rank
- #191
- US rank
- #8739
Category grades
Schools grade is shown separately in the Schools card above.
Census & demographics
- Census place
- Portland, IN
- Population (ZIP)
- 3,267
Population outlook (Jay County) Hauer SSP2
- Today (2025)
- 20,586 people
- By 2030
- 20,155 · -2.1%
- By 2040
- 19,274 · -6.4%
- By 2050
- 18,203 · -11.6%
- By 2075
- 15,062 · -26.8%
- By 2100
- 10,857 · -47.3%
Race, ethnicity, and origin ACS 2023
- Neighborhood character
- Predominantly White (94%)
- Race & ethnicity
- White 94% Two or more races 2%
- Common ancestry
- Italian 3% Slovak 1% Iranian 1%
- Foreign-born
- 1% · Canada
- Languages at home
- 98% English-only · German/W. Germanic 1% Spanish 1%
Political lean MEDSL · Jay
- 2024 margin
- Solid R (+55.2) · D 21.6% · R 76.7% · Other 1.7%
- 2008→2024 swing
- -47.3pp toward R · 2008: -7.8pp · 2024: -55.2pp
- All cycles
- 2024: R+55.2 2020: R+52.4 2016: R+47.8 2012: R+20.0 2008: R+7.8
Not yet ingested
- Civics
- —
Market trends
- HPI YoY
- ▼ -11.64%
- Current HPI
- 216.9007
- Rent YoY
- —
- Metro
- —
- State GDP YoY
- ▲ 2.90%
- F500 in state
- 18
Industry mix (Fortune 500 HQ in IN)
| Industry | F500 HQs | Revenue |
|---|---|---|
| Industrial Machinery | 2 | $37B |
|
||
| Healthcare | 1 | $177B |
|
||
| Pharmaceuticals | 1 | $45B |
|
||
| Metals / Steel | 1 | $18B |
|
||
| Agriculture | 1 | $17B |
|
||
| Packaging | 1 | $12B |
|
||
Price history
1 event — show timeline
- 2026-06-04 Listed $159,900 IRMLS
Property tax history
+4.0%/yrLatest (2025): $873 · +16.8% YoY. Source: county tax records.
Cash-flow waterfall
monthlySold comps — $/sqft
last 12 mo · ≤1 miLoading sold comps…