7077 Pleasant Hill Dr · Dunbar, SC
Flood risk 1/10 · Minimal
- FEMA flood zone
- X (unshaded)
- Chance of flooding over 30 yrs
- 0.0%
- Est. flood insurance / yr
- $507 – $1,088
Fire risk 7/10 · Major
- Est. fire insurance / yr
- $783 – $1,453
Heat risk 8/10 · Major
- Hot days now (above 107°F)
- 7 days/yr
- Hot days in 30 yrs
- 17 days/yr
Wind risk 8/10 · Major
- Chance of severe wind over 30 yrs
- 96.0%
Air-quality risk 2/10 · Minimal
- Unhealthy air days now
- 2 days/yr
- Unhealthy air days in 30 yrs
- 2 days/yr
Risk factors via First Street. Map © Google.
Why this score? — see what drove the B grade
The composite is a weighted blend of 9 inputs, each scored 0–100. Each bar is that input's sub-score; the figure is the points it added to the 100-point composite (weight × sub-score).
- Cash flow +30.0/30.0
- DSCR +10.0/10.0
- Appreciation +8.9/10.0
- ARV discount +7.5/15.0
- 1% rule +7.4/10.0
- Schools +2.7/10.0
- Rent growth +2.5/5.0
- Livability +2.5/5.0
- Condition / age +2.5/5.0
$85,000
🖨 Deal sheet (PDF) 📄 Offer letter ✓ Due diligence
Listing remarks
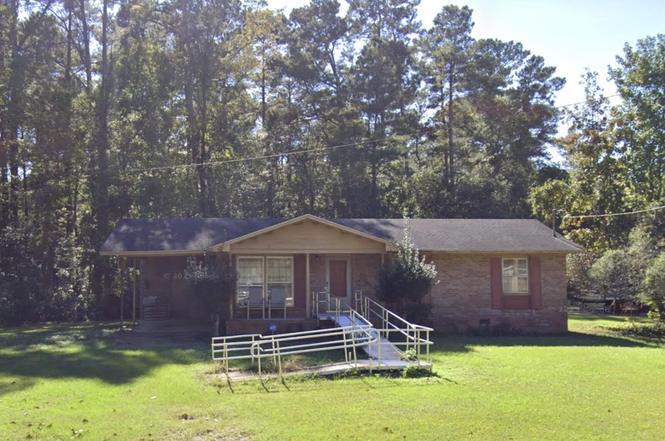
Welcome to this charming all-brick home nestled in the heart of Hemingway, South Carolina — a quiet Lowcountry town known for its small-town charm, friendly community, and relaxed pace of life. Situated on a large, spacious lot, this property offers a ton of potential. Whether you're envisioning a backyard garden, outdoor entertaining space, workshop, or future expansion, there’s plenty of room to bring your ideas to life. The solid all-brick construction not only adds timeless curb appeal but also provides durability and low-maintenance living for years to come. Conveniently located close to great local restaurants, shops, and everyday essentials, you’ll enjoy the comfort
Key facts
- Solid construction
- Large spacious lot
- All brick home
Tags
Property features AI
Finance
- HOA & community: Monthly association fee
Exterior
- Parking: 4 parking spaces
- Home design: Single-story residence; Resale property
- Exterior features: Approximately 0.7-acre lot (estimated); Zoned residential
Interior
- Bathrooms: 2 full bathrooms
- Interior features: Unfurnished
Neighborhood map
What this means for you Summary
Snapshot
- This is a 3-bed/2.0-bath single-family listed at $85k.
Deal economics
- At list price, monthly cash flow is $327 ($4k/yr) — positive.
- The deal already cash-flows at list — no discount required.
- Meets the 1% rule at list price ($1k rent vs $85k).
- Recommended offer: $75k (12.0% below list) — sets the bar for market timing.
Location & tenants
- Location reads: area grade B — affects rentability + tenant quality, not the cash-flow math above.
- Georgetown 01 (town): math 26% / reading 38% proficiency, ranked #51 of 80 in SC (top 64%) — families likely to look elsewhere, expect single-tenant / working-renter base with shorter leases.
- Market conditions: 40 active listings in the ZIP; 323 units permitted in Georgetown County in 2024 (0 in 5+ unit buildings).
Forward outlook
- In year one you build about $7k of equity ($588 loan paydown + $7k appreciation (7.8% local appreciation)).
- At projected returns (7.8% appreciation + 3.0% rent growth), your $24k cash investment doubles in ~3 years — after that, you're playing with house money.
- By year 5, paydown + projected appreciation supports a ~$32k cash-out refi (75% LTV) — recoverable capital for the next deal without selling this one.
Negotiation context
- It's been on market 124 days — a 12% lower offer ($75k) is reasonable based on typical stale-listing flexibility.
- 2 sale attempts with the ask held roughly flat each time — persistent listings suggest the price (not the market) is what's stuck; bring a comps-based counter.
- Current owner paid $40k; list at $85k implies a 112% gain — meaningful room to come down on a strong offer.
Risks & watch-outs
- Climate carrying-cost: severe wind risk, 96% chance of damaging wind over 30y; major wildfire risk; extreme-heat days projected 7→17/yr by 2055 (HVAC capex compounding) — expect insurance premiums to compound above CPI over the hold.
Questions for the listing agent
- It's been on market 124 days. Have you received any prior offers? Is the seller open to a 12% concession, seller financing, or rate buy-down credit?
- Why hasn't it sold? Are there any deal-killer items the seller is aware of (foundation, flood, title, zoning, code violations)?
- Is there a deadline driving the sale (1031 exchange, divorce, estate, relocation)? That informs how much negotiation room exists.
- What's the average days-on-market for RENTAL listings here right now (not sales)? A rising rental-DOM trend means longer vacancies and softer asking-rent achievability than the comps imply.
- What's the recent tenant-quality profile in this submarket — average credit score on applications, eviction rate, late-payment / NSF rate, and stable-employment percentage? A property-management company in the area should have these aggregated.
- How much new for-sale + rental construction is in the pipeline within 1–3 miles? Heavy new supply typically softens prices + rents 12–24 months out; constrained supply supports both.
Investment metrics
- 1% rule
- 1.24% ✓
- Cap rate
- 10.91%
- Cash-on-cash
- 16.50%
- DSCR
- 1.73
- GRM
- 6.7
CMA / ARV
No comps found within radius.
Projected returns pro-forma
7.75% appreciation · 3.0% rent growth · sell at horizon
- IRR
- 32.4%
- Equity multiple
- 3.29×
- Total profit
- $54,466
- Equity at exit
- $63,135
- IRR
- 29.0%
- Equity multiple
- 6.98×
- Total profit
- $142,442
- Equity at exit
- $123,973
Cash invested: $23,800 (down + closing). Projections, not guarantees.
Landlord ↔ Tenant lean methodology
- Overall (STATE)
- 90 Strongly Landlord-Friendly
- State South Carolina
- 90 Strongly Landlord-Friendly · R+6
- County
- — inherits STATE
- City
- — inherits STATE
ZIP-level market 29554
- Home prices YoY
- 4.9%
- Active inventory
- 40
- Price-to-rent
- 6.7×
Monthly cashflow live
- Estimated rent
- $1,052 medium interval (Pro) →
- Mortgage (P&I)
- −$446
- Tax from tax record
- −$23 /mo · $271/yr
- Insurance
- −$35
- HOA
- −$0
- Vacancy / Maint / Mgmt
- −$221
- Net cashflow
- $327
Break-even live
Sensitivity live
| Price | -10% $375 | -5% $351 | +0% $327 | +5% $303 | +10% $279 |
|---|---|---|---|---|---|
| Rent | -10% $244 | -5% $286 | +0% $327 | +5% $369 | +10% $410 |
| Rate | -1.0pp $370 | -0.5pp $349 | base $327 | +0.5pp $305 | +1.0pp $283 |
UW: 25.0% down · 7.5% · 30yr · 1.5% tax · 5.0% vac · 8.0% maint · 8.0% mgmt
Financing live
Cash to close
- Down payment
- $21,250
- Closing costs
- $2,550
- Reserves months
- —
- Total cash needed
- —
Loan-product check · same deal, 3 products live
Conventional
25% down · 7.5% · 30yr
- Down + closing
- —
- Monthly P&I
- —
- Monthly cashflow
- —
- DSCR
- —
- Eligible?
- —
Personal DTI + credit; lowest rate.
DSCR
20% down · 8.5% · 30yr
- Down + closing
- —
- Monthly P&I
- —
- Monthly cashflow
- —
- DSCR
- —
- Eligible?
- —
No personal income docs; deal must DSCR.
Hard money
10% down · 12.0% · 12mo
- Down + closing
- —
- Monthly P&I
- —
- Monthly cashflow
- —
- DSCR
- —
- Eligible?
- —
Short-term bridge; refi at stabilization.
Listing history 18 events
-
2026-06-18days on market $85,000 Active 124 DOM
-
2026-06-17days on market $85,000 Active 123 DOM
-
2026-06-16days on market $85,000 Active 122 DOM
-
2026-06-15days on market $85,000 Active 121 DOM
-
2026-06-14pricedays on market $85,000 Active 119 DOM
-
2026-06-10days on market $89,000 Active 116 DOM
-
2026-06-09days on market $89,000 Active 115 DOM
-
2026-06-08days on market $89,000 Active 114 DOM
-
2026-06-07days on market $89,000 Active 113 DOM
-
2026-06-03days on market $89,000 Active 109 DOM
-
2026-06-02days on market $89,000 Active 108 DOM
-
2026-06-01days on market $89,000 Active 107 DOM
-
2026-05-31days on market $89,000 Active 106 DOM
-
2026-05-30days on market $89,000 Active 105 DOM
-
2026-02-14$89,000 Active
-
2026-02-10historical
-
2026-02-07$89,000 Active
-
2000-06-01soldstatus $40,000
ⓘ Source: listings_history table (triggers on properties + properties_extension) + one-shot
backfill from property_details.listing_events for pre-trigger history.
Tax reassessment forecast SC · Resets to sale price
- Current annual tax
- $271 · $23/mo
- Projected year-2 tax
- $484 · $40/mo
- Expected delta
- +$214/yr (+$18/mo · 79.0%)
ⓘ Screening estimate from a state-policy table — verify with the county assessor before closing.
Climate risk First Street
- Flood 1/10 Low FEMA zone X (unshaded) · 0% chance over 30 yrs
- Wildfire 7/10 Severe
- Heat 8/10 Severe 7 d/yr ≥107°F today · 17 d/yr by 30 yrs out
- Wind 8/10 Severe 96% chance of damaging wind over 30 yrs
- Air quality 2/10 Low 2 unhealthy d/yr today · 2 by 30 yrs out
Nearby sold comps map
Loading sold comps map…
Walkable amenities ~0.75 mi
Loading nearby amenities…
Taxation est. · year 1
- Rental income
- $12,622
- − Mortgage interest
- −$4,761
- − Property taxes
- −$271
- − Insurance
- −$425
- − Repairs & maintenance
- −$1,010
- − Management
- −$1,010
- − Depreciation
- −$2,473
- Taxable income
- $2,673
- Est. tax owed @ 24.0%
- −$641
- After-tax cash flow
- $3,285/yr
For passive investors: Depreciation is non-cash, so a rental often shows a tax loss while cash-flowing — sheltering income. Rental losses are passive: they offset passive income freely, and up to $25,000/yr can offset ordinary (W-2) income if you actively participate and your MAGI is under $100k (phasing out to $0 by $150k); unused losses carry forward. On sale, claimed depreciation is recaptured at up to 25%, and gains may owe capital-gains tax (a 1031 exchange can defer both). Figures are a year-1 estimate at your 24.0% rate — not tax advice; consult a CPA.
Schools (NCES district)
- District
- Georgetown 01
- NCES district ID
- 4502280
- Math proficiency
- 26% ▼ -11.00%
- Reading proficiency
- 38% ▼ -5.00%
- Median HH income
- $43,045
- Composite
- 27.15/100
- National rank
- #7030
- State rank
- #51 of 80 in SC
Livability — Dunbar
No livability data for this city. (Only ~50 U.S. cities are tracked.)
Census & demographics
- Population (ZIP)
- 9,001
Population outlook (Georgetown County) Hauer SSP2
- Today (2025)
- 63,275 people
- By 2030
- 63,630 · +0.6%
- By 2040
- 63,130 · -0.2%
- By 2050
- 61,904 · -2.2%
- By 2075
- 59,305 · -6.3%
- By 2100
- 53,852 · -14.9%
Race, ethnicity, and origin ACS 2023
- Neighborhood character
- Majority Black (51%)
- Race & ethnicity
- Black 51% White 45% Hispanic / Latino 4%
- Common ancestry
- Serbian 2% Polish 1% Lithuanian 1%
- Foreign-born
- 4% · Canada
- Languages at home
- 96% English-only · Spanish 4%
Political lean MEDSL · Georgetown
- 2024 margin
- R (+19.5) · D 39.6% · R 59.1% · Other 1.2%
- 2008→2024 swing
- -14.2pp toward R · 2008: -5.2pp · 2024: -19.5pp
- All cycles
- 2024: R+19.5 2020: R+12.7 2016: R+13.0 2012: R+7.6 2008: R+5.2
Not yet ingested
- Civics
- —
Market trends
- HPI YoY
- ▲ 7.75%
- Current HPI
- 167.07
- Rent YoY
- —
- Metro
- —
- State GDP YoY
- ▲ 4.51%
- F500 in state
- 2
Industry mix (Fortune 500 HQ in SC)
| Industry | F500 HQs | Revenue |
|---|---|---|
| Packaging | 1 | $7B |
|
||
Price history
+122.5% since first listed4 events — show timeline
- 2026-02-14 Listed $89,000 CCAR
- 2026-02-10 Listing Removed — CCAR
- 2026-02-07 Listed $89,000 CCAR
- 2000-06-01 Sold (Public Records) $40,000 Public Records
Property tax history
+16.0%/yrLatest (2025): $271 · +21.4% YoY. Source: county tax records.
Cash-flow waterfall
monthlySold comps — $/sqft
last 12 mo · ≤1 miLoading sold comps…