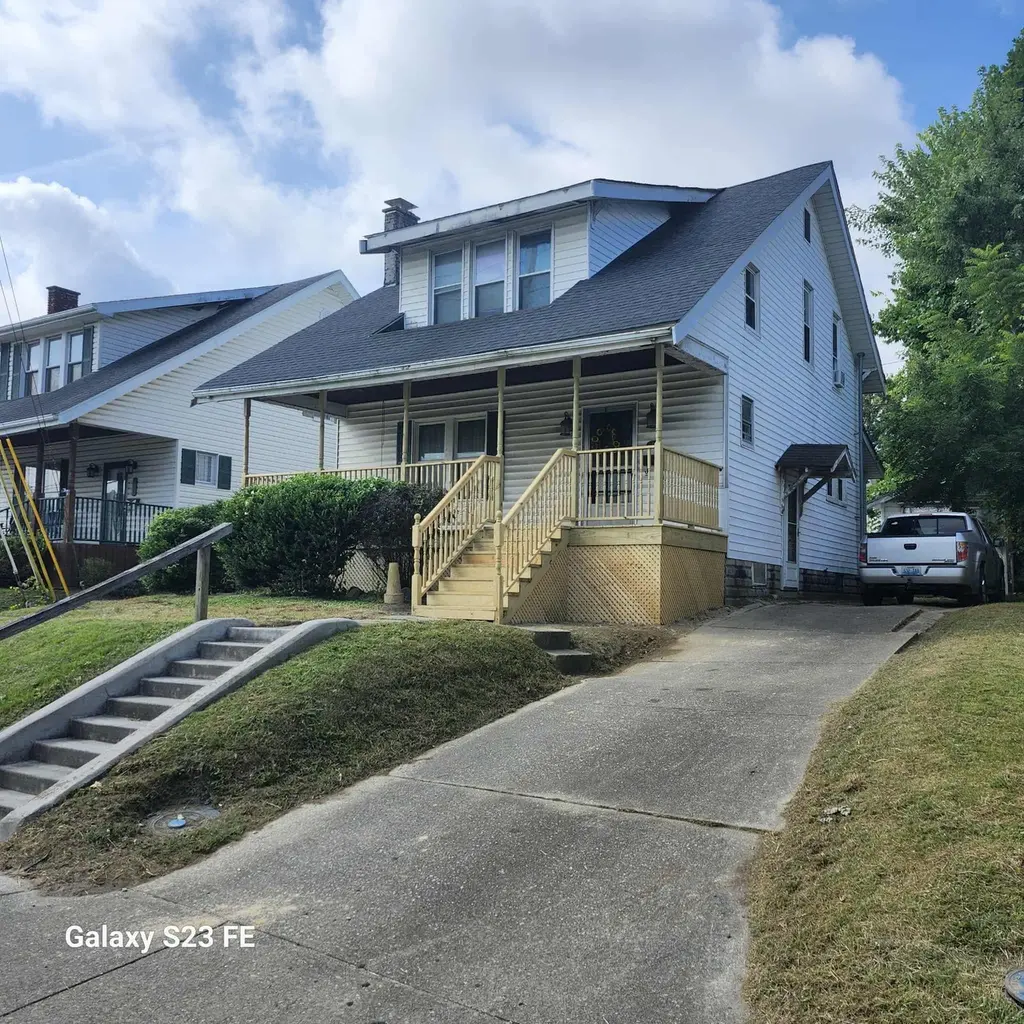
3232 Blackburn Ave · Ashland, KY
Flood risk 1/10 · Minimal
- FEMA flood zone
- X (unshaded)
- Chance of flooding over 30 yrs
- 0.0%
- Est. flood insurance / yr
- $473 – $860
Fire risk 3/10 · Minor
- Est. fire insurance / yr
- $839 – $1,559
Heat risk 5/10 · Moderate
- Hot days now (above 102°F)
- 7 days/yr
- Hot days in 30 yrs
- 20 days/yr
Wind risk 2/10 · Minimal
- Chance of severe wind over 30 yrs
- 1.0%
Air-quality risk 2/10 · Minimal
- Unhealthy air days now
- 0 days/yr
- Unhealthy air days in 30 yrs
- 1 days/yr
Risk factors via First Street. Map © Google.
Why this score? — see what drove the B- grade
The composite is a weighted blend of 9 inputs, each scored 0–100. Each bar is that input's sub-score; the figure is the points it added to the 100-point composite (weight × sub-score).
- Cash flow +26.6/30.0
- ARV discount +15.0/15.0
- DSCR +9.1/10.0
- 1% rule +5.9/10.0
- Schools +3.2/10.0
- Livability +3.2/5.0
- Rent growth +2.5/5.0
- Condition / age +2.5/5.0
- Appreciation +0.0/10.0
$104,900
🖨 Deal sheet 📄 Offer letter ✓ Due diligence
Listing remarks MLS
Spacious starter home in the heart of South Ashland. Watch the kids walk to school from your brand new front porch!!! Tall ceilings, beautiful woodwork and French doors. Full basement with additional storage throughout. Recently replaced roof, vinyl windows and water heater. A full bath has been added to the main level, along with a laundry area. Sliding glass door leads out to a great seating area with composite decking. There is alley access in the rear for additional parking and you will still have enough space for the pups to romp around. This is a true two bedroom with an option form a third. Put this one on your list and give your agent a call. Because this home needs a porch swing!!!!!
Key facts
- Alley access
- Laundry area
- Front porch
Tags
Neighborhood map
What this means for you Summary
Snapshot
- This is a 3-bed/1.0-bath single-family listed at $105k.
Deal economics
- At list price, monthly cash flow is $279 ($3k/yr) — positive.
- The deal already cash-flows at list — no discount required.
- Meets the 1% rule at list price ($1k rent vs $105k).
- Recommended offer: $95k (9.0% below list) — sets the bar for market timing.
- Cap rate 9.5% vs local median 5.4% in Ashland — top-decile yield for the area; either an underpriced asset or a hidden risk that comps aren't pricing in. Stress-test before assuming the spread holds.
Location & tenants
- Location reads 64/100 on livability (#304 in KY) — a middle-class / working-renter tenant base. Strengths: cost of living A+, housing A+; Watch: schools C-, amenities F, commute F.
- Ashland Independent (urban): math 32% / reading 44% proficiency, ranked #49 of 165 in KY (top 30%) — families likely to look elsewhere, expect single-tenant / working-renter base with shorter leases.
- Market conditions: 100 active listings in the ZIP; 2 units permitted in Boyd County in 2024 (0 in 5+ unit buildings).
Forward outlook
- Local home prices are declining (-3.0%/yr); year-one equity from $725 of loan paydown is wiped out by about $3k of value loss. Plan a longer hold.
- Boyd County population projected at -17% by 2050 — secular population decline; favor cash flow + early exit over multi-decade hold.
- At projected returns (-3.0% appreciation + 3.0% rent growth), your $29k cash investment doubles in ~10 years — after that, you're playing with house money.
Negotiation context
- It's been on market 92 days — a 9% lower offer ($95k) is reasonable based on typical stale-listing flexibility.
- 3 sale attempts with the ask held roughly flat each time — persistent listings suggest the price (not the market) is what's stuck; bring a comps-based counter.
- Current owner paid $40k; list at $105k implies a 162% gain — meaningful room to come down on a strong offer.
Risks & watch-outs
- Watch-outs: built in 1925 — expect roof / HVAC / electrical / plumbing capex.
- Climate carrying-cost: extreme-heat days projected 7→20/yr by 2055 (HVAC capex compounding) — expect insurance premiums to compound above CPI over the hold.
Questions for the listing agent
- It's been on market 92 days. Have you received any prior offers? Is the seller open to a 9% concession, seller financing, or rate buy-down credit?
- Built in 1925 — when were the roof, HVAC, electrical panel, plumbing, and water heater last replaced?
- Why hasn't it sold? Are there any deal-killer items the seller is aware of (foundation, flood, title, zoning, code violations)?
- Is there a deadline driving the sale (1031 exchange, divorce, estate, relocation)? That informs how much negotiation room exists.
- What's the average days-on-market for RENTAL listings here right now (not sales)? A rising rental-DOM trend means longer vacancies and softer asking-rent achievability than the comps imply.
- What's the recent tenant-quality profile in this submarket — average credit score on applications, eviction rate, late-payment / NSF rate, and stable-employment percentage? A property-management company in the area should have these aggregated.
- How much new for-sale + rental construction is in the pipeline within 1–3 miles? Heavy new supply typically softens prices + rents 12–24 months out; constrained supply supports both.
Investment metrics
- 1% rule
- 1.09% ✓
- Cap rate
- 9.49%
- Cash-on-cash
- 11.40%
- DSCR
- 1.51
- GRM
- 7.7
CMA / ARV
- ARV (median comp)
- $156,007
- List price
- $104,900
- Delta
- -32.76%
- Verdict
- UNDERPRICED
- Comps
- 20 within 1.0 mi
Show comp detail 12 sales within ~0.75 mi
| Address | Dist | Beds/Ba | Sqft | Sold | Price | $/sf | Match |
|---|---|---|---|---|---|---|---|
| 3213 Crest Street St | 0.15mi | 2/2.0 (-1) | 1,247 (+3%) | 2mo | $132,500 | $106 | 78 |
| 2200 Crest St | 0.19mi | 2/1.0 (-1) | 1,167 (-4%) | 3mo | $30,501 | $26 | 77 |
| 2616 Monroe St | 0.26mi | 2/2.0 (-1) | 1,200 (-1%) | 5mo | $81,500 | $68 | 73 |
| 3836 Logan St | 0.43mi | 3/1.0 | 1,150 (-5%) | 3mo | $68,500 | $60 | 69 |
| 2204 Broad St | 0.61mi | 3/1.0 | 1,226 (+1%) | 2mo | $78,144 | $64 | 69 |
| 2704 Greenway Road Rd | 0.27mi | 3/1.0 | 1,360 (+12%) | 6mo | $158,500 | $117 | 63 |
| 2309 Sellars St | 0.54mi | 3/2.0 | 1,273 (+5%) | 5mo | $168,000 | $132 | 59 |
| 3842 Cactus Street St | 0.44mi | 3/2.0 | 1,342 (+10%) | 2mo | $217,000 | $162 | 56 |
| 2805 Hampton St | 0.62mi | 3/1.0 | 1,344 (+11%) | 4mo | $116,000 | $86 | 50 |
| 1620 Spring Park | 0.61mi | 3/2.0 | 1,344 (+11%) | 1mo | $219,000 | $163 | 49 |
| 2410 Cleveland St | 0.57mi | 2/1.0 (-1) | 1,093 (-10%) | 6mo | $40,000 | $37 | 46 |
| 2929 Newman St | 0.62mi | 2/2.0 (-1) | 1,372 (+13%) | 6mo | $184,000 | $134 | 35 |
Match score weights: distance 35% · size 25% · config 20% · recency 20%. Top-matched comps best support the ARV.
Projected returns pro-forma
-3.0% appreciation · 3.0% rent growth · sell at horizon
- IRR
- 0.7%
- Equity multiple
- 1.02×
- Total profit
- $731
- Equity at exit
- $15,641
- IRR
- 10.3%
- Equity multiple
- 1.79×
- Total profit
- $23,338
- Equity at exit
- $9,070
Cash invested: $29,372 (down + closing). Projections, not guarantees.
Landlord ↔ Tenant lean methodology
- Overall (STATE)
- 83 Strongly Landlord-Friendly
- State Kentucky
- 83 Strongly Landlord-Friendly · R+16
- County
- — inherits STATE
- City
- — inherits STATE
ZIP-level market 41101
- Active inventory
- 100
- Price-to-rent
- 7.7×
Monthly cashflow live
- Estimated rent
- $1,140 medium interval (Pro) →
- Mortgage (P&I)
- −$550
- Tax from tax record
- −$28 /mo · $337/yr
- Insurance
- −$44
- HOA
- −$0
- Vacancy / Maint / Mgmt
- −$240
- Net cashflow
- $279
Break-even live
UW: 25.0% down · 7.5% · 30yr · 1.5% tax · 5.0% vac · 8.0% maint · 8.0% mgmt
Financing live
Cash to close
- Down payment
- $26,225
- Closing costs
- $3,147
- Reserves months
- —
- Total cash needed
- —
Loan-product check · same deal, 3 products live
Conventional
25% down · 7.5% · 30yr
- Down + closing
- —
- Monthly P&I
- —
- Monthly cashflow
- —
- DSCR
- —
- Eligible?
- —
Personal DTI + credit; lowest rate.
DSCR
20% down · 8.5% · 30yr
- Down + closing
- —
- Monthly P&I
- —
- Monthly cashflow
- —
- DSCR
- —
- Eligible?
- —
No personal income docs; deal must DSCR.
Hard money
10% down · 12.0% · 12mo
- Down + closing
- —
- Monthly P&I
- —
- Monthly cashflow
- —
- DSCR
- —
- Eligible?
- —
Short-term bridge; refi at stabilization.
Listing history 37 events
-
2026-06-18days on market $104,900 Active 92 DOM
-
2026-06-17days on market $104,900 Active 91 DOM
-
2026-06-16days on market $104,900 Active 90 DOM
-
2026-06-15days on market $104,900 Active 89 DOM
-
2026-06-13days on market $104,900 Active 87 DOM
-
2026-06-12days on market $104,900 Active 86 DOM
-
2026-06-09days on market $104,900 Active 83 DOM
-
2026-06-09price $104,900 Active 82 DOM
-
2026-06-08days on market $109,000 Active 82 DOM
-
2026-06-07days on market $109,000 Active 81 DOM
-
2026-06-07days on market $109,000 Active 80 DOM
-
2026-06-04days on market $109,000 Active 77 DOM
-
2026-06-02days on market $109,000 Active 76 DOM
-
2026-06-01days on market $109,000 Active 75 DOM
-
2026-05-31days on market $109,000 Active 74 DOM
-
2026-05-31days on market $109,000 Active 73 DOM
-
2026-03-18$109,000 Active 701-char remark
Show marketing remark (701 chars)
Spacious starter home in the heart of South Ashland. Watch the kids walk to school from your brand new front porch!!! Tall ceilings, beautiful woodwork and French doors. Full basement with additional storage throughout. Recently replaced roof, vinyl windows and water heater. A full bath has been added to the main level, along with a laundry area. Sliding glass door leads out to a great seating area with composite decking. There is alley access in the rear for additional parking and you will still have enough space for the pups to romp around. This is a true two bedroom with an option form a third. Put this one on your list and give your agent a call. Because this home needs a porch swing!!!!!
-
2025-12-09status Active
-
2025-10-30historical Active Under Contract
-
2025-10-27price $109,900
-
2025-10-24price $121,400
-
2025-10-20price $121,700
-
2025-10-15price $122,000
-
2025-10-14price $122,200
-
2025-10-13price $122,300
-
2025-10-08price $122,700
-
2025-09-28price $123,200
-
2025-09-27price $123,300
-
2025-09-24price $123,500
-
2025-09-22price $123,700
-
2025-09-20price $123,900
-
2025-09-18price $124,000
-
2025-09-04price $124,500
-
2025-08-25price $129,000
-
2025-08-21$129,900 Active
-
2008-04-24soldstatus $40,000
-
2004-05-25soldstatus $51,000
ⓘ Source: listings_history table (triggers on properties + properties_extension) + one-shot
backfill from property_details.listing_events for pre-trigger history.
Tax reassessment forecast KY · Resets to sale price
- Current annual tax
- $337 · $28/mo
- Projected year-2 tax
- $902 · $75/mo
- Expected delta
- +$565/yr (+$47/mo · 167.8%)
ⓘ Screening estimate from a state-policy table — verify with the county assessor before closing.
Climate risk First Street
- Flood 1/10 Low FEMA zone X (unshaded) · 0% chance over 30 yrs
- Wildfire 3/10 Moderate
- Heat 5/10 Major 7 d/yr ≥102°F today · 20 d/yr by 30 yrs out
- Wind 2/10 Low 100% chance of damaging wind over 30 yrs
- Air quality 2/10 Low 0 unhealthy d/yr today · 1 by 30 yrs out
Nearby sold comps map
Loading sold comps map…
Walkable amenities ~0.75 mi
Loading nearby amenities…
Taxation est. · year 1
- Rental income
- $13,686
- − Mortgage interest
- −$5,876
- − Property taxes
- −$337
- − Insurance
- −$524
- − Repairs & maintenance
- −$1,095
- − Management
- −$1,095
- − Depreciation
- −$3,052
- Taxable income
- $1,707
- Est. tax owed @ 24.0%
- −$410
- After-tax cash flow
- $2,939/yr
For passive investors: Depreciation is non-cash, so a rental often shows a tax loss while cash-flowing — sheltering income. Rental losses are passive: they offset passive income freely, and up to $25,000/yr can offset ordinary (W-2) income if you actively participate and your MAGI is under $100k (phasing out to $0 by $150k); unused losses carry forward. On sale, claimed depreciation is recaptured at up to 25%, and gains may owe capital-gains tax (a 1031 exchange can defer both). Figures are a year-1 estimate at your 24.0% rate — not tax advice; consult a CPA.
Schools (NCES district)
- District
- Ashland Independent
- NCES district ID
- 2100150
- Math proficiency
- 32% ▼ -16.00%
- Reading proficiency
- 44% ▼ -15.00%
- Median HH income
- $36,579
- Composite
- 31.51/100
- National rank
- #5971
- State rank
- #49 of 165 in KY
Livability — Ashland
- Score
- 64/100
- State rank
- #304
- US rank
- #14462
Category grades
Schools grade is shown separately in the Schools card above.
Census & demographics
- Census place
- Ashland, KY
- City population
- 19,331
- Population (ZIP)
- 19,331
Population outlook (Boyd County) Hauer SSP2
- Today (2025)
- 46,137 people
- By 2030
- 44,585 · -3.4%
- By 2040
- 41,442 · -10.2%
- By 2050
- 38,313 · -17.0%
- By 2075
- 31,077 · -32.6%
- By 2100
- 23,432 · -49.2%
Race, ethnicity, and origin ACS 2023
- Neighborhood character
- Predominantly White (89%)
- Race & ethnicity
- White 89% Two or more races 5% Hispanic / Latino 3% Black 2% Asian 1%
- Common ancestry
- Serbian 3% Slovak 2% Italian 2%
- Foreign-born
- 2% · Canada
- Languages at home
- 96% English-only · Spanish 2%
Political lean MEDSL · Boyd
- 2024 margin
- Solid R (+38.5) · D 30.0% · R 68.6% · Other 1.4%
- 2008→2024 swing
- -26.2pp toward R · 2008: -12.3pp · 2024: -38.5pp
- All cycles
- 2024: R+38.5 2020: R+33.2 2016: R+37.0 2012: R+16.3 2008: R+12.3
Not yet ingested
- Civics
- —
Market trends
- HPI YoY
- ▼ -81.83%
- Current HPI
- 148.0076
- Rent YoY
- —
- Metro
- —
- State GDP YoY
- ▲ 1.81%
- F500 in state
- 4
Industry mix (Fortune 500 HQ in KY)
| Industry | F500 HQs | Revenue |
|---|---|---|
| Healthcare | 1 | $118B |
|
||
| Food / Beverage | 1 | $7B |
|
||
Price history
+113.7% since first listed21 events — show timeline
- 2026-03-18 Listed $109,000 AABOR
- 2025-12-09 Relisted — AABOR
- 2025-10-30 Contingent — AABOR
- 2025-10-27 Price Changed $109,900 AABOR
- 2025-10-24 Price Changed $121,400 AABOR
- 2025-10-20 Price Changed $121,700 AABOR
- 2025-10-15 Price Changed $122,000 AABOR
- 2025-10-14 Price Changed $122,200 AABOR
- 2025-10-13 Price Changed $122,300 AABOR
- 2025-10-08 Price Changed $122,700 AABOR
- 2025-09-28 Price Changed $123,200 AABOR
- 2025-09-27 Price Changed $123,300 AABOR
- 2025-09-24 Price Changed $123,500 AABOR
- 2025-09-22 Price Changed $123,700 AABOR
- 2025-09-20 Price Changed $123,900 AABOR
- 2025-09-18 Price Changed $124,000 AABOR
- 2025-09-04 Price Changed $124,500 AABOR
- 2025-08-25 Price Changed $129,000 AABOR
- 2025-08-21 Listed $129,900 AABOR
- 2008-04-24 Sold (Public Records) $40,000 Public Records
- 2004-05-25 Sold (Public Records) $51,000 Public Records
Property tax history
+2.5%/yrLatest (2025): $337 · -1.1% YoY. Source: county tax records.
Cash-flow waterfall
monthlySold comps — $/sqft
last 12 mo · ≤1 miLoading sold comps…