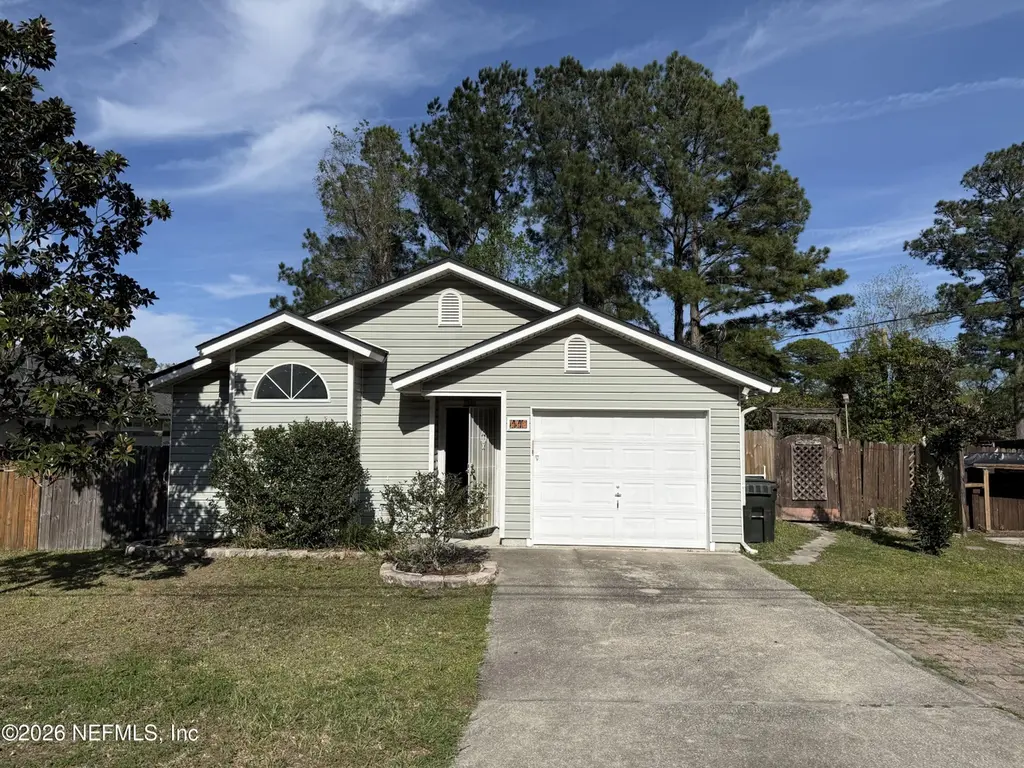
446 Vermont Ave · Green Cove Springs, FL
Flood risk 1/10 · Minimal
- FEMA flood zone
- A
- Chance of flooding over 30 yrs
- 0.0%
- Est. flood insurance / yr
- $1,009 – $1,996
Fire risk 6/10 · Moderate
- Est. fire insurance / yr
- $947 – $1,759
Heat risk 9/10 · Severe
- Hot days now (above 108°F)
- 7 days/yr
- Hot days in 30 yrs
- 20 days/yr
Wind risk 10/10 · Severe
- Chance of severe wind over 30 yrs
- 99.0%
Air-quality risk 3/10 · Minor
- Unhealthy air days now
- 3 days/yr
- Unhealthy air days in 30 yrs
- 3 days/yr
Risk factors via First Street. Map © Google.
Why this score? — see what drove the C grade
The composite is a weighted blend of 9 inputs, each scored 0–100. Each bar is that input's sub-score; the figure is the points it added to the 100-point composite (weight × sub-score).
- Cash flow +19.3/30.0
- ARV discount +15.0/15.0
- DSCR +6.1/10.0
- Schools +5.1/10.0
- 1% rule +4.2/10.0
- Livability +3.8/5.0
- Rent growth +2.6/5.0
- Condition / age +2.5/5.0
- Appreciation +0.0/10.0
$214,900
🖨 Deal sheet 📄 Offer letter ✓ Due diligence
Listing remarks
Big price improvement and priced to sell. This one owner home has a lot to offer at a great price. The 3 bed 2 bath home also has an enclosed addition with heat and air and a permitted workshop with electric, great for a craftsman or hobbyist. Right off the kitchen is an outdoor patio with a pergola with grape vines. You also have a deck right out the room addition. Many possibilities to make it your own spaces. Recently upgraded bathroom shower spaces. Low maintenance floors in most every room. Even has a murphy bed in the 2nd bedroom. Come see if you can make it yours.
Key facts
- Permitted workshop
- Deck
- Enclosed addition
Tags
Property features AI
Finance
- HOA & community: Not a designated senior community
Exterior
- Parking: Attached garage (1 car)
- Utilities: Public sewer; Cable connected
- Home design: Single family residence; Faces west
- Construction: Fiber cement and vinyl siding exterior; Shingle roof
- Exterior features: Deck; Patio; Fenced yard; Workshop (outbuilding)
Interior
- Kitchen: Dishwasher; Microwave
- Bedrooms: 3 bedrooms
- Bathrooms: 2 full bathrooms
- Heating & cooling: Central heating; Central air conditioning
- Interior features: Ceiling fan(s); Primary bathroom with shower (no tub); Gas fireplace (1)
- Laundry & utility: Laundry in garage
Neighborhood map
What this means for you Summary
Snapshot
- This is a 3-bed/2.0-bath single-family listed at $215k.
Deal economics
- At list price, monthly cash flow is $109 ($1k/yr) — positive.
- The deal already cash-flows at list — no discount required.
- To meet the 1% rule (rent ≥ 1% of price), the offer needs to be $197k (8.2% below list).
- Recommended offer: $197k (8.2% below list) — sets the bar for 1% rule.
- Cap rate 7.6% vs local median 4.2% in Green Cove Springs — top-decile yield for the area; either an underpriced asset or a hidden risk that comps aren't pricing in. Stress-test before assuming the spread holds.
Location & tenants
- Location reads 75/100 on livability (#245 in FL, #3,868 nationally) — a middle-class / working-renter tenant base. Strengths: cost of living A+, housing A+, health & safety A+; Watch: amenities F, commute F.
- Clay (suburban): math 58% / reading 59% proficiency, ranked #14 of 73 in FL (top 19%) — acceptable for families but not a draw, mixed tenant base, ~2y average lease.
- Zoned schools: Charles E. Bennett Elementary School (math 41% / reading 39%, grade F, #1,491 of 2,144 statewide, top 70%, 624 students, 100% FRL); Green Cove Springs Junior High School (math 63% / reading 60%, grade B+, #124 of 571 statewide, top 22%, 799 students, 38% FRL); Clay High School (math 37% / reading 53%, grade D-, #228 of 667 statewide, top 35%, 1,666 students, 43% FRL) — zoned schools average 60% FRL vs 35% district-wide (25 pts higher); higher-poverty schools than district average — tighter screening recommended.
- Market conditions: Rents flat; 885 active listings in the ZIP; 13 comparable units currently listed for rent nearby; rentals leasing fast (median 4d on market — plan ~1-2 weeks tenant-placement turnaround); solid renter incomes; 1,876 units permitted in Clay County in 2024 (14 in 5+ unit buildings).
Forward outlook
- Local home prices are declining (-3.0%/yr); year-one equity from $1k of loan paydown is wiped out by about $6k of value loss. Plan a longer hold.
- Clay County population projected at +19% by 2050 — long-run rental-demand tailwind backs the buy-and-hold thesis.
Negotiation context
- It's been on market 80 days — a 6% lower offer ($202k) is reasonable based on typical stale-listing flexibility.
Risks & watch-outs
- Watch-outs: flood insurance adds $125/mo.
- Climate carrying-cost: in FEMA flood zone A (mandatory federal flood insurance); severe wind risk, 99% chance of damaging wind over 30y; major wildfire risk; extreme-heat days projected 7→20/yr by 2055 (HVAC capex compounding) — expect insurance premiums to compound above CPI over the hold.
Questions for the listing agent
- It's been on market 80 days. Have you received any prior offers? Is the seller open to a 8% concession, seller financing, or rate buy-down credit?
- What's the actual annual flood-insurance premium (NFIP or private), and is the property in a SFHA with mandatory coverage?
- Why hasn't it sold? Are there any deal-killer items the seller is aware of (foundation, flood, title, zoning, code violations)?
- Is there a deadline driving the sale (1031 exchange, divorce, estate, relocation)? That informs how much negotiation room exists.
- What's the average days-on-market for RENTAL listings here right now (not sales)? A rising rental-DOM trend means longer vacancies and softer asking-rent achievability than the comps imply.
- What's the recent tenant-quality profile in this submarket — average credit score on applications, eviction rate, late-payment / NSF rate, and stable-employment percentage? A property-management company in the area should have these aggregated.
- How much new for-sale + rental construction is in the pipeline within 1–3 miles? Heavy new supply typically softens prices + rents 12–24 months out; constrained supply supports both.
Investment metrics
- 1% rule
- 0.92% ✗
- Cap rate
- 7.60%
- Cash-on-cash
- 4.67%
- DSCR
- 1.21
- GRM
- 9.1
CMA / ARV
- ARV (on-the-fly)
- $300,966
- Comps found
- 12
Show comp detail 12 sales within ~0.75 mi
| Address | Dist | Beds/Ba | Sqft | Sold | Price | $/sf | Match |
|---|---|---|---|---|---|---|---|
| 1116 Bonaventure Ave | 0.48mi | 3/2.0 | 1,433 (-2%) | 6mo | $295,000 | $206 | 70 |
| 4132 Audubon Ave | 0.67mi | 3/2.0 | 1,459 (-0%) | 0mo | $312,350 | $214 | 68 |
| 101 S Oakridge Ave | 0.51mi | 4/2.5 (+1) | 1,468 (+0%) | 0mo | $200,000 | $136 | 68 |
| 4140 Audubon Ave | 0.68mi | 3/2.0 | 1,459 (-0%) | 1mo | $309,880 | $212 | 67 |
| 219 N West St | 0.60mi | 4/1.5 (+1) | 1,456 (-0%) | 3mo | $250,000 | $172 | 62 |
| 4112 Audubon Ave | 0.64mi | 3/2.0 | 1,646 (+13%) | 1mo | $327,850 | $199 | 49 |
| 407 Green St S | 0.63mi | 3/2.0 | 1,288 (-12%) | 4mo | $270,000 | $210 | 48 |
| 4128 Audubon Ave | 0.66mi | 4/2.0 (+1) | 1,609 (+10%) | 0mo | $314,850 | $196 | 47 |
| 4148 Audubon Ave | 0.70mi | 3/2.0 | 1,646 (+13%) | 1mo | $321,850 | $196 | 45 |
| 4116 Audubon Ave | 0.64mi | 3/2.0 | 1,245 (-15%) | 1mo | $294,940 | $237 | 45 |
| 4144 Audubon Ave | 0.69mi | 3/2.0 | 1,245 (-15%) | 2mo | $294,440 | $236 | 42 |
| 1110 North St | 0.71mi | 4/2.0 (+1) | 1,680 (+15%) | 3mo | $312,500 | $186 | 34 |
Match score weights: distance 35% · size 25% · config 20% · recency 20%. Top-matched comps best support the ARV.
Projected returns pro-forma
-3.0% appreciation · 0.46% rent growth · sell at horizon
- IRR
- -15.7%
- Equity multiple
- 0.45×
- Total profit
- $-32,797
- Equity at exit
- $32,042
- IRR
- -12.2%
- Equity multiple
- 0.36×
- Total profit
- $-38,769
- Equity at exit
- $18,581
Cash invested: $60,172 (down + closing). Projections, not guarantees.
Landlord ↔ Tenant lean methodology
- Overall (STATE)
- 87 Strongly Landlord-Friendly
- State Florida
- 87 Strongly Landlord-Friendly · R+3
- County
- — inherits STATE
- City
- — inherits STATE
ZIP-level market 32043
- Home prices YoY
- -26.3%
- Rents YoY
- 0.5%
- Active inventory
- 885
- Price-to-rent
- 9.1×
Monthly cashflow live
- Estimated rent
- $1,972 high interval (Pro) →
- Mortgage (P&I)
- −$1,127
- Tax from tax record
- −$107 /mo · $1,287/yr
- Insurance
- −$90
- Flood insurance flood zone
- −$125 /mo · $1,502/yr
- HOA
- −$0
- Vacancy / Maint / Mgmt
- −$414
- Net cashflow
- $109
Break-even live
UW: 25.0% down · 7.5% · 30yr · 1.5% tax · 5.0% vac · 8.0% maint · 8.0% mgmt
Financing live
Cash to close
- Down payment
- $53,725
- Closing costs
- $6,447
- Reserves months
- —
- Total cash needed
- —
Loan-product check · same deal, 3 products live
Conventional
25% down · 7.5% · 30yr
- Down + closing
- —
- Monthly P&I
- —
- Monthly cashflow
- —
- DSCR
- —
- Eligible?
- —
Personal DTI + credit; lowest rate.
DSCR
20% down · 8.5% · 30yr
- Down + closing
- —
- Monthly P&I
- —
- Monthly cashflow
- —
- DSCR
- —
- Eligible?
- —
No personal income docs; deal must DSCR.
Hard money
10% down · 12.0% · 12mo
- Down + closing
- —
- Monthly P&I
- —
- Monthly cashflow
- —
- DSCR
- —
- Eligible?
- —
Short-term bridge; refi at stabilization.
Rent comps 13 comps
| Address | Beds | Baths | Sqft | Rent | $/sqft | DOM | Units | Dist |
|---|---|---|---|---|---|---|---|---|
| 1507 Julia St Green Cove Springs, FL | 3.0 | 2.0 | 1621 | $2,020 | $1.25 | 2d | 1 | 0.23mi |
| 4019 Pine Hill Pt Unit 4019 Green Cove Springs, FL | 3.0 | 2.5 | 1306 | $1,850 | $1.42 | 23d | 1 | 0.35mi |
| 4016 Pine Hill Pt Unit 4016 Green Cove Springs, FL | 3.0 | 2.5 | 1306 | $1,850 | $1.42 | 23d | 1 | 0.36mi |
| 4028 Pine Hill Pt Unit 4028 Green Cove Springs, FL | 3.0 | 2.5 | 1306 | $1,850 | $1.42 | 23d | 1 | 0.36mi |
| 806 Oak St Unit 14 Green Cove Springs, FL | 2.0 | 2.0 | 1200 | $1,600 | $1.33 | 4d | 1 | 0.54mi |
| 806 Oak St Unit 14 Green Cove Springs, FL | 2.0 | 2.0 | 1200 | $1,600 | $1.33 | 3d | 1 | 0.54mi |
| 806 Oak St Unit 10 Green Cove Springs, FL | 2.0 | 1.0 | 1000 | $1,400 | $1.40 | 4d | 1 | 0.54mi |
| 806 Oak St Unit 10 Green Cove Springs, FL | 2.0 | 1.0 | 1000 | $1,400 | $1.40 | 3d | 1 | 0.54mi |
| 410 Center St Green Cove Springs, FL | 3.0 | 1.0 | 1100 | $1,600 | $1.45 | 23d | 1 | 1.00mi |
| 4028 Pine Ave Unit 1 Green Cove Springs, FL | 3.0 | 2.5 | 1304 | $1,850 | $1.42 | 3d | 1 | 1.07mi |
| 4019 Pine Ave Unit 1 Green Cove Springs, FL | 3.0 | 2.5 | 1304 | $1,850 | $1.42 | 3d | 1 | 1.07mi |
| 212 Saint Johns Ave Unit 212 Green Cove Springs, FL | 3.0 | 2.0 | 1560 | $2,300 | $1.47 | 23d | 1 | 1.17mi |
| 104 Saint Elmo Rd Green Cove Springs, FL | 2.0 | 1.0 | 1120 | $1,850 | $1.65 | 23d | 1 | 1.20mi |
Listing history 11 events
-
2026-06-08statusdays on market $214,900 Pending 80 DOM
-
2026-06-07days on market $214,900 Active Under Contract 79 DOM
-
2026-06-03days on market $214,900 Active Under Contract 75 DOM
-
2026-06-02days on market $214,900 Active Under Contract 74 DOM
-
2026-06-01days on market $214,900 Active Under Contract 73 DOM
-
2026-05-31statusdays on market $214,900 Active Under Contract 72 DOM
-
2026-05-12price $219,000
-
2026-05-07price $229,000
-
2026-04-24price $239,000
-
2026-04-02price $249,000
-
2026-03-20$259,000 Active
ⓘ Source: listings_history table (triggers on properties + properties_extension) + one-shot
backfill from property_details.listing_events for pre-trigger history.
Tax reassessment forecast FL · Resets to sale price
- Current annual tax
- $1,287 · $107/mo
- Projected year-2 tax
- $1,784 · $149/mo
- Expected delta
- +$496/yr (+$41/mo · 38.5%)
ⓘ Screening estimate from a state-policy table — verify with the county assessor before closing.
Climate risk First Street
- Flood 1/10 Low FEMA zone A · 0% chance over 30 yrs
- Wildfire 6/10 Major
- Heat 9/10 Extreme 7 d/yr ≥108°F today · 20 d/yr by 30 yrs out
- Wind 10/10 Extreme 99% chance of damaging wind over 30 yrs
- Air quality 3/10 Moderate 3 unhealthy d/yr today · 3 by 30 yrs out
Nearby sold comps map
Loading sold comps map…
Walkable amenities ~0.75 mi
Loading nearby amenities…
Taxation est. · year 1
- Rental income
- $23,664
- − Mortgage interest
- −$12,038
- − Property taxes
- −$1,287
- − Insurance
- −$2,577
- − Repairs & maintenance
- −$1,893
- − Management
- −$1,893
- − Depreciation
- −$6,252
- Taxable loss
- −$2,276
- Est. tax savings @ 24.0%
- +$546
- After-tax cash flow
- $1,853/yr
For passive investors: Depreciation is non-cash, so a rental often shows a tax loss while cash-flowing — sheltering income. Rental losses are passive: they offset passive income freely, and up to $25,000/yr can offset ordinary (W-2) income if you actively participate and your MAGI is under $100k (phasing out to $0 by $150k); unused losses carry forward. On sale, claimed depreciation is recaptured at up to 25%, and gains may owe capital-gains tax (a 1031 exchange can defer both). Figures are a year-1 estimate at your 24.0% rate — not tax advice; consult a CPA.
Schools (NCES district)
- District
- Clay
- NCES district ID
- 1200300
- Math proficiency
- 58% ▼ -8.00%
- Reading proficiency
- 59% ▼ -3.00%
- Median HH income
- $59,379
- Composite
- 50.73/100
- National rank
- #1815
- State rank
- #14 of 73 in FL
Livability — Green Cove Springs
- Score
- 75/100
- State rank
- #245
- US rank
- #3868
Category grades
Schools grade is shown separately in the Schools card above.
Census & demographics
- Census place
- Green Cove Springs, FL
- County
- Clay County · 208,450 people
- City population
- 34,562
- Metro
- Jacksonville, FL
- Population (ZIP)
- 34,562
- Household income
- $84,145
- Rent vs Own
- Severe rent burden
- 449.0
Population outlook (Clay County) Hauer SSP2
- Today (2025)
- 230,495 people
- By 2030
- 242,427 · +5.2%
- By 2040
- 262,244 · +13.8%
- By 2050
- 275,148 · +19.4%
- By 2075
- 295,397 · +28.2%
- By 2100
- 287,592 · +24.8%
Race, ethnicity, and origin ACS 2023
- Neighborhood character
- Predominantly White (77%)
- Race & ethnicity
- White 77% Black 10% Two or more races 7% Hispanic / Latino 6% Asian 2%
- Hispanic origin (detail)
- Mexican 2% Puerto Rican 1%
- Common ancestry
- Slovak 3% Romanian 2% Lithuanian 2%
- Foreign-born
- 5% · Canada
- Languages at home
- 92% English-only · Spanish 5% French/Haitian/Cajun 1% Other Indo-European 1%
Political lean MEDSL · Clay
- 2024 margin
- Solid R (+39.3) · D 29.9% · R 69.2%
- 2008→2024 swing
- +3.6pp toward D · 2008: -42.8pp · 2024: -39.3pp
- All cycles
- 2024: R+39.3 2020: R+37.1 2016: R+44.3 2012: R+45.8 2008: R+42.8
Not yet ingested
- Civics
- —
Market trends
- HPI YoY
- ▼ -107.34%
- Current HPI
- 301.3212
- Rent YoY
- ▲ 0.46%
- Metro
- Jacksonville, FL
- State GDP YoY
- ▲ 3.28%
- F500 in state
- 36
Industry mix (Fortune 500 HQ in FL)
| Industry | F500 HQs | Revenue |
|---|---|---|
| Industrial Technology | 2 | $29B |
|
||
| Insurance | 2 | $17B |
|
||
| Retail | 1 | $60B |
|
||
| Technology Distribution | 1 | $58B |
|
||
| Homebuilding | 1 | $35B |
|
||
| Technology Manufacturing | 1 | $35B |
|
||
Price history
-15.4% since first listed5 events — show timeline
- 2026-05-12 Price Changed $219,000 realMLS
- 2026-05-07 Price Changed $229,000 realMLS
- 2026-04-24 Price Changed $239,000 realMLS
- 2026-04-02 Price Changed $249,000 realMLS
- 2026-03-20 Listed $259,000 realMLS
Property tax history
+4.4%/yrLatest (2025): $1,287 · +5.0% YoY. Source: county tax records.
Cash-flow waterfall
monthlySold comps — $/sqft
last 12 mo · ≤1 miLoading sold comps…