2736 Sfc 361 · Colt, AR
Flood risk 1/10 · Minimal
- FEMA flood zone
- —
- Chance of flooding over 30 yrs
- 0.0%
- Est. flood insurance / yr
- —
Fire risk 4/10 · Minor
- Est. fire insurance / yr
- $1,499 – $2,785
Heat risk 5/10 · Moderate
- Hot days now (above 109°F)
- 7 days/yr
- Hot days in 30 yrs
- 20 days/yr
Wind risk 4/10 · Minor
- Chance of severe wind over 30 yrs
- 13.0%
Air-quality risk 1/10 · Minimal
- Unhealthy air days now
- 0 days/yr
- Unhealthy air days in 30 yrs
- 0 days/yr
Risk factors via First Street. Map © Google.
Why this score? — see what drove the B grade
The composite is a weighted blend of 9 inputs, each scored 0–100. Each bar is that input's sub-score; the figure is the points it added to the 100-point composite (weight × sub-score).
- Cash flow +30.0/30.0
- 1% rule +10.0/10.0
- DSCR +10.0/10.0
- Appreciation +7.6/10.0
- ARV discount +7.5/15.0
- Livability +2.7/5.0
- Rent growth +2.5/5.0
- Condition / age +2.5/5.0
- Schools +0.9/10.0
$65,000
🖨 Deal sheet (PDF) 📄 Offer letter ✓ Due diligence
Listing remarks
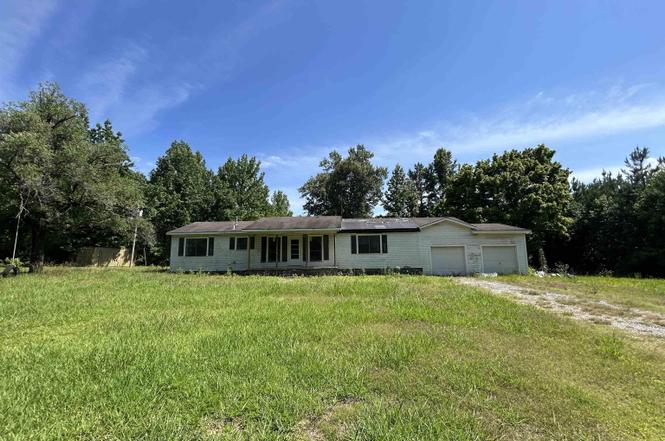
Opportunity awaits with this 3-bedroom, 2-bathroom home located in a rural area near Colt, Arkansas. Situated on a spacious lot, this property offers plenty of outdoor space along with the convenience of a 2-car garage. The home is in need of repairs and updates, making it an excellent opportunity for buyers looking to renovate and customize a property to their preferences. Whether you’re seeking an investment opportunity, a renovation project, or a property that may qualify for certain rehabilitation financing programs, this home offers potential and flexibility. Inside, you’ll find three bedrooms and two bathrooms with a layout ready for improvement and personal touches. Outsi
Key facts
- Generous yard
- Spacious lot
- Outdoor space
Tags
Property features AI
Exterior
- Parking: Garage
- Utilities: Septic system
- Home design: Single-family property; Approximately 1,440 living area; Approximately 1.0 acre lot
- Construction: Crawl space foundation; 3-tab shingle roof
- Exterior features: Metal/vinyl siding; Gravel road access; Sloped and level lot
Interior
- Kitchen: Free-standing stove
- Bedrooms: Den/Family Room
- Flooring: Vinyl
- Bathrooms: 2 full bathrooms
- Heating & cooling: Window air conditioning units
- Interior features: Vinyl floors; Wood-burning fireplace (site-built)
Neighborhood map
What this means for you Summary
Snapshot
- This is a 3-bed/1.5-bath single-family listed at $65k.
Deal economics
- At list price, monthly cash flow is $415 ($5k/yr) — positive.
- The deal already cash-flows at list — no discount required.
- Meets the 1% rule at list price ($1k rent vs $65k).
Location & tenants
- Location reads 53/100 on livability (#431 in AR) — a working-class tenant base; expect higher turnover. Strengths: cost of living A+, crime A, health & safety A; Watch: housing D+, schools F, amenities F.
- Forrest City School District (town): math 12% / reading 11% proficiency, ranked #230 of 238 in AR (top 97%) — low school quality limits family demand, transient renter base, plan for 1-2y turnover; 93% free/reduced lunch — lower-income household profile, screen leases tightly.
- Market conditions: 9 active listings in the ZIP; 3 units permitted in St. Francis County in 2024 (0 in 5+ unit buildings).
Forward outlook
- In year one you build about $4k of equity ($449 loan paydown + $3k appreciation (5.2% local appreciation)).
- St. Francis County population projected at -21% by 2050 — secular population decline; favor cash flow + early exit over multi-decade hold.
- At projected returns (5.2% appreciation + 3.0% rent growth), your $18k cash investment doubles in ~3 years — after that, you're playing with house money.
- By year 9, paydown + projected appreciation supports a ~$34k cash-out refi (75% LTV) — recoverable capital for the next deal without selling this one.
Negotiation context
- Only 7 days on market — expect competitive offers; lowballing is unlikely to land.
- Current owner paid $50k; 30% above their basis — modest negotiation headroom, anchor on the comps not their cost.
Risks & watch-outs
- Climate carrying-cost: extreme-heat days projected 7→20/yr by 2055 (HVAC capex compounding) — expect insurance premiums to compound above CPI over the hold.
Questions for the listing agent
- Is there a deadline driving the sale (1031 exchange, divorce, estate, relocation)? That informs how much negotiation room exists.
- Schools are F-rated, which usually means shorter tenancies and higher turnover. Who's the typical renter profile here, and what's been the actual vacancy rate?
- What's the average days-on-market for RENTAL listings here right now (not sales)? A rising rental-DOM trend means longer vacancies and softer asking-rent achievability than the comps imply.
- What's the recent tenant-quality profile in this submarket — average credit score on applications, eviction rate, late-payment / NSF rate, and stable-employment percentage? A property-management company in the area should have these aggregated.
- How much new for-sale + rental construction is in the pipeline within 1–3 miles? Heavy new supply typically softens prices + rents 12–24 months out; constrained supply supports both.
Investment metrics
- 1% rule
- 1.68% ✓
- Cap rate
- 13.95%
- Cash-on-cash
- 27.36%
- DSCR
- 2.22
- GRM
- 5.0
CMA / ARV
No comps found within radius.
Projected returns pro-forma
5.23% appreciation · 3.0% rent growth · sell at horizon
- IRR
- 37.2%
- Equity multiple
- 3.32×
- Total profit
- $42,276
- Equity at exit
- $37,739
- IRR
- 35.2%
- Equity multiple
- 6.75×
- Total profit
- $104,610
- Equity at exit
- $65,893
Cash invested: $18,200 (down + closing). Projections, not guarantees.
Landlord ↔ Tenant lean methodology
- Overall (STATE)
- 92 Strongly Landlord-Friendly
- State Arkansas
- 92 Strongly Landlord-Friendly · R+14
- County
- — inherits STATE
- City
- — inherits STATE
ZIP-level market 72326
- Home prices YoY
- 3.1%
- Active inventory
- 9
- Price-to-rent
- 5.0×
Monthly cashflow live
- Estimated rent
- $1,094 medium interval (Pro) →
- Mortgage (P&I)
- −$341
- Tax est. 1.5%
- −$81 /mo · $975/yr
- Insurance
- −$27
- HOA
- −$0
- Vacancy / Maint / Mgmt
- −$230
- Net cashflow
- $415
Break-even live
Sensitivity live
| Price | -10% $460 | -5% $437 | +0% $415 | +5% $392 | +10% $370 |
|---|---|---|---|---|---|
| Rent | -10% $329 | -5% $372 | +0% $415 | +5% $458 | +10% $501 |
| Rate | -1.0pp $448 | -0.5pp $431 | base $415 | +0.5pp $398 | +1.0pp $381 |
UW: 25.0% down · 7.5% · 30yr · 1.5% tax · 5.0% vac · 8.0% maint · 8.0% mgmt
Financing live
Cash to close
- Down payment
- $16,250
- Closing costs
- $1,950
- Reserves months
- —
- Total cash needed
- —
Loan-product check · same deal, 3 products live
Conventional
25% down · 7.5% · 30yr
- Down + closing
- —
- Monthly P&I
- —
- Monthly cashflow
- —
- DSCR
- —
- Eligible?
- —
Personal DTI + credit; lowest rate.
DSCR
20% down · 8.5% · 30yr
- Down + closing
- —
- Monthly P&I
- —
- Monthly cashflow
- —
- DSCR
- —
- Eligible?
- —
No personal income docs; deal must DSCR.
Hard money
10% down · 12.0% · 12mo
- Down + closing
- —
- Monthly P&I
- —
- Monthly cashflow
- —
- DSCR
- —
- Eligible?
- —
Short-term bridge; refi at stabilization.
Listing history 7 events
-
2026-06-19statusdays on market $65,000 Active 7 DOM
-
2026-06-18days on market $65,000 New Listing 6 DOM
-
2026-06-17days on market $65,000 New Listing 5 DOM
-
2026-06-16days on market $65,000 New Listing 4 DOM
-
2026-06-15days on market $65,000 New Listing 3 DOM
-
2026-06-13remarks 687-char remark
-
2026-06-13$65,000 New Listing 1 DOM
ⓘ Source: listings_history table (triggers on properties + properties_extension) + one-shot
backfill from property_details.listing_events for pre-trigger history.
Climate risk First Street
- Flood 1/10 Low 0% chance over 30 yrs
- Wildfire 4/10 Moderate
- Heat 5/10 Major 7 d/yr ≥109°F today · 20 d/yr by 30 yrs out
- Wind 4/10 Moderate 13% chance of damaging wind over 30 yrs
- Air quality 1/10 Low 0 unhealthy d/yr today · 0 by 30 yrs out
Nearby sold comps map
Loading sold comps map…
Walkable amenities ~0.75 mi
Loading nearby amenities…
Taxation est. · year 1
- Rental income
- $13,126
- − Mortgage interest
- −$3,641
- − Property taxes
- −$975
- − Insurance
- −$325
- − Repairs & maintenance
- −$1,050
- − Management
- −$1,050
- − Depreciation
- −$1,891
- Taxable income
- $4,194
- Est. tax owed @ 24.0%
- −$1,007
- After-tax cash flow
- $3,973/yr
For passive investors: Depreciation is non-cash, so a rental often shows a tax loss while cash-flowing — sheltering income. Rental losses are passive: they offset passive income freely, and up to $25,000/yr can offset ordinary (W-2) income if you actively participate and your MAGI is under $100k (phasing out to $0 by $150k); unused losses carry forward. On sale, claimed depreciation is recaptured at up to 25%, and gains may owe capital-gains tax (a 1031 exchange can defer both). Figures are a year-1 estimate at your 24.0% rate — not tax advice; consult a CPA.
Schools (NCES district)
- District
- Forrest City School District
- NCES district ID
- 0506270
- Math proficiency
- 12% ▼ -8.00%
- Reading proficiency
- 11% ▼ -7.00%
- Median HH income
- $31,153
- Composite
- 9.07/100
- National rank
- #9871
- State rank
- #230 of 238 in AR
Livability — Colt
- Score
- 53/100
- State rank
- #431
- US rank
- #24290
Category grades
Schools grade is shown separately in the Schools card above.
Census & demographics
- Population (ZIP)
- 2,030
Population outlook (St. Francis County) Hauer SSP2
- Today (2025)
- 24,387 people
- By 2030
- 23,269 · -4.6%
- By 2040
- 21,122 · -13.4%
- By 2050
- 19,281 · -20.9%
- By 2075
- 15,222 · -37.6%
- By 2100
- 11,449 · -53.1%
Race, ethnicity, and origin ACS 2023
- Neighborhood character
- Predominantly White (66%)
- Race & ethnicity
- White 66% Black 28% Two or more races 4% Hispanic / Latino 2%
- Common ancestry
- Slovak 2% Italian 1% Serbian 1%
- Foreign-born
- 1% · Canada, South Korea
- Languages at home
- 99% English-only · Spanish 1%
Political lean MEDSL · St. Francis
- 2024 margin
- Toss-up / Even · D 49.4% · R 48.6% · Other 2.0%
- 2008→2024 swing
- -15.8pp toward R · 2008: 16.5pp · 2024: 0.7pp
- All cycles
- 2024: D+0.7 2020: D+5.1 2016: D+11.3 2012: D+17.0 2008: D+16.5
Not yet ingested
- Civics
- —
Market trends
- HPI YoY
- ▲ 5.23%
- Current HPI
- 172.8048
- Rent YoY
- —
- Metro
- —
- State GDP YoY
- ▲ 3.80%
- F500 in state
- 10
Industry mix (Fortune 500 HQ in AR)
| Industry | F500 HQs | Revenue |
|---|---|---|
| Retail | 1 | $681B |
|
||
| Food / Agriculture | 1 | $53B |
|
||
| Retail / Energy | 1 | $22B |
|
||
| Transportation / Logistics | 1 | $12B |
|
||
| Energy | 1 | $4B |
|
||
Price history
+10.2% since first listed3 events — show timeline
- 2026-06-12 Listed $65,000 CARMLS
- 2020-03-05 Sold (Public Records) $50,000 Public Records
- 2005-11-23 Sold (Public Records) $59,000 Public Records
Property tax history
-9.1%/yrLatest (2025): $67 · -63.6% YoY. Source: county tax records.
Cash-flow waterfall
monthlySold comps — $/sqft
last 12 mo · ≤1 miLoading sold comps…