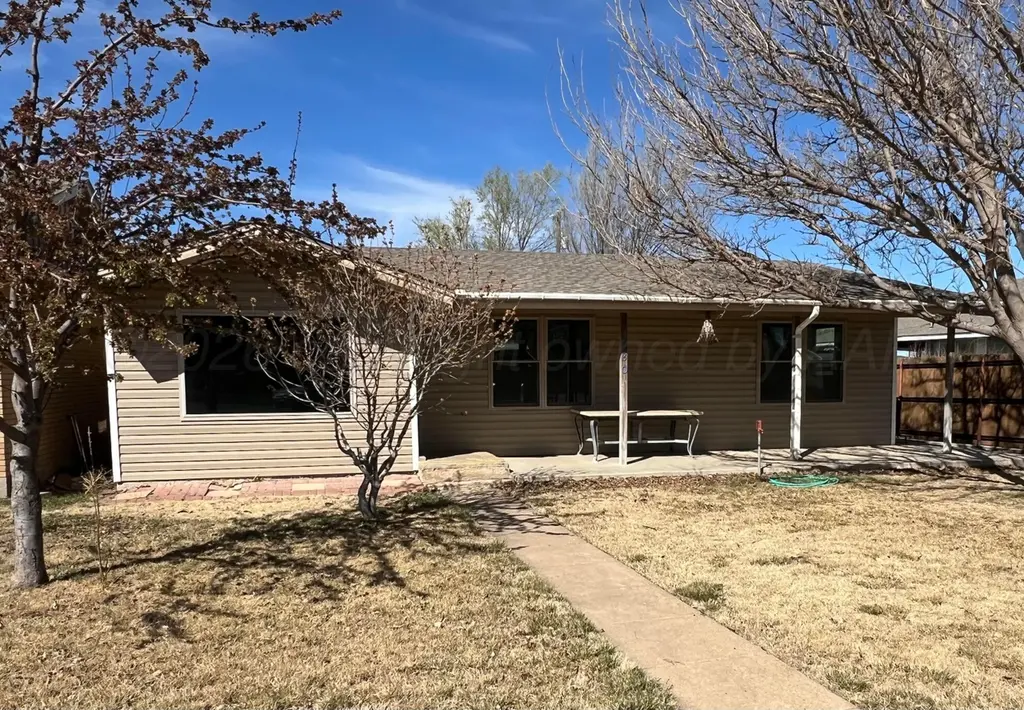
530 S Main St · Booker, TX
Flood risk 1/10 · Minimal
- FEMA flood zone
- —
- Chance of flooding over 30 yrs
- 0.0%
- Est. flood insurance / yr
- —
Fire risk 7/10 · Major
- Est. fire insurance / yr
- $1,222 – $2,270
Heat risk 5/10 · Moderate
- Hot days now (above 101°F)
- 6 days/yr
- Hot days in 30 yrs
- 15 days/yr
Wind risk 2/10 · Minimal
- Chance of severe wind over 30 yrs
- —
Air-quality risk 1/10 · Minimal
- Unhealthy air days now
- 0 days/yr
- Unhealthy air days in 30 yrs
- 0 days/yr
Risk factors via First Street. Map © Google.
Why this score? — see what drove the B- grade
The composite is a weighted blend of 9 inputs, each scored 0–100. Each bar is that input's sub-score; the figure is the points it added to the 100-point composite (weight × sub-score).
- Cash flow +25.4/30.0
- DSCR +8.4/10.0
- ARV discount +7.5/15.0
- 1% rule +6.7/10.0
- Appreciation +6.6/10.0
- Schools +5.2/10.0
- Condition / age +3.8/5.0
- Livability +3.5/5.0
- Rent growth +2.5/5.0
$89,900
🖨 Deal sheet (PDF) 📄 Offer letter ✓ Due diligence
Listing remarks MLS
Home that was nicely updated within the last 2 years with wide open living spaces. Replaced flooring, texture, paint. Central heat/air. Near school.
Key facts
- Near school
- Updated home
- Central heat air
Tags
Neighborhood map
What this means for you Summary
Snapshot
- This is a 3-bed/1.0-bath single-family listed at $90k. Condition is rated good.
Deal economics
- At list price, monthly cash flow is $208 ($2k/yr) — positive.
- The deal already cash-flows at list — no discount required.
- Meets the 1% rule at list price ($1k rent vs $90k).
- Recommended offer: $79k (12.0% below list) — sets the bar for market timing.
Location & tenants
- Location reads 69/100 on livability (#394 in TX) — a middle-class / working-renter tenant base. Strengths: cost of living A+, housing A+, crime A; Watch: health & safety C-, amenities F, commute F.
- Booker ISD (rural): math 69% / reading 48% proficiency, ranked #146 of 1,141 in TX (top 13%) — acceptable for families but not a draw, mixed tenant base, ~2y average lease.
- Zoned schools: Kirksey El (math 72% / reading 62%, grade B+, #199 of 4,322 statewide, top 5%, 163 students, 60% FRL); Booker Jh/H S (math 57% / reading 47%, grade D+, #447 of 1,632 statewide, top 29%, 180 students, 55% FRL) — zoned schools at 58% FRL track the district average.
- Market conditions: 7 active listings in the ZIP.
Forward outlook
- In year one you build about $4k of equity ($622 loan paydown + $3k appreciation (3.3% local appreciation)).
- Lipscomb County population projected at +27% by 2050 — long-run rental-demand tailwind backs the buy-and-hold thesis.
- At projected returns (3.3% appreciation + 3.0% rent growth), your $25k cash investment doubles in ~4 years — after that, you're playing with house money.
- By year 9, paydown + projected appreciation supports a ~$30k cash-out refi (75% LTV) — recoverable capital for the next deal without selling this one.
Negotiation context
- It's been on market 155 days — a 12% lower offer ($79k) is reasonable based on typical stale-listing flexibility.
Risks & watch-outs
- Climate carrying-cost: major wildfire risk; extreme-heat days projected 6→15/yr by 2055 (HVAC capex compounding) — expect insurance premiums to compound above CPI over the hold.
Questions for the listing agent
- It's been on market 155 days. Have you received any prior offers? Is the seller open to a 12% concession, seller financing, or rate buy-down credit?
- Built in 1960 — when were the roof, HVAC, electrical panel, plumbing, and water heater last replaced?
- Why hasn't it sold? Are there any deal-killer items the seller is aware of (foundation, flood, title, zoning, code violations)?
- Is there a deadline driving the sale (1031 exchange, divorce, estate, relocation)? That informs how much negotiation room exists.
- What's the average days-on-market for RENTAL listings here right now (not sales)? A rising rental-DOM trend means longer vacancies and softer asking-rent achievability than the comps imply.
- What's the recent tenant-quality profile in this submarket — average credit score on applications, eviction rate, late-payment / NSF rate, and stable-employment percentage? A property-management company in the area should have these aggregated.
- How much new for-sale + rental construction is in the pipeline within 1–3 miles? Heavy new supply typically softens prices + rents 12–24 months out; constrained supply supports both.
Investment metrics
- 1% rule
- 1.17% ✓
- Cap rate
- 9.07%
- Cash-on-cash
- 9.93%
- DSCR
- 1.44
- GRM
- 7.1
CMA / ARV
No comps found within radius.
Projected returns pro-forma
3.28% appreciation · 3.0% rent growth · sell at horizon
- IRR
- 17.5%
- Equity multiple
- 2.01×
- Total profit
- $25,455
- Equity at exit
- $41,849
- IRR
- 18.7%
- Equity multiple
- 3.80×
- Total profit
- $70,414
- Equity at exit
- $65,626
Cash invested: $25,172 (down + closing). Projections, not guarantees.
Landlord ↔ Tenant lean methodology
- Overall (STATE)
- 87 Strongly Landlord-Friendly
- State Texas
- 87 Strongly Landlord-Friendly · R+5
- County
- — inherits STATE
- City
- — inherits STATE
ZIP-level market 79005
- Home prices YoY
- 4.1%
- Active inventory
- 7
- Price-to-rent
- 7.1×
Monthly cashflow live
- Estimated rent
- $1,050 medium interval (Pro) →
- Mortgage (P&I)
- −$471
- Tax est. 1.5%
- −$112 /mo · $1,348/yr
- Insurance
- −$37
- HOA
- −$0
- Vacancy / Maint / Mgmt
- −$221
- Net cashflow
- $208
Break-even live
Sensitivity live
| Price | -10% $270 | -5% $239 | +0% $208 | +5% $177 | +10% $146 |
|---|---|---|---|---|---|
| Rent | -10% $125 | -5% $167 | +0% $208 | +5% $250 | +10% $291 |
| Rate | -1.0pp $254 | -0.5pp $231 | base $208 | +0.5pp $185 | +1.0pp $161 |
UW: 25.0% down · 7.5% · 30yr · 1.5% tax · 5.0% vac · 8.0% maint · 8.0% mgmt
Financing live
Cash to close
- Down payment
- $22,475
- Closing costs
- $2,697
- Reserves months
- —
- Total cash needed
- —
Loan-product check · same deal, 3 products live
Conventional
25% down · 7.5% · 30yr
- Down + closing
- —
- Monthly P&I
- —
- Monthly cashflow
- —
- DSCR
- —
- Eligible?
- —
Personal DTI + credit; lowest rate.
DSCR
20% down · 8.5% · 30yr
- Down + closing
- —
- Monthly P&I
- —
- Monthly cashflow
- —
- DSCR
- —
- Eligible?
- —
No personal income docs; deal must DSCR.
Hard money
10% down · 12.0% · 12mo
- Down + closing
- —
- Monthly P&I
- —
- Monthly cashflow
- —
- DSCR
- —
- Eligible?
- —
Short-term bridge; refi at stabilization.
Listing history 20 events
-
2026-06-21days on market $89,900 Active 155 DOM
-
2026-06-21days on market $89,900 Active 154 DOM
-
2026-06-18days on market $89,900 Active 152 DOM
-
2026-06-17days on market $89,900 Active 151 DOM
-
2026-06-16days on market $89,900 Active 150 DOM
-
2026-06-15days on market $89,900 Active 149 DOM
-
2026-06-13days on market $89,900 Active 147 DOM
-
2026-06-12pricedays on market $89,900 Active 146 DOM
-
2026-06-09days on market $95,000 Active 143 DOM
-
2026-06-08days on market $95,000 Active 142 DOM
-
2026-06-08days on market $95,000 Active 141 DOM
-
2026-06-07days on market $95,000 Active 140 DOM
-
2026-06-03days on market $95,000 Active 137 DOM
-
2026-06-02days on market $95,000 Active 136 DOM
-
2026-06-01days on market $95,000 Active 135 DOM
-
2026-05-31days on market $95,000 Active 134 DOM
-
2026-05-19price $95,000 149-char remark
Show marketing remark (149 chars)
Home that was nicely updated within the last 2 years with wide open living spaces. Replaced flooring, texture, paint. Central heat/air. Near school.
-
2026-01-17$98,000 Active 149-char remark
Show marketing remark (149 chars)
Home that was nicely updated within the last 2 years with wide open living spaces. Replaced flooring, texture, paint. Central heat/air. Near school.
-
2025-10-04price $99,900
-
2025-08-18price $104,000
ⓘ Source: listings_history table (triggers on properties + properties_extension) + one-shot
backfill from property_details.listing_events for pre-trigger history.
Climate risk First Street
- Flood 1/10 Low 0% chance over 30 yrs
- Wildfire 7/10 Severe
- Heat 5/10 Major 6 d/yr ≥101°F today · 15 d/yr by 30 yrs out
- Wind 2/10 Low
- Air quality 1/10 Low 0 unhealthy d/yr today · 0 by 30 yrs out
Nearby sold comps map
Loading sold comps map…
Walkable amenities ~0.75 mi
Loading nearby amenities…
Taxation est. · year 1
- Rental income
- $12,602
- − Mortgage interest
- −$5,036
- − Property taxes
- −$1,348
- − Insurance
- −$450
- − Repairs & maintenance
- −$1,008
- − Management
- −$1,008
- − Depreciation
- −$2,615
- Taxable income
- $1,136
- Est. tax owed @ 24.0%
- −$273
- After-tax cash flow
- $2,227/yr
For passive investors: Depreciation is non-cash, so a rental often shows a tax loss while cash-flowing — sheltering income. Rental losses are passive: they offset passive income freely, and up to $25,000/yr can offset ordinary (W-2) income if you actively participate and your MAGI is under $100k (phasing out to $0 by $150k); unused losses carry forward. On sale, claimed depreciation is recaptured at up to 25%, and gains may owe capital-gains tax (a 1031 exchange can defer both). Figures are a year-1 estimate at your 24.0% rate — not tax advice; consult a CPA.
Condition & rehab AI · 5 photos
This single-family home has been updated within the last 2 years with fresh paint, new flooring, and updated appliances, making it move-in ready with good curb appeal.
Value-add opportunities
- Both Paint touch-ups — Fresh paint enhances curb appeal and interior aesthetics
- Both Landscaping — Well-maintained landscaping improves curb appeal and adds value
- Both Lighting upgrades — Modern lighting fixtures can enhance the home's appeal and functionality
Renovation cost estimate screening
Value-add ROI direction
- Both Paint touch-ups — Fresh paint enhances curb appeal and interior aesthetics ↑
- Both Landscaping — Well-maintained landscaping improves curb appeal and adds value ↑
- Both Lighting upgrades — Modern lighting fixtures can enhance the home's appeal and functionality ↑
ⓘ Cost ranges are severity-bucket heuristics (US national rule-of-thumb). Get contractor quotes + a written scope before underwriting a rehab budget.
Schools (NCES district)
- District
- Booker ISD
- NCES district ID
- 4810830
- Math proficiency
- 69% ▲ 9.00%
- Reading proficiency
- 48% ▲ 3.00%
- Median HH income
- $58,274
- Composite
- 52.33/100
- National rank
- #3433
- State rank
- #146 of 1141 in TX
Livability — Booker
- Score
- 69/100
- State rank
- #394
- US rank
- #8240
Category grades
Schools grade is shown separately in the Schools card above.
Census & demographics
- Census place
- Booker, TX
- Population (ZIP)
- 1,519
Population outlook (Lipscomb County) Hauer SSP2
- Today (2025)
- 4,045 people
- By 2030
- 4,275 · +5.7%
- By 2040
- 4,723 · +16.8%
- By 2050
- 5,121 · +26.6%
- By 2075
- 5,959 · +47.3%
- By 2100
- 6,040 · +49.3%
Race, ethnicity, and origin ACS 2023
- Neighborhood character
- Majority Hispanic (57%)
- Race & ethnicity
- Hispanic / Latino 57% White 38% Two or more races 16%
- Hispanic origin (detail)
- Mexican 47%
- Common ancestry
- Serbian 2% Italian 1% Slovak 1%
- Foreign-born
- 25% · Canada
- Languages at home
- 49% English-only · Spanish 49% Tagalog/Filipino 1%
Political lean MEDSL · Lipscomb
- 2024 margin
- Solid R (+79.6) · D 9.8% · R 89.4%
- 2008→2024 swing
- -4.9pp toward R · 2008: -74.7pp · 2024: -79.6pp
- All cycles
- 2024: R+79.6 2020: R+79.4 2016: R+77.5 2012: R+79.2 2008: R+74.7
Not yet ingested
- Civics
- —
Market trends
- HPI YoY
- ▲ 3.28%
- Current HPI
- 82.747
- Rent YoY
- —
- Metro
- —
- State GDP YoY
- ▲ 3.95%
- F500 in state
- 110
Industry mix (Fortune 500 HQ in TX)
| Industry | F500 HQs | Revenue |
|---|---|---|
| Energy | 16 | $1,198B |
|
||
| Technology | 5 | $198B |
|
||
| Engineering / Construction | 4 | $72B |
|
||
| Energy Services | 3 | $60B |
|
||
| Utilities | 3 | $41B |
|
||
| Healthcare | 2 | $330B |
|
||
Price history
-8.7% since first listed4 events — show timeline
- 2026-05-19 Price Changed $95,000 AARMLS
- 2026-01-17 Listed $98,000 AARMLS
- 2025-10-04 Price Changed $99,900 AARMLS
- 2025-08-18 Price Changed $104,000 AARMLS
Cash-flow waterfall
monthlySold comps — $/sqft
last 12 mo · ≤1 miLoading sold comps…