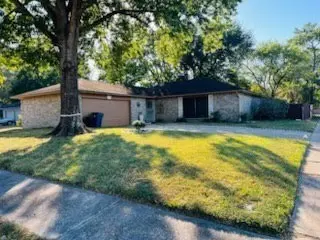
19815 Pinefield Ct · Houston, TX
Flood risk 1/10 · Minimal
- FEMA flood zone
- X (unshaded)
- Chance of flooding over 30 yrs
- 0.0%
- Est. flood insurance / yr
- $507 – $1,088
Fire risk 3/10 · Minor
- Est. fire insurance / yr
- $1,222 – $2,270
Heat risk 9/10 · Severe
- Hot days now (above 110°F)
- 7 days/yr
- Hot days in 30 yrs
- 24 days/yr
Wind risk 9/10 · Severe
- Chance of severe wind over 30 yrs
- 99.0%
Air-quality risk 3/10 · Minor
- Unhealthy air days now
- 3 days/yr
- Unhealthy air days in 30 yrs
- 3 days/yr
Risk factors via First Street. Map © Google.
Why this score? — see what drove the D grade
The composite is a weighted blend of 9 inputs, each scored 0–100. Each bar is that input's sub-score; the figure is the points it added to the 100-point composite (weight × sub-score).
- ARV discount +10.4/15.0
- Cash flow +9.3/30.0
- Appreciation +4.6/10.0
- 1% rule +3.8/10.0
- Livability +3.7/5.0
- Rent growth +3.0/5.0
- DSCR +2.6/10.0
- Condition / age +2.5/5.0
- Schools +1.5/10.0
$195,000
🖨 Deal sheet (PDF) 📄 Offer letter ✓ Due diligence
Listing remarks MLS
Discover a fantastic opportunity in a quiet, sought-after Humble neighborhood! This solid three-bedroom, two-bathroom home sits proudly on a spacious corner lot, offering the perfect canvas for your vision. With a two-car garage and a peaceful location, this property is packed with potential waiting to be unlocked. A True Diamond in the Rough: Prime & Peaceful Location: Enjoy the best of Humble living on a serene street in an established community. The corner lot provides extra space, privacy, and future possibilities. Strong Foundation: The home boasts a fantastic, functional layout with great bones. The living areas are spacious, the three bedrooms are well-proportioned, and the two-bathroom setup is ideal. Investor or DIY Dream: Calling all visionaries, investors, and hands-on buyers! This home needs some TLC and cosmetic updates, allowing you to customize it to your exact taste and build instant equity.
Key facts
- 6,655 sq ft lot
- 2 garage spots
- Built 1979
Neighborhood map
What this means for you Summary
Snapshot
- This is a 3-bed/2.0-bath single-family listed at $195k.
Deal economics
- At list price, monthly cash flow is $-144 ($-2k/yr) — negative.
- To cash-flow at today's rent, offer at most $169k (13.1% below list).
- To meet the 1% rule (rent ≥ 1% of price), the offer needs to be $171k (12.4% below list).
- Recommended offer: $169k (13.1% below list) — sets the bar for cash-flow.
- Cap rate 5.4% vs local median 3.2% in Houston — top-decile yield for the area; either an underpriced asset or a hidden risk that comps aren't pricing in. Stress-test before assuming the spread holds.
Location & tenants
- Location reads 74/100 on livability (#184 in TX, #4,771 nationally) — a middle-class / working-renter tenant base. Strengths: amenities A+, cost of living A+, housing A+; Watch: crime F.
- Aldine ISD (suburban): math 16% / reading 21% proficiency, ranked #790 of 826 in TX (top 96%) — low school quality limits family demand, transient renter base, plan for 1-2y turnover; 79% free/reduced lunch — lower-income household profile, screen leases tightly.
- Zoned schools: Jones Ec/Pk/K (779 students, 92% FRL); Teague Middle (math 14% / reading 22%, grade F, #1,491 of 1,662 statewide, top 91%, 1,180 students, 87% FRL); Aldine H S (math 15% / reading 20%, grade F, #1,451 of 1,632 statewide, top 89%, 2,663 students, 94% FRL).
- Market conditions: Rents rising (+2.2%/yr); 312 active listings in the ZIP; 40 comparable units currently listed for rent nearby; rentals leasing fast (median 9d on market — plan ~1-2 weeks tenant-placement turnaround); 29,883 units permitted in Harris County in 2024 (8,621 in 5+ unit buildings).
- This rent runs 32% of the median local income ($65k/yr) — at the standard rent-burdened threshold; future hikes will face affordability resistance.
Forward outlook
- Local home prices are declining (-0.8%/yr); year-one equity from $1k of loan paydown is wiped out by about $2k of value loss. Plan a longer hold.
- Harris County population projected at +47% by 2050 — long-run rental-demand tailwind backs the buy-and-hold thesis.
Negotiation context
- It's been on market 61 days — a 6% lower offer ($183k) is reasonable based on typical stale-listing flexibility.
- 2 sale attempts with the ask held roughly flat each time — persistent listings suggest the price (not the market) is what's stuck; bring a comps-based counter.
Risks & watch-outs
- Climate carrying-cost: severe wind risk, 99% chance of damaging wind over 30y; extreme-heat days projected 7→24/yr by 2055 (HVAC capex compounding) — expect insurance premiums to compound above CPI over the hold.
Questions for the listing agent
- What do current leases actually rent for vs. the listed asking? Can we see a recent rent roll and the last 12 months of T-12 income?
- It's been on market 61 days. Have you received any prior offers? Is the seller open to a 13% concession, seller financing, or rate buy-down credit?
- Built in 1979 — when were the roof, HVAC, electrical panel, plumbing, and water heater last replaced?
- What does the HOA fee cover, when was the last increase, and are there any pending special assessments or reserve-fund shortfalls?
- Why hasn't it sold? Are there any deal-killer items the seller is aware of (foundation, flood, title, zoning, code violations)?
- Is there a deadline driving the sale (1031 exchange, divorce, estate, relocation)? That informs how much negotiation room exists.
- Schools are D-rated, which usually means shorter tenancies and higher turnover. Who's the typical renter profile here, and what's been the actual vacancy rate?
- Crime grade is F in this area — have there been break-ins, vandalism, or insurance claims at this property in the last 3 years? What carrier currently insures it and at what premium?
- The area grade is low — what's the realistic commute time and amenity access for the typical tenant pool here? Any planned neighborhood developments (good or bad) we should know about?
- What's the average days-on-market for RENTAL listings here right now (not sales)? A rising rental-DOM trend means longer vacancies and softer asking-rent achievability than the comps imply.
- What's the recent tenant-quality profile in this submarket — average credit score on applications, eviction rate, late-payment / NSF rate, and stable-employment percentage? A property-management company in the area should have these aggregated.
- How much new for-sale + rental construction is in the pipeline within 1–3 miles? Heavy new supply typically softens prices + rents 12–24 months out; constrained supply supports both.
Investment metrics
- 1% rule
- 0.88% ✗
- Cap rate
- 5.40%
- Cash-on-cash
- -3.17%
- DSCR
- 0.86
- GRM
- 9.5
CMA / ARV
- ARV (median comp)
- $208,578
- List price
- $195,000
- Delta
- -6.51%
- Verdict
- FAIR
- Comps
- 20 within 1.0 mi
Show comp detail 12 sales within ~0.75 mi
| Address | Dist | Beds/Ba | Sqft | Sold | Price | $/sf | Match |
|---|---|---|---|---|---|---|---|
| 19834 Lions Gate Ct | 0.09mi | 3/2.0 | 1,348 (0%) | 1mo | $204,900 | $152 | 95 |
| 19907 Lions Gate Dr | 0.07mi | 3/2.0 | 1,428 (+6%) | 1mo | $209,000 | $146 | 86 |
| 20011 Lions Gate Dr | 0.14mi | 3/2.0 | 1,394 (+3%) | 2mo | $205,900 | $148 | 86 |
| 8315 Marble Arch Ct | 0.14mi | 4/2.0 (+1) | 1,444 (+7%) | 3mo | $209,000 | $145 | 74 |
| 20014 Bishops Gate Ln | 0.24mi | 3/2.0 | 1,472 (+9%) | 2mo | $190,995 | $130 | 72 |
| 8226 Forest Point Dr | 0.23mi | 3/2.0 | 1,481 (+10%) | 2mo | $169,680 | $115 | 71 |
| 9006 Wildbird Ln | 0.54mi | 4/2.0 (+1) | 1,335 (-1%) | 2mo | $211,000 | $158 | 67 |
| 8315 Old Maple Ln | 0.45mi | 3/2.0 | 1,480 (+10%) | 4mo | $199,999 | $135 | 60 |
| 9027 Aspen Trace Ln | 0.68mi | 4/2.0 (+1) | 1,363 (+1%) | 5mo | $159,000 | $117 | 57 |
| 9030 Serena Ln | 0.65mi | 4/2.0 (+1) | 1,310 (-3%) | 3mo | $215,000 | $164 | 57 |
| 8918 Blue Cedar Ln | 0.57mi | 4/2.0 (+1) | 1,225 (-9%) | 1mo | $211,900 | $173 | 52 |
| 20426 Kittredge Dr | 0.65mi | 3/2.0 | 1,486 (+10%) | 3mo | $174,900 | $118 | 50 |
Match score weights: distance 35% · size 25% · config 20% · recency 20%. Top-matched comps best support the ARV.
Projected returns pro-forma
-0.77% appreciation · 2.17% rent growth · sell at horizon
- IRR
- -9.7%
- Equity multiple
- 0.58×
- Total profit
- $-23,193
- Equity at exit
- $49,187
- IRR
- -3.8%
- Equity multiple
- 0.65×
- Total profit
- $-19,325
- Equity at exit
- $53,475
Cash invested: $54,600 (down + closing). Projections, not guarantees.
Landlord ↔ Tenant lean methodology
- Overall (STATE)
- 87 Strongly Landlord-Friendly
- State Texas
- 87 Strongly Landlord-Friendly · R+5
- County
- — inherits STATE
- City
- — inherits STATE
ZIP-level market 77338
- Home prices YoY
- -0.3%
- Rents YoY
- 2.2%
- Active inventory
- 312
- Price-to-rent
- 9.5×
Monthly cashflow live
- Estimated rent
- $1,707 high interval (Pro) →
- Mortgage (P&I)
- −$1,023
- Tax from tax record
- −$368 /mo · $4,422/yr
- Insurance
- −$81
- HOA
- −$21
- Vacancy / Maint / Mgmt
- −$359
- Net cashflow
- $-144
Break-even live
Sensitivity live
| Price | -10% $-34 | -5% $-89 | +0% $-144 | +5% $-200 | +10% $-255 |
|---|---|---|---|---|---|
| Rent | -10% $-279 | -5% $-212 | +0% $-144 | +5% $-77 | +10% $-10 |
| Rate | -1.0pp $-46 | -0.5pp $-95 | base $-144 | +0.5pp $-195 | +1.0pp $-246 |
UW: 25.0% down · 7.5% · 30yr · 1.5% tax · 5.0% vac · 8.0% maint · 8.0% mgmt
Financing live
Cash to close
- Down payment
- $48,750
- Closing costs
- $5,850
- Reserves months
- —
- Total cash needed
- —
Loan-product check · same deal, 3 products live
Conventional
25% down · 7.5% · 30yr
- Down + closing
- —
- Monthly P&I
- —
- Monthly cashflow
- —
- DSCR
- —
- Eligible?
- —
Personal DTI + credit; lowest rate.
DSCR
20% down · 8.5% · 30yr
- Down + closing
- —
- Monthly P&I
- —
- Monthly cashflow
- —
- DSCR
- —
- Eligible?
- —
No personal income docs; deal must DSCR.
Hard money
10% down · 12.0% · 12mo
- Down + closing
- —
- Monthly P&I
- —
- Monthly cashflow
- —
- DSCR
- —
- Eligible?
- —
Short-term bridge; refi at stabilization.
Rent comps 40 comps
| Address | Beds | Baths | Sqft | Rent | $/sqft | DOM | Units | Dist |
|---|---|---|---|---|---|---|---|---|
| 19902 Bishops Gate Ln Humble, TX | 3.0 | 2.0 | 1570 | $1,825 | $1.16 | 26d | 1 | 0.14mi |
| 20102 Bridgedale Ln Humble, TX | 3.0 | 2.0 | 1635 | $1,999 | $1.22 | 45d | 1 | 0.23mi |
| 19806 Kenswick Dr Humble, TX | 2.0 | 2.0 | 934 | $1,281 | $1.37 | 45d | 1 | 0.24mi |
| 19815 Kenswick Dr Humble, TX | 1.0–2.0 | 1.0–2.0 | 935 | $1,756 | $1.88 | 0d | 63 | 0.27mi |
| 19800 Kenswick Dr Unit 2148 Humble, TX | 2.0 | 2.0 | 934 | $1,410 | $1.51 | 0d | 1 | 0.28mi |
| 19800 Kenswick Dr Unit 2112 Humble, TX | 2.0 | 2.0 | 934 | $1,359 | $1.46 | 1d | 1 | 0.28mi |
| 19800 Kenswick Dr Apt 422 Humble, TX | 2.0 | 2.0 | 934 | $1,375 | $1.47 | 9d | 1 | 0.28mi |
| 19800 Kenswick Dr Unit 424 Humble, TX | 2.0 | 2.0 | 934 | $1,375 | $1.47 | 7d | 1 | 0.28mi |
| 19800 Kenswick Dr Unit 19857 Humble, TX | 2.0 | 2.0 | 934 | $1,399 | $1.50 | 12d | 1 | 0.28mi |
| 20126 Chipplegate Ln Humble, TX | 3.0 | 2.0 | 1348 | $1,800 | $1.34 | 45d | 1 | 0.35mi |
| 20327 Bridgedale Ln Humble, TX | 3.0 | 2.0 | 1226 | $1,736 | $1.42 | 1d | 1 | 0.36mi |
| 20211 Cottonglade Ln Humble, TX | 3.0 | 2.0 | 1348 | $1,699 | $1.26 | 45d | 1 | 0.47mi |
| 20211 Cottonglade Ln Humble, TX | 3.0 | 2.0 | 1348 | $1,699 | $1.26 | 1d | 1 | 0.47mi |
| 20418 Red Canyon Creek Ln Humble, TX | 4.0 | 2.0 | 1731 | $2,000 | $1.16 | 24d | 1 | 0.52mi |
| 7810 Birchbark Dr Humble, TX | 3.0 | 2.0 | 1663 | $1,899 | $1.14 | 26d | 1 | 0.61mi |
| 8902 Snapping Turtle Dr Humble, TX | 3.0 | 2.0 | 1414 | $1,729 | $1.22 | 9d | 1 | 0.73mi |
| 9393 Farm to Market 1960 Bypass Rd W Humble, TX | 1.0–3.0 | 1.0–2.0 | 1033 | $2,001 | $1.94 | 0d | 30 | 0.74mi |
| 20538 Faith Millstream Dr Humble, TX | 4.0 | 2.0 | 1627 | $1,931 | $1.19 | 24d | 1 | 0.94mi |
| 7318 Foxway Ln Humble, TX | 3.0 | 2.0 | 1750 | $1,759 | $1.01 | 26d | 1 | 0.97mi |
| 21235 Grand Field Ct Humble, TX | 4.0 | 3.0 | 1750 | $1,800 | $1.03 | 45d | 1 | 1.00mi |
| 19106 Sears Dr Unit B Humble, TX | 3.0 | 2.5 | 1228 | $1,895 | $1.54 | 9d | 1 | 1.04mi |
| 19710 Townsen Blvd Humble, TX | 2.0 | 2.0 | 1174 | $1,697 | $1.45 | 26d | 1 | 1.06mi |
| 7214 Foxbend Ln Humble, TX | 3.0 | 2.0 | 1591 | $1,975 | $1.24 | 1d | 1 | 1.11mi |
| 7160 Foxbrick Ln Humble, TX | 1.0–2.0 | 1.0–2.0 | 872 | $1,575 | $1.81 | 1d | 2 | 1.12mi |
| 7160 Foxbrick Ln Humble, TX | 2.0 | 1.0–2.0 | 976 | $1,438 | $1.47 | 7d | 1 | 1.12mi |
| 7160 Foxbrick Ln Unit LANE12208 Humble, TX | 2.0 | 1.0 | 942 | $1,325 | $1.41 | 1d | 1 | 1.12mi |
| 7160 Foxbrick Ln Unit LANE14103 Humble, TX | 2.0 | 1.0 | 942 | $1,450 | $1.54 | 45d | 1 | 1.12mi |
| 7507 Kennemer Dr Humble, TX | 3.0 | 2.5 | 1596 | $1,766 | $1.11 | 13d | 1 | 1.15mi |
| 19920 Foxwood Forest Blvd Unit 19977 Humble, TX | 2.0 | 2.0 | 921 | $1,280 | $1.39 | 0d | 1 | 1.18mi |
| 19920 Foxwood Forest Blvd Unit 422 Humble, TX | 2.0 | 2.0 | 921 | $1,245 | $1.35 | 9d | 1 | 1.18mi |
| 19920 Foxwood Forest Blvd Unit 424 Humble, TX | 2.0 | 2.0 | 921 | $1,245 | $1.35 | 7d | 1 | 1.18mi |
| 7150 Foxbrick Ln Unit LANE5201 Humble, TX | 2.0 | 2.0 | 1011 | $1,425 | $1.41 | 1d | 1 | 1.20mi |
| 7150 Foxbrick Ln Humble, TX | 1.0–2.0 | 1.0–2.0 | 872 | $1,625 | $1.86 | 45d | 4 | 1.20mi |
| 9494 Humble Westfield Rd Unit 2165 Humble, TX | 2.0 | 2.0 | 1325 | $1,235 | $0.93 | 1d | 1 | 1.22mi |
| 9494 Humble Westfield Rd Unit 9551 Humble, TX | 2.0 | 2.0 | 1325 | $1,150 | $0.87 | 45d | 1 | 1.23mi |
| 9494 Humble Westfield Rd Unit 422 Humble, TX | 2.0 | 2.0 | 1325 | $1,210 | $0.91 | 9d | 1 | 1.23mi |
| 9494 Humble Westfield Rd Unit 2162 Humble, TX | 2.0 | 2.0 | 1325 | $1,210 | $0.91 | 7d | 1 | 1.23mi |
| 9494 Humble Westfield Rd Unit 2148 Humble, TX | 2.0 | 2.0 | 1325 | $1,245 | $0.94 | 0d | 1 | 1.23mi |
| 9494 Humble Westfield Rd Unit 425 Humble, TX | 2.0 | 2.0 | 1325 | $1,031 | $0.78 | 17d | 1 | 1.23mi |
| 9494 Humble Westfield Rd Unit 9551 Humble, TX | 2.0 | 2.0 | 1325 | $1,234 | $0.93 | 12d | 1 | 1.23mi |
HOA detail
- Monthly dues
- $21 · $252/yr
Listing history 5 events
-
2026-05-18status Pending 936-char remark
Show marketing remark (936 chars)
Discover a fantastic opportunity in a quiet, sought-after Humble neighborhood! This solid three-bedroom, two-bathroom home sits proudly on a spacious corner lot, offering the perfect canvas for your vision. With a two-car garage and a peaceful location, this property is packed with potential waiting to be unlocked. A True Diamond in the Rough: Prime & Peaceful Location: Enjoy the best of Humble living on a serene street in an established community. The corner lot provides extra space, privacy, and future possibilities. Strong Foundation: The home boasts a fantastic, functional layout with great bones. The living areas are spacious, the three bedrooms are well-proportioned, and the two-bathroom setup is ideal. Investor or DIY Dream: Calling all visionaries, investors, and hands-on buyers! This home needs some TLC and cosmetic updates, allowing you to customize it to your exact taste and build instant equity.
-
2026-05-11status Active 936-char remark
Show marketing remark (936 chars)
Discover a fantastic opportunity in a quiet, sought-after Humble neighborhood! This solid three-bedroom, two-bathroom home sits proudly on a spacious corner lot, offering the perfect canvas for your vision. With a two-car garage and a peaceful location, this property is packed with potential waiting to be unlocked. A True Diamond in the Rough: Prime & Peaceful Location: Enjoy the best of Humble living on a serene street in an established community. The corner lot provides extra space, privacy, and future possibilities. Strong Foundation: The home boasts a fantastic, functional layout with great bones. The living areas are spacious, the three bedrooms are well-proportioned, and the two-bathroom setup is ideal. Investor or DIY Dream: Calling all visionaries, investors, and hands-on buyers! This home needs some TLC and cosmetic updates, allowing you to customize it to your exact taste and build instant equity.
-
2026-01-26status Pending 936-char remark
Show marketing remark (936 chars)
Discover a fantastic opportunity in a quiet, sought-after Humble neighborhood! This solid three-bedroom, two-bathroom home sits proudly on a spacious corner lot, offering the perfect canvas for your vision. With a two-car garage and a peaceful location, this property is packed with potential waiting to be unlocked. A True Diamond in the Rough: Prime & Peaceful Location: Enjoy the best of Humble living on a serene street in an established community. The corner lot provides extra space, privacy, and future possibilities. Strong Foundation: The home boasts a fantastic, functional layout with great bones. The living areas are spacious, the three bedrooms are well-proportioned, and the two-bathroom setup is ideal. Investor or DIY Dream: Calling all visionaries, investors, and hands-on buyers! This home needs some TLC and cosmetic updates, allowing you to customize it to your exact taste and build instant equity.
-
2025-12-03$195,000 Active 936-char remark
Show marketing remark (936 chars)
Discover a fantastic opportunity in a quiet, sought-after Humble neighborhood! This solid three-bedroom, two-bathroom home sits proudly on a spacious corner lot, offering the perfect canvas for your vision. With a two-car garage and a peaceful location, this property is packed with potential waiting to be unlocked. A True Diamond in the Rough: Prime & Peaceful Location: Enjoy the best of Humble living on a serene street in an established community. The corner lot provides extra space, privacy, and future possibilities. Strong Foundation: The home boasts a fantastic, functional layout with great bones. The living areas are spacious, the three bedrooms are well-proportioned, and the two-bathroom setup is ideal. Investor or DIY Dream: Calling all visionaries, investors, and hands-on buyers! This home needs some TLC and cosmetic updates, allowing you to customize it to your exact taste and build instant equity.
-
2005-12-07soldstatus
ⓘ Source: listings_history table (triggers on properties + properties_extension) + one-shot
backfill from property_details.listing_events for pre-trigger history.
Tax reassessment forecast TX · Resets to sale price
- Current annual tax
- $4,422 · $368/mo
- Projected year-2 tax
- $4,422 · $368/mo
- Expected delta
- $0/yr ($0/mo · 0.0%)
ⓘ Screening estimate from a state-policy table — verify with the county assessor before closing.
Climate risk First Street
- Flood 1/10 Low FEMA zone X (unshaded) · 0% chance over 30 yrs
- Wildfire 3/10 Moderate
- Heat 9/10 Extreme 7 d/yr ≥110°F today · 24 d/yr by 30 yrs out
- Wind 9/10 Extreme 99% chance of damaging wind over 30 yrs
- Air quality 3/10 Moderate 3 unhealthy d/yr today · 3 by 30 yrs out
Nearby sold comps map
Loading sold comps map…
Walkable amenities ~0.75 mi
Loading nearby amenities…
Taxation est. · year 1
- Rental income
- $20,490
- − Mortgage interest
- −$10,923
- − Property taxes
- −$4,422
- − Insurance
- −$975
- − Repairs & maintenance
- −$1,639
- − Management
- −$1,639
- − HOA
- −$252
- − Depreciation
- −$5,673
- Taxable loss
- −$5,033
- Est. tax savings @ 24.0%
- +$1,208
- After-tax cash flow
- $-525/yr
For passive investors: Depreciation is non-cash, so a rental often shows a tax loss while cash-flowing — sheltering income. Rental losses are passive: they offset passive income freely, and up to $25,000/yr can offset ordinary (W-2) income if you actively participate and your MAGI is under $100k (phasing out to $0 by $150k); unused losses carry forward. On sale, claimed depreciation is recaptured at up to 25%, and gains may owe capital-gains tax (a 1031 exchange can defer both). Figures are a year-1 estimate at your 24.0% rate — not tax advice; consult a CPA.
Schools (NCES district)
- District
- Aldine ISD
- NCES district ID
- 4807710
- Math proficiency
- 16% ▼ -23.00%
- Reading proficiency
- 21% ▼ -11.00%
- Median HH income
- $37,081
- Composite
- 15.42/100
- National rank
- #9317
- State rank
- #790 of 826 in TX
Livability — Houston
- Score
- 74/100
- State rank
- #184
- US rank
- #4771
Category grades
Schools grade is shown separately in the Schools card above.
Census & demographics
- County
- Harris County · 4,702,590 people
- City population
- 3,226,434
- Metro
- Houston-The Woodlands-Sugar Land, TX
- Population (ZIP)
- 48,031
- Household income
- $64,755
- Rent vs Own
- Severe rent burden
- 2620.0
Population outlook (Harris County) Hauer SSP2
- Today (2025)
- 5,571,493 people
- By 2030
- 6,089,821 · +9.3%
- By 2040
- 7,142,806 · +28.2%
- By 2050
- 8,185,864 · +46.9%
- By 2075
- 10,574,329 · +89.8%
- By 2100
- 12,109,958 · +117.4%
Race, ethnicity, and origin ACS 2023
- Neighborhood character
- Diverse neighborhood (Simpson 0.69)
- Race & ethnicity
- Hispanic / Latino 41% Black 34% Two or more races 18% White 16% Asian 3%
- Hispanic origin (detail)
- Mexican 29% Puerto Rican 1%
- Common ancestry
- Lithuanian 4% Armenian 1% Serbian 1%
- Foreign-born
- 17% · Canada, Jamaica
- Languages at home
- 60% English-only · Spanish 35% Arabic 1% Other Indo-European 1%
Political lean MEDSL · Harris
- 2024 margin
- Lean D (+5.5) · D 52.0% · R 46.4% · Other 1.6%
- 2008→2024 swing
- +3.9pp toward D · 2008: 1.6pp · 2024: 5.5pp
- All cycles
- 2024: D+5.5 2020: D+13.3 2016: D+12.4 2012: D+0.1 2008: D+1.6
Not yet ingested
- Civics
- —
Market trends
- HPI YoY
- ▼ -0.77%
- Current HPI
- 245.7087
- Rent YoY
- ▲ 2.17%
- Metro
- Houston-The Woodlands-Sugar Land, TX
- State GDP YoY
- ▲ 3.95%
- F500 in state
- 110
Industry mix (Fortune 500 HQ in TX)
| Industry | F500 HQs | Revenue |
|---|---|---|
| Energy | 16 | $1,198B |
|
||
| Technology | 5 | $198B |
|
||
| Engineering / Construction | 4 | $72B |
|
||
| Energy Services | 3 | $60B |
|
||
| Utilities | 3 | $41B |
|
||
| Healthcare | 2 | $330B |
|
||
Price history
5 events — show timeline
- 2026-05-18 Pending — HARMLS
- 2026-05-11 Relisted — HARMLS
- 2026-01-26 Pending — HARMLS
- 2025-12-03 Listed $195,000 HARMLS
- 2005-12-07 Sold (Public Records) — Public Records
Property tax history
+4.6%/yrLatest (2025): $4,422 · +0.8% YoY. Source: county tax records.
Cash-flow waterfall
monthlySold comps — $/sqft
last 12 mo · ≤1 miLoading sold comps…